Air Pollution
Introduction
Pollution is indeed the unwelcome presence of substances in the environment, often due to human activities, that can cause harm to living organisms. These substances, known as pollutants, come in various forms - physical, chemical, or biological.
They can directly or indirectly pose threats to human health and the well-being of other organisms sharing the environment.
Some common examples include carbon emissions from vehicles, industrial chemicals, plastic waste, and agricultural runoff.
Classification of Pollutants
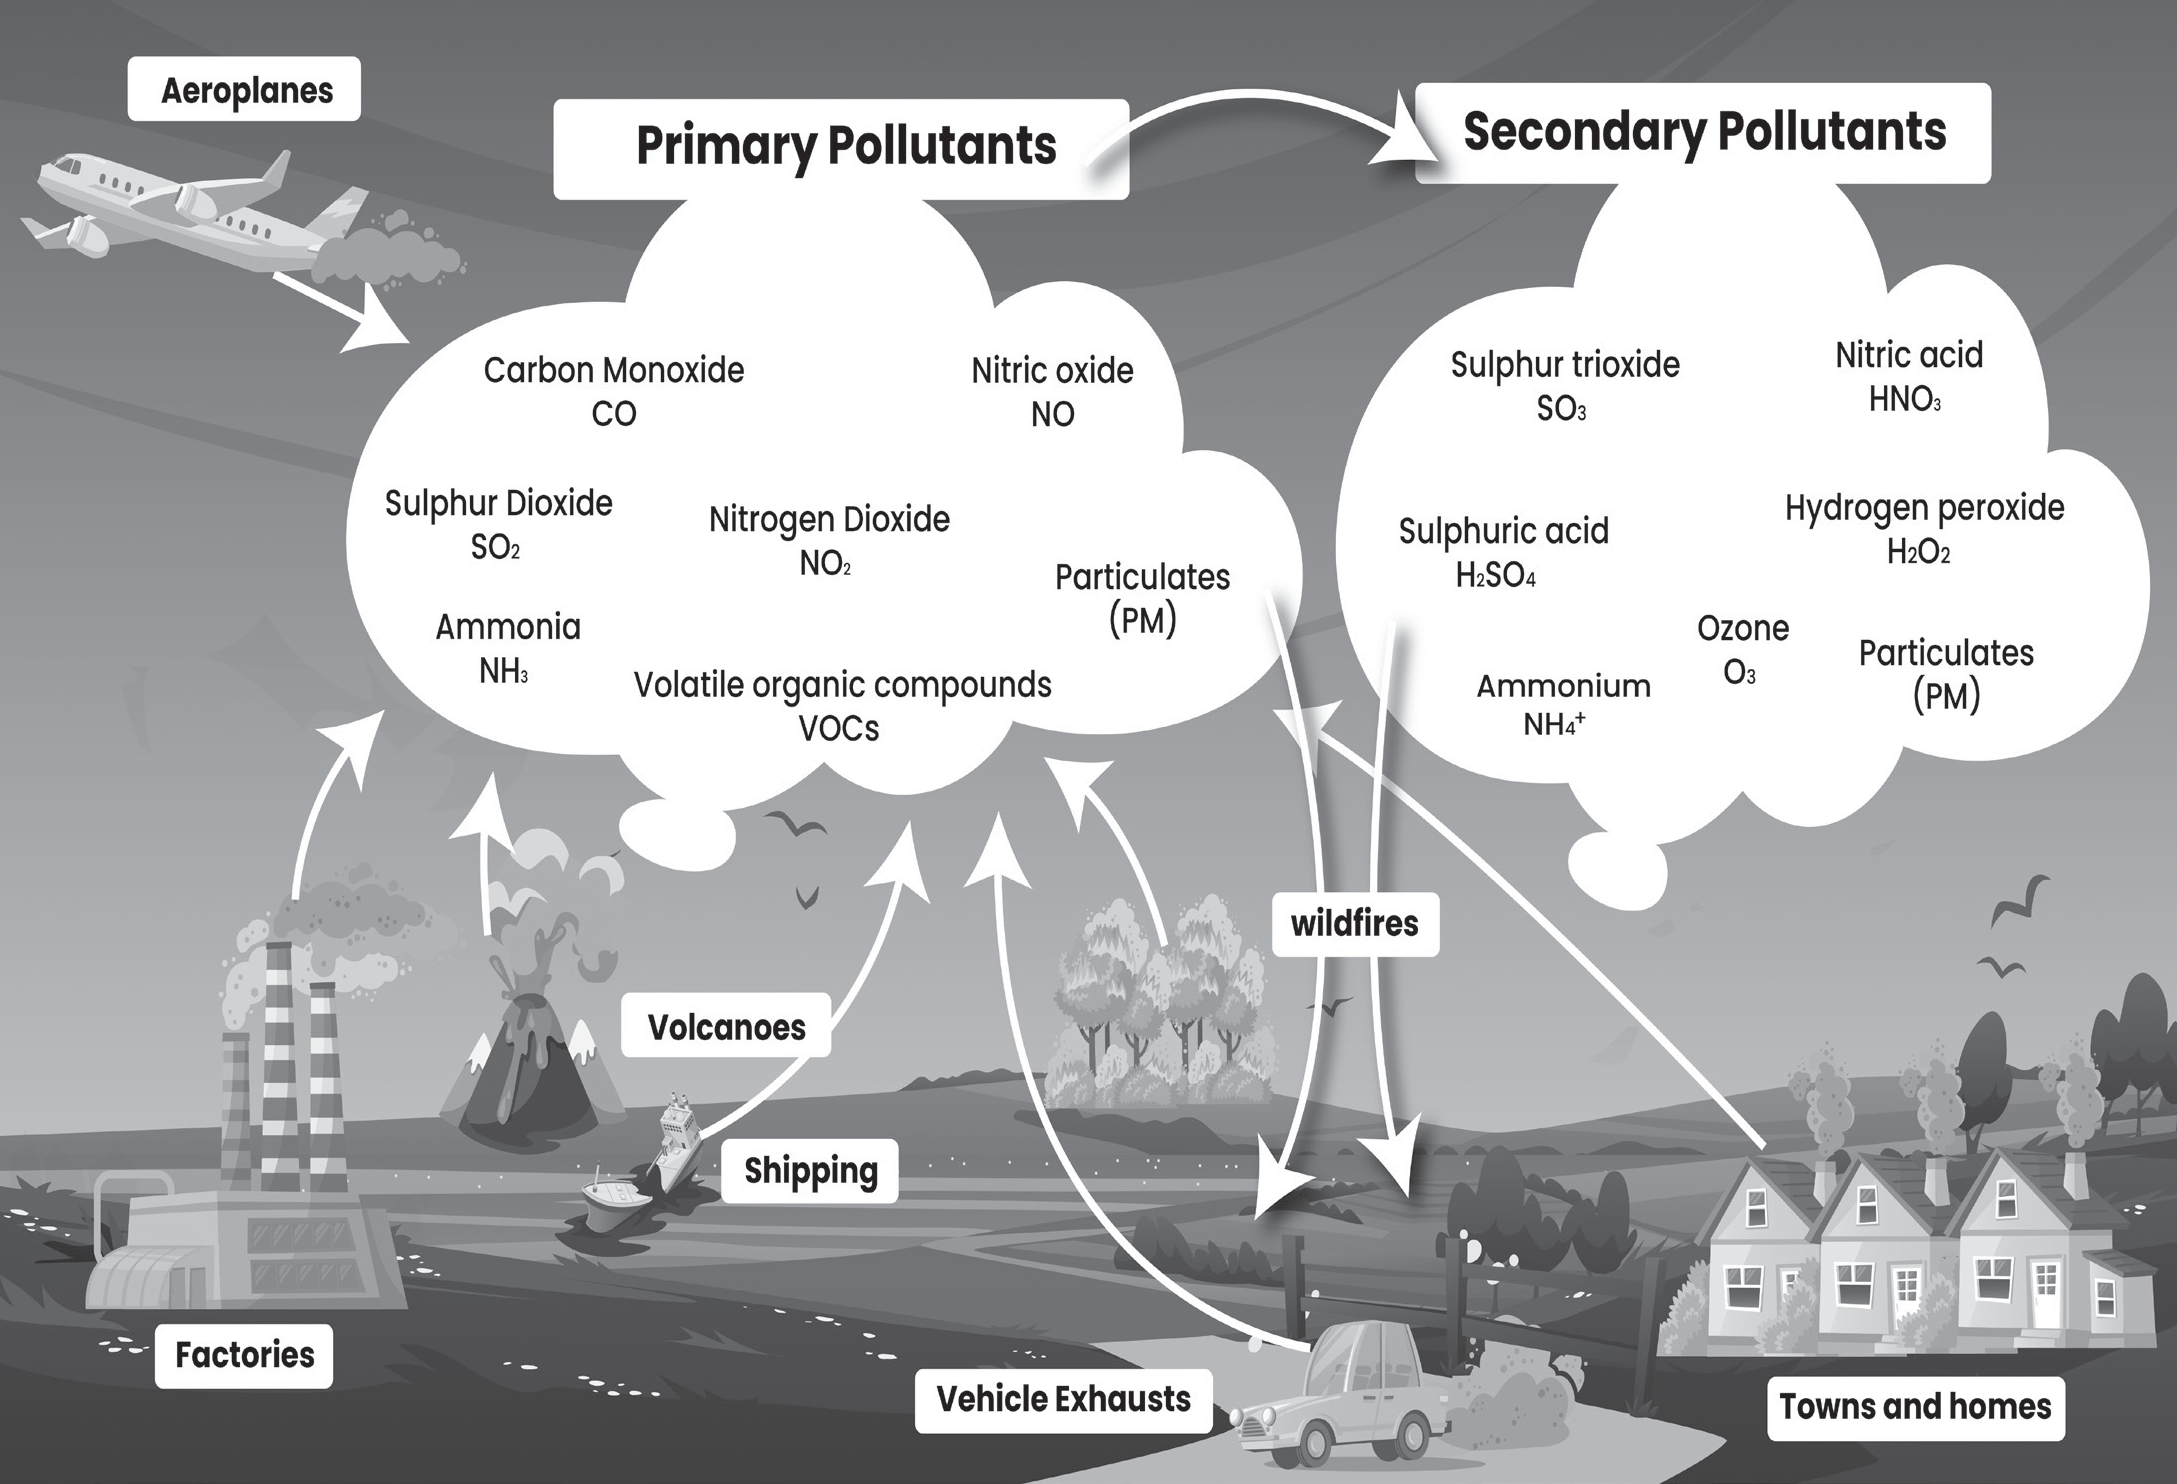
Primary pollutants: These are the pollutants that are directly emitted into the environment in their original form. Examples include substances like dichloro- diphenyl-tri chloroethane (DDT), plastic particles, carbon monoxide (CO), carbon dioxide (CO2), nitrogen oxides (NOx), and sulphur oxides (SOx). They come from sources like vehicles, industrial processes, and burning fossil fuels.
Secondary pollutants: Unlike primary pollutants, these are not directly emitted. Instead, they form in the environment through chemical reactions among primary pollutants. For instance, when nitrogen oxides and hydrocarbons interact with sunlight and other atmospheric components, they can produce secondary pollutants like peroxyacetyl nitrate (PAN). These secondary pollutants can contribute to smog and other forms of air pollution.
Examples of Secondary Pollutants:
Ozone: This forms when certain pollutants like hydrocarbons (HC) or Volatile Organic Compounds (VOCs) combine with nitrogen oxides (NOx) in the presence of sunlight.
Nitrogen dioxide (NO2): This forms when NO combines with oxygen in the air.
Acid rain: This occurs when pollutants like sulphur dioxide (SO2) or nitrogen oxides react with rainwater, forming acidic compounds.
According to their Existence in Nature:
Quantitative Pollutants: These are substances that naturally occur in the environment but become pollutants
when their concentration exceeds a certain level. Examples include carbon dioxide (CO2) and nitrogen oxides (NOx).
Qualitative Pollutants: These are human-made substances that don’t exist naturally in the environment. Examples include synthetic chemicals like fungicides, herbicides, and pesticides such as DDT.
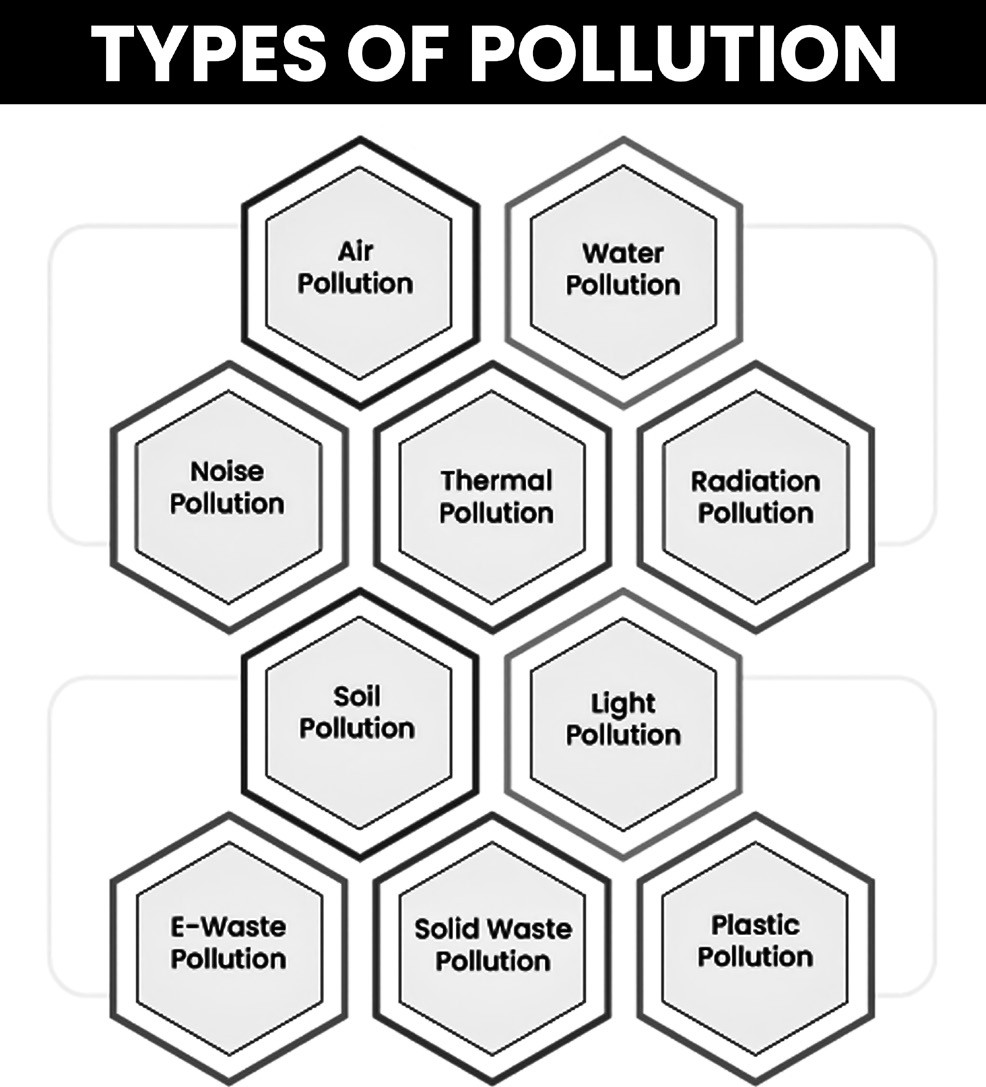
Air Pollution
Air pollution refers to the presence of harmful substances like solids, liquids, gases, noise, and radiation in the air. These substances can harm humans, animals, and the environment.
Burning fossil fuels like coal and oil in industries, transportation, and other activities is a major cause of air pollution. These fuels contain nitrogen and sulphur,
which, when burned, produce oxides that combine with water vapour to form acids. Acid rain, a result of this process, damages structures like the Taj Mahal.
Besides acid rain, burning fossil fuels releases pollutants like chlorofluorocarbons (CFCs), which harm the ozone layer, and suspended particles that reduce visibility and cause smog, especially in cold weather.
Chlorofluorocarbons (CFCs) are used in refrigerators, air conditioners, and aerosol sprays. They harm the ozone layer when released into the atmosphere.
High levels of pollutants in the air, especially during cold weather, lead to reduced visibility known as smog.
Major Causes of Air Pollution
Vehicular Emissions: Cars and other vehicles release harmful pollutants like carbon monoxide (CO), nitrogen oxides (NOx), and Non-Methane Volatile Organic Compounds (NMVOCs) such as benzene and formaldehyde. These pollutants make up more than 80% of vehicle emissions. Some other emissions from vehicles include methane (CH4), carbon dioxide (CO2), sulphur oxides (SOx), and tiny particles called total suspended particles (TSPs). Traffic jams make the emission problem worse.
Industrial Emissions: Industries like iron and steel, sugar, paper, cement, fertiliser, copper, and aluminum also release pollutants. These include suspended particulate matter (SPM), sulphur oxides (SOx), nitrogen oxides (NOx), and carbon dioxide (CO2).
Improper Use of Pyrolysis
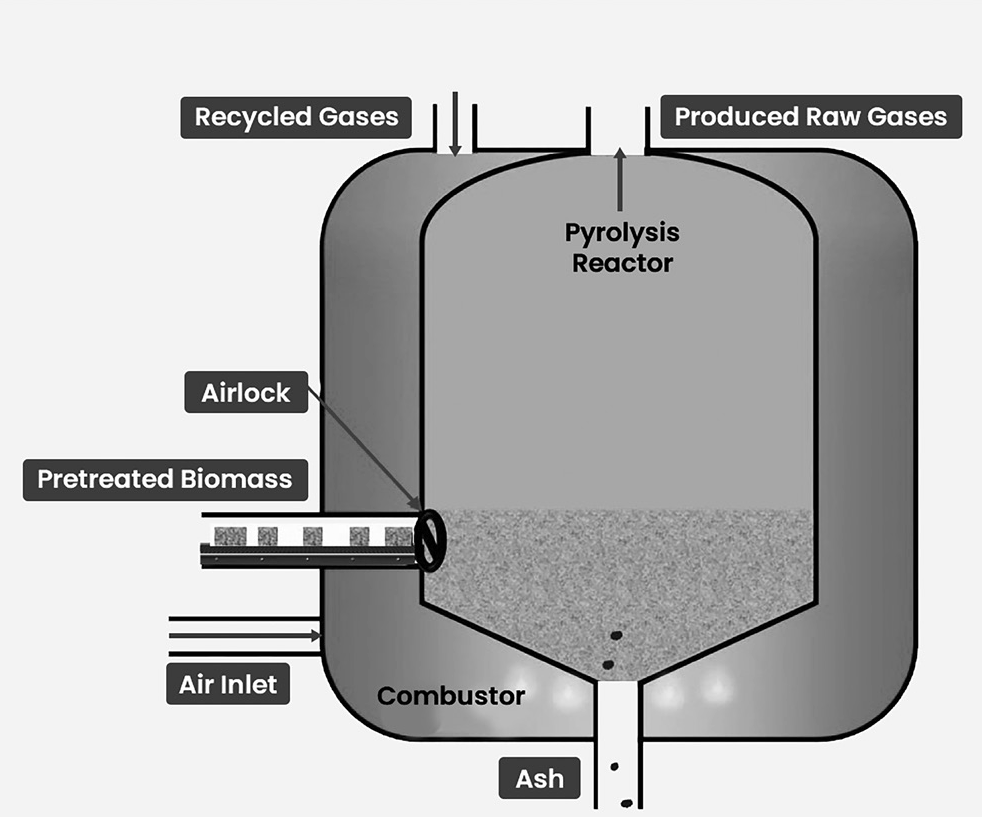
Pyrolysis Process: Pyrolysis is a method where synthetic materials are broken down at high temperatures (around 300-400 C) without oxygen. It’s seen as safer than burning because it doesn’t produce flames.
Residue: After pyrolysis, fine carbon particles, gases, and oil are left behind. If not managed properly, these residues can be harmful to health.
Health Risks: Some pyrolysis units, especially those used for processing materials like tires, may not have proper pollution control measures. This can lead to toxic emissions that are harmful to both people and the environment.
Regulation: Due to concerns about toxic emissions, authorities like the National Green Tribunal have prohibited the burning of used tires in the open or using them as fuel in brick kilns.
Applications of Pyrolysis
Pyrolysis is used to turn wood into useful chemicals like methanol, activated carbon, and charcoal.
Waste from pyrolysis, including soil, stone, ceramics, and glass, can be repurposed for building materials.
Pyrolysis can also be used for cooking methods like grilling, frying, and baking.
Recently, pyrolysis has been suggested as a way to convert used COVID-19 personal protective equipment (PPE) kits into biofuel, which can be used as a renewable energy source.
Advantages of Pyrolysis
Pyrolysis is simple and cheap, and it can handle many different types of materials.
It helps cut down on waste that would otherwise end up in landfills. This also reduces the amount of greenhouse gases released into the atmosphere.
Pyrolysis lowers the risk of water pollution compared to other waste disposal methods.
Fuel Adulteration
Taxes on diesel and gasoline are higher than those on kerosene, which is mainly used for cooking. Because of this tax difference, there’s widespread mixing of cheaper kerosene with gasoline and diesel in India.
Adulterating fuels like gasoline and diesel with kerosene leads to increased emissions of harmful pollutants like carbon monoxide (CO), nitrogen oxides (NOx), and particulate matter (PM).
Emissions from Agricultural Activities, Waste Treatment and Biomass Burning
Farming releases key pollutants like ammonia (NH3), methane (CH4), and nitrous oxide (N2O).
Landfills and wastewater treatment plants release
methane (CH ) as a major pollutant. Ammonia (NH )
43
Synthetic gas made through pyrolysis can be used in gas turbines to generate electricity.
.
Stubble Burning
Stubble burning is when farmers intentionally set fire to the leftover straw after harvesting crops like rice and wheat.
It makes both the soil and air toxic. The fire harms the soil’s microorganisms and organic quality.
Stubble burning happens all over India, but it’s a big problem for the National Capital Region (NCR).
In Punjab, Haryana, and Uttar Pradesh, stubble burning to prepare for the next crop season (Rabi Crop) creates heavy pollution in the NCR during winter.
Farmers only have a short time between harvesting one
crop and planting the next. This leads to quick rises in pollution levels, making the NCR’s air quality very poor.
Burning crop residue is illegal under IPC and the Air and Pollution Control Act of 1981, but despite bans by the National Green Tribunal, it still happens a lot in states like Rajasthan, Uttar Pradesh, Haryana, and Punjab.
Household Air Pollution (Indoor Air Pollution)
This happens when people burn different fuels like coal, wood, or animal dung for cooking or heating indoors, without good ventilation.
Burning these fuels releases harmful substances like fine particulate matter (PM2.5), black carbon, carbon dioxide, carbon monoxide, and methane into the air.
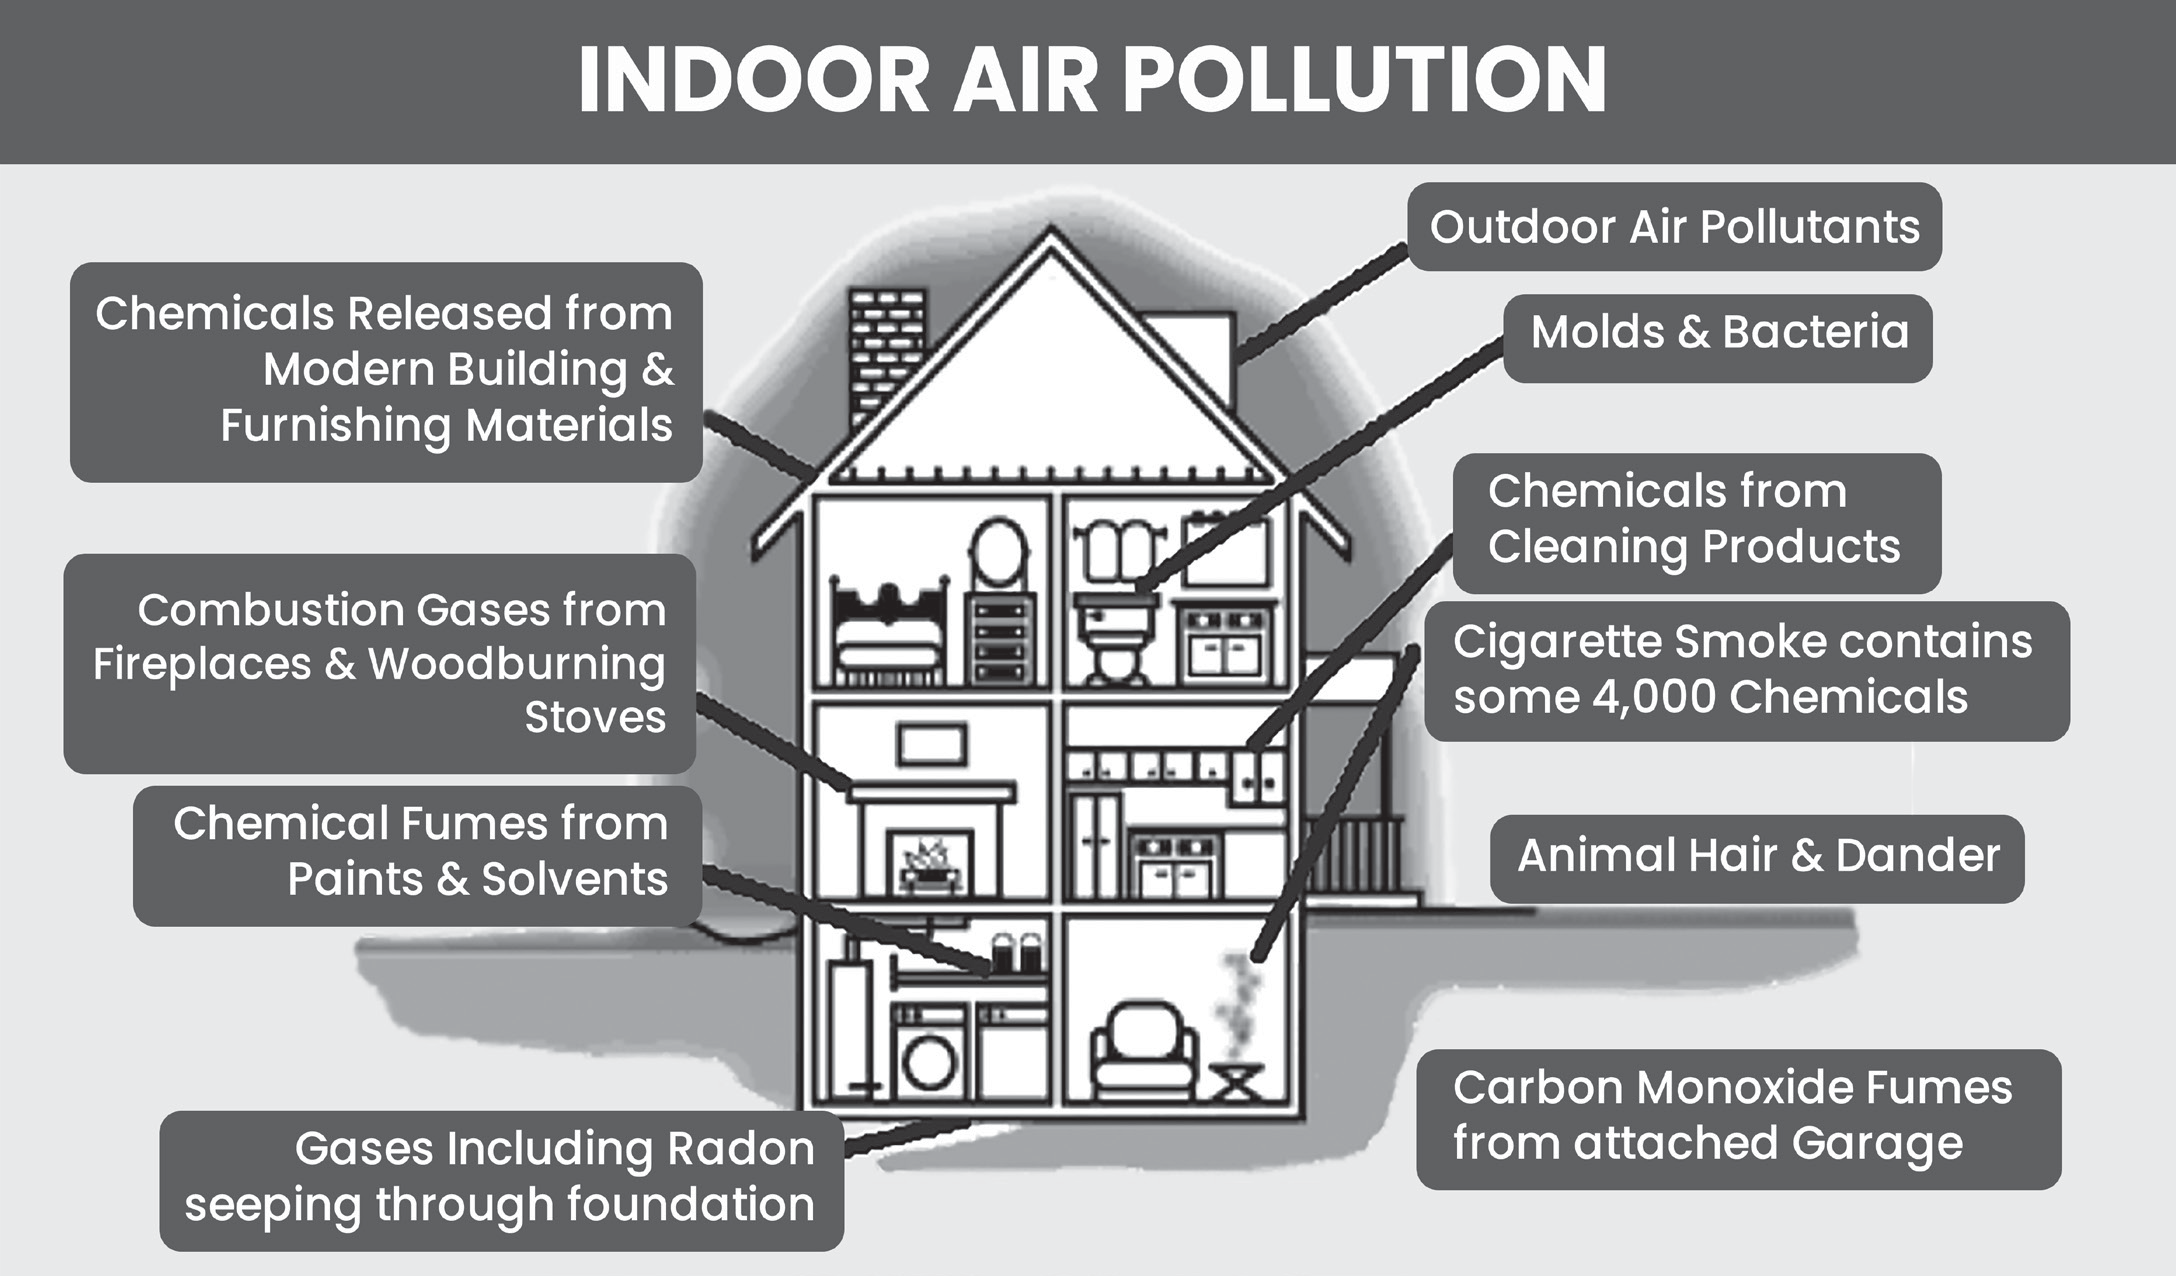
Also, materials like paints, carpets, and furniture in homes can release volatile organic compounds (VOCs), adding to indoor air pollution.
Prevention and Control of Indoor Air Pollution
Instead of using wood and dung cakes, it’s better to use cleaner fuels like biogas, LPG, or electricity for cooking and heating.
Using solar cookers is a good idea as they don’t produce any pollution.
Use trees like baval (Acacia nilotica) that produce less smoke when burned.
Charcoal is cleaner compared to some other fuels, so it’s a better option.
Properly covering kitchen waste can reduce indoor pollution caused by its decay.
Waste Segregation: Separating different types of waste, treating it at the source, and keeping rooms clean will also help in reducing indoor pollution.
Volcanism – Acid Rain, Ozone Destruction
Volcanic Gases: Volcanoes release gases like Sulphur dioxide, carbon dioxide, and hydrogen fluoride, which can be harmful to living things and the environment.
Local Effects: Sulphur dioxide from volcanoes can cause acid rain and air pollution in nearby areas.
Global Impact: During big volcanic eruptions, large
amounts of sulphur particles can reach the stratosphere, affecting the Earth’s climate. This can lead to cooler temperatures on the Earth’s surface and contribute to the depletion of the ozone layer.
Major Air Pollutants Particulate Pollutants
Major Air Pollutants Particulate Pollutants
Particulate pollutants are tiny bits of matter suspended in the air, like dust and soot.
They mainly come from industries, vehicles, power plants, construction sites, and other activities that create pollution.
Sizes: These particles can be very small, ranging from 0.001 to 500 micrometers (µm) in diameter.
Particles under 10 µm float in the air and can be easily carried by wind.
Particles over 10 µm fall to the ground.
Particles under 0.02 µm stay in the air for a long time, forming persistent aerosols.
Particulate matter of sizes PM10 and PM2.5 are considered harmful because they can cause health problems when inhaled. PM2.5, which are particles 2.5 µm or less in diameter, are particularly damaging to health.
Breathing in these fine particles can lead to respiratory issues like coughing, irritation, and inflammation. It can even cause lung diseases like pneumoconiosis, which involves inflammation and scarring of lung tissue from inhaling dust.
Particulate Matter Less than 2.5 μm
We have limited understanding of particles smaller than 2.5 micrometers (µm).
In the air, particles of arsenic and nickel, mostly less than 2 µm in size, are present. Nickel, especially, comes from burning fossil fuels in vehicles and power plants, and it’s known to cause cancer.
There’s growing worry about particles even smaller than PM2.5, called PM1. PM1 is incredibly tiny, 70 times finer than human hair, and it can penetrate deep into our lungs and even through the skin.
PM1 contains more harmful toxins, including metals, which can cause lung damage, genetic harm, and cancer.
Vehicular and industrial emissions are the main sources of PM1.
Because PM1 isn’t monitored as widely, there’s not much data on its health effects. Even organisations like the World Health Organisation (WHO) haven’t set specific standards for these ultra-fine particles.
A significant portion, about 40%, of particulate matter is even smaller than PM1, with particles as tiny as PM0.7, but they’re not officially monitored.
Fly Ash
Fly ash is produced mainly by thermal power plants when they burn coal.
It contains compounds like silicon dioxide (SiO2), aluminium oxide (Al2O3), and calcium oxide (CaO). It’s also rich in other substances like silica, alumina, iron oxide, calcium oxide, magnesium oxide, and toxic heavy metals such as lead, arsenic, cobalt, and copper.
These tiny poisonous particles can get trapped in the respiratory system, causing gradual poisoning.
Spills of fly ash due to breaches in containment dykes are common in India, polluting both air and water. They can also contaminate water bodies with heavy metals like nickel, cadmium, arsenic, chromium, and lead.
Fly ash contains much more radiation than even nuclear waste stored in water.
It harms the environment by damaging mangroves and polluting groundwater. For example, in the Rann of Kutch, ash sludge from nearby coal power plants has polluted groundwater.
Fly ash settling on leaves can reduce crop yields and harm vegetation.
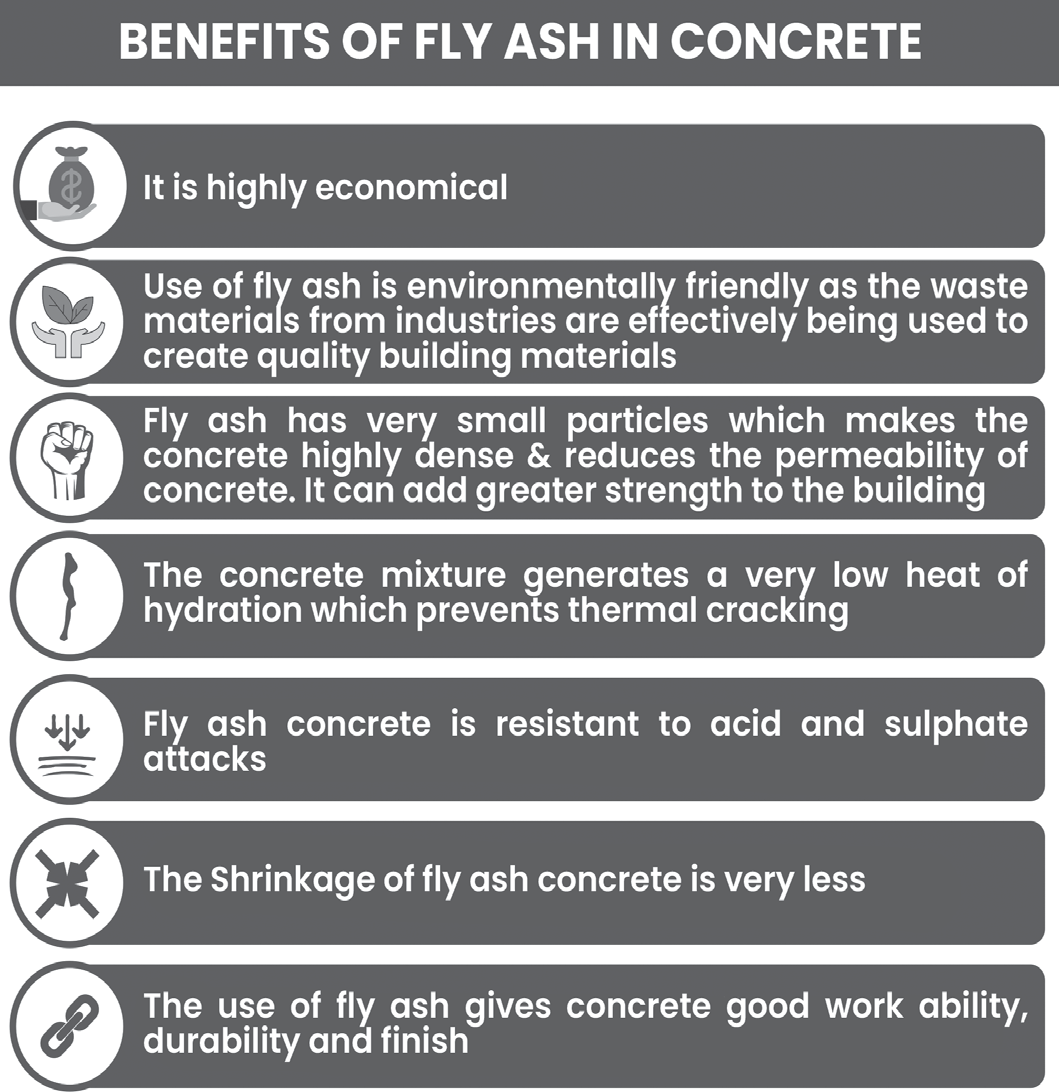
Policy Measures of MoEF
The Ministry of Environment, Forest and Climate Change has made it compulsory to use products made from fly ash in certain construction projects.
These fly ash-based products must be used in construction projects, road embankment works, and low-lying landfilling works within 100 kilometers of a Thermal Power Station.
For mine filling activities, they must be used within 50 kilometers of a Thermal Power Station.
Lead
Lead is found in petrol, diesel, lead batteries, paints, and hair dye products.
Tetraethyl lead (TEL) is added to petrol as an anti-knock agent to make vehicles run smoothly.
Inhaling lead particles from vehicle exhaust can harm the kidneys, liver, and interfere with red blood cell development. It can also damage the nervous system, cause digestive issues, and sometimes lead to cancer.
Long-term exposure to lead can lower intelligence in children.
Lead poisoning can occur when lead mixes with water or food, leading to harmful effects over time.
Nanoparticles (NPs)
Nanotechnology is valuable globally, with uses in electronics and medicine, like delivering drugs to specific areas.
Man-made nanoparticles are released into the environment during industrial and mechanical processes, either intentionally or accidentally.
Nanoparticles are incredibly tiny, about 1/109 of a meter. To put it in perspective, it’s like dividing a meter into 100 crore parts.
Natural processes like forest fires, volcanic eruptions, weathering, and desert dust storms also release nanoparticles into the atmosphere.
Natural nanoparticles vary in size and can travel long distances through the air, staying suspended for days.
Effects of Nanoparticles on the environment
Nanoparticles (NPs) released into the environment gather in different places like air, water, soil, and sediment, including wastewater sludge.
NPs can affect various environmental processes, such as dust cloud formation, the concentration of hydroxyl radicals (important in air purification), depletion of ozone (which protects us from harmful UV radiation), and changes in stratospheric temperature.
NPs in the environment can stick together and form dust clouds. These clouds can reduce the intensity of sunlight.
Asian Brown Clouds Impact on Himalayan Glaciers
Asian Brown Clouds: These clouds carry a lot of soot and black carbon nanoparticles.
When these clouds deposit the particles on the glaciers, it can make them darker. This means they absorb more heat from the sun instead of reflecting it back (reduced albedo), which could cause the glaciers to melt faster.
NPs and Ozone Depletion
Nanoparticles (NPs) can create reactive oxygen species (ROS), including free radicals like Cl-. These radicals can destroy ozone in the atmosphere.
Effect on Stratospheric Temperature
NPs in the lower atmosphere interact with molecular hydrogen released from sources like hydrogen fuel cells. Together, they move up to the stratosphere, increasing water vapour there.
This leads to the formation of stratospheric clouds, mostly made of ice crystals, which contribute to stratospheric cooling. These clouds also play a role in ozone destruction.
Black Carbon (Soot) and Himalayan Glaciers
Black carbon is like tiny particles of soot or dust in the air that come from things like burning fuel.
When black carbon lands on snow, it makes it darker, so it absorbs more heat from the sun instead of reflecting it back (reducing albedo). Also, it directly absorbs sunlight and heats up the air around it.
Black carbon makes snow and ice darker, causing them to melt faster. This can lead to glaciers shrinking more quickly.
In some areas, black carbon can change how cloudy it is and even affect things like rainfall patterns.
It’s the second-biggest cause of climate change after CO2, but unlike CO2, it doesn’t stick around for long in the atmosphere.
India and China produce the most black carbon, mostly from burning things like wood, coal, and other fuels.
In India’s Indo-Gangetic plain, black carbon mostly comes from burning biofuels, fossil fuels, and things like crop residue.
It’s usually highest in May, when it’s dry, and lowest in August, during the rainy season.
Glaciers are far from most sources of pollution, so studying pollution there helps us understand how much pollution is in the air and where it comes from.
Brown Carbon
Brown carbon refers to greenhouse gases and particles produced when materials are burned in a not-so-clean way, like when there’s a lot of smoke or dust.
One big source of brown carbon is when plants or other organic materials are burned, like in wildfires or when people use wood for cooking or heating.
Carbon Monoxide (CO)
Carbon monoxide (CO) is a dangerous gas that you can’t see, smell, or taste. It’s lighter than air and doesn’t stick around in the atmosphere for long (short-lived).
When materials/substances burn without enough oxygen, they produce carbon monoxide instead of carbon dioxide (CO2).
If there’s enough oxygen, carbon monoxide burns with a blue flame and turns into carbon dioxide.
Most carbon monoxide in the world is natural and forms when certain chemicals react in the lower part of the atmosphere.
Volcanoes, forest fires, and other types of burning also release carbon monoxide into the air.
Cars, trucks, and other engines that burn fuel, as well as industrial processes like iron smelting, also produce carbon monoxide.
Health Effects
Carbon monoxide poisoning is dangerous. It’s the most common cause of deadly air poisoning. Poor ventilation and heat issues in electronics, like laptops, can release carbon monoxide.
It’s harmful to animals and humans. When the amount of carbon monoxide in the air is higher than about 35 parts per million (ppm), it’s toxic to the hemoglobin in our blood, which carries oxygen.
Carbon monoxide binds with hemoglobin, forming carboxyhemoglobin. This takes up space in the blood that should carry oxygen, which can lead to oxygen deprivation.
Environmental Effects
It’s not a greenhouse gas directly. Carbon monoxide doesn’t directly contribute to trapping heat in the atmosphere like greenhouse gases do. However, in the air, carbon monoxide plays a part in forming ground-level ozone, which can be harmful. It can also increase the levels of methane, another potent greenhouse gas.
Carbon Dioxide (CO2)
Carbon dioxide (CO2) is a gas that you can’t see or smell (Colourless and Odourless). It’s heavier than air.
It’s released naturally from things like volcanoes, hot springs, and geysers. It can also come from certain rocks dissolving in water or acids.
Carbon dioxide dissolves in water, so it’s found in groundwater, rivers, lakes, ice caps, glaciers, and seawater.
Effects on Health
Carbon dioxide (CO2) can be dangerous in high concentrations because it can displace oxygen in the air, leading to a condition known as asphyxia. Even when there’s enough oxygen present, if CO2 levels reach around 7%, it can still cause suffocation. Symptoms of CO2 poisoning include dizziness, headaches, and loss of consciousness.
Effects on Environment
CO2 is identified as a crucial greenhouse gas, meaning it contributes to the greenhouse effect, which traps heat in the Earth’s atmosphere. This trapping of heat is essential for maintaining Earth’s temperature within a range suitable for life.
The burning of carbon-based fuels, such as coal, oil, and natural gas, especially since the onset of the industrial revolution, has led to an increase in CO2 levels in the atmosphere. This increase in CO2 levels is a major driver of global warming.
When CO2 is absorbed by seawater, it reacts with water to form carbonic acid. This process is known as ocean acidification. Increasing levels of CO2 in the atmosphere lead to higher concentrations of carbonic acid in the oceans, which can harm marine life and disrupt marine ecosystems.
Ozone (O3)
Ozone (O3) is a gas that makes up a tiny fraction of our atmosphere, less than 0.00005%. It’s not evenly spread out.
There are two types of ozone: good and bad.
Good ozone forms naturally high up in the atmosphere where it shields us from harmful UV rays.
Bad ozone forms closer to the ground and is a pollutant, especially when it’s hot and sunny.
It’s not directly emitted into the air; some comes from higher up, and some forms when certain pollutants (Carbon Monoxide, Nitrogen dioxide and volatile organic compounds) interact with sunlight.
Bad ozone can be a problem in both urban and rural areas, especially on hot days, and it can travel long distances with the wind.
Reactions Involved in the Formation of Ground Level Ozone
Carbon monoxide (CO) combines with a hydroxyl radical (OH-) to create a hydroperoxy radical (HO2).
Volatile organic compounds (VOCs) interact with a hydroxyl radical (OH-) to form a peroxy radical (RO2).
The hydroperoxy radical (HO2) or peroxy radical (RO2) reacts with nitrogen oxide (NO) to produce nitrogen dioxide (NO2) and either a hydroxyl radical (OH) or an alkoxy radical (RO).
Nitrogen dioxide (NO2) undergoes photolysis, meaning it’s broken down by sunlight, resulting in the production of ozone (O3).
Harmful Effects of Ozone
Ground-level ozone is a dangerous air pollutant and a key component of smog.
It irritates our eyes, making them itchy and watery, and weakens our ability to fight off colds and pneumonia.
People with asthma are particularly vulnerable to the effects of breathing in ozone.
High levels of ozone can also harm plants and ecosystems, especially forests, particularly during the growing season.
Stratospheric Ozone Depleting Substances
These are human-made gases that harm the ozone layer in the stratosphere (the good ozone).
They include:
Chlorofluorocarbons (CFCs)
Hydrochlorofluorocarbons (HCFCs)
Hydrobromofluorocarbons (HBFCs)
Halons (used in fire extinguishers)
Methyl bromide (used to fumigate and kill pests)
Carbontetrachloride (p reviously usedin fi re extinguishers, refrigerants, and as a cleaning agent)
Methyl chloroform (used as a solvent for cleaning metals and circuit boards).
Ozone depleting substances have been used as:
Refrigerants: They’ve been used in air conditioners, refrigerators for homes, vehicles, and commercial purposes.
Foam Blowing Agents: Used to create foam in various products.
Component in Electrical Equipment: Some were used in electrical equipment manufacturing.
Industrial Solvents: Used in various industrial processes.
Cleaning Solvents: Utilised for cleaning purposes, including dry cleaning.
Aerosol Spray Propellants: Used to propel substances in aerosol sprays.
Fumigants: Used to fumigate and control pests.
Chlorofluorocarbons (CFCs)
Chlorofluorocarbons (CFCs) were commonly used in aerosol sprays, refrigerators, and air conditioners.
They’re also classified as greenhouse gases, contributing to climate change.
Due to their harmful effects on the ozone layer, regulations on CFCs began in the late 1970s.
Older industrial cooling systems still contain CFCs.
The Montreal Protocol is an international agreement aimed at safeguarding the ozone layer by gradually
stopping the production of various ozone-depleting substances, including CFCs.
Hydrochlorofluorocarbons
Hydrochlorofluorocarbons (HCFCs) were introduced as alternatives to CFCs.
Compared to CFCs, HCFCs cause less harm to the ozone layer.
Halons
Halons are gases made of carbon and halogen atoms (like fluorine, chlorine, bromine, or iodine).
They were first created for use in fire extinguishers.
However, their production and use stopped in developed countries by 1994.
Nitrogen Oxides (Oxides of Nitrogen) (NOx)
NOx refers to various nitrogen oxides produced during combustion, mainly in engines and coal-burning power plants.
They’re also naturally produced by lightning.
When oxygen and nitrogen combine at high temperatures, such as inside engines or power plants, they create NOx.
Agricultural practices, like fertilisation and the use of nitrogen-fixing plants, also add to atmospheric NOx.
NO and NO2 contribute to cooling the Earth’s climate and shouldn’t be confused with nitrous oxide (N2O), a greenhouse gas.
NOx can worsen asthma and cause respiratory issues.
Biodiesel production faces challenges in reducing NOx emissions.
NOx, along with volatile organic compounds (VOCs), form smog and contribute to acid rain and tropospheric ozone formation.
NOx can eventually turn into nitric acid, a part of acid rain.
NO and NO2 can lead to global cooling by destroying methane molecules, countering the effects of greenhouse gases.
Sulphur Dioxide (SO2)
It’s a smelly and toxic gas that causes acid rain.
Volcanoes release it, and it’s found in Venus’s atmosphere
It comes from burning coal, diesel, some industrial activities like making paper and smelting metals, and reactions with hydrogen sulphide and oxygen.
Use: Mainly made for making sulphuric acid.
Breathing it can lead to strokes, heart disease, lung cancer, and nerve damage.
Recent Report: Greenpeace India and the Centre for Research on Energy and Clean Air (CREA) released a report ranking SO2 hotspots.
India’s Position: India has been the top emitter of SO2 for five years in a row.
China’s reduction in emissions made Russia the second- largest emitter after India.
India emitted 21% of global human-made SO2 emissions in 2019.
Main Source: Coal power plants are the biggest contributors.
Recent Change: India’s SO2 emissions decreased by about 6% in 2019 compared to 2018, the largest drop in four years.
SO2 Emission Hotspots in India
India has over 15% of the world’s SO2 hotspots, as detected by the OMI (Ozone Monitoring Instrument) satellite.
Main Sources: The biggest sources of SO2 emissions in India are thermal power stations, especially clusters of them.
Major Hotspots: These include places like Singrauli in Madhya Pradesh, Neyveli and Chennai in Tamil Nadu, Talcher and Jharsuguda in Odisha, Korba in Chhattisgarh, Kutch in Gujarat, Ramagundam in Telangana, and Chandrapur and Koradi in Maharashtra.
Among big cities, Chennai stands out as a significant hotspot for SO2 emissions.
Volatile Organic Compounds (VOCs)
Volatile Organic Compounds (VOCs): These are carbon- based chemicals that easily turn into gases at room temperature.
Example: Formaldehyde is one VOC that evapourates from paint, and it boils at -19 C.
VOCs like formaldehyde can irritate the eyes and nose and cause allergies.
Common indoor sources include perfumes, hair sprays, furniture polish, glues, air fresheners, moth repellents, and wood preservatives.
Immediate Effects: Breathing in VOCs can cause irritation of the eyes, nose, and throat, headaches, nausea, and loss of coordination.
Long-term Effects: There’s concern that long-term exposure to VOCs could harm the liver and other parts of the body.
Benzene
It’s a natural part of crude oil and a basic chemical used in making many products.
It’s added to gasoline because it boosts its octane rating, which improves engine performance.
Benzene is also used to make plastics, resins, synthetic fibers, rubber, and lubricants.
Benzene is a type of VOC, and when it mixes with other pollutants in the air, it forms ground-level ozone, which can harm crops and materials, especially when it creates smog.
Health Risks: Breathing in benzene increases the risk of cancer and can lead to bone marrow problems.
Benzene Pollutants
Toluene (methylbenzene): Found in paint thinners and added to gasoline to improve its octane rating.
Xylene (dimethylbenzene): Used as a solvent in printing, rubber, and leather industries.
Styrene (ethenylbenzene / phenylethylene / vinylbenzene): Used to make polystyrene, which is used in various appliances.
Styrene Gas
Styrene Gas Leak: In May 2020, there was a leak of styrene gas from an LG Polymers chemical factory in Visakhapatnam, which resulted in several deaths.
Styrene: It’s a type of organic compound derived from benzene. It’s usually stored in liquid form but easily evapourates, making it a volatile organic compound.
Uses of Styrene:
It’s primarily used as the main ingredient to make polystyrene.
Polystyrene is a versatile plastic used to create parts for various appliances like refrigerators, microwaves, automotive components, computers, and disposable items.
Effects:
Short-term Effects:
Styrene gas exposure affects the central nervous system.
It can cause breathlessness, eye irritation, indigestion, nausea, and even loss of consciousness.
The mucous membrane, like the lining of the nose and throat, is primarily affected, and exposure can be fatal.
Long-term Effects:
Long-term exposure to styrene gas may increase the risk of developing leukemia and headaches.
Ammonia (NH3)
It’s a corrosive, colourless gas with a strong, pungent odour.
Ammonia is released naturally from decaying organic matter and human and animal waste.
Most of the human-caused ammonia emissions come from livestock management and agricultural fertilisers.
Ammonia is toxic and can irritate the eyes, nose, and throat even in small amounts.
Atmospheric Reaction: In the air, it reacts with sulphates and nitrates to form ammonium salts, which contribute to secondary fine particulate matter (PM2.5).
Water Solubility: Ammonia dissolves easily in water and can lead to the nitrification and eutrophication of aquatic ecosystems.
Ethylene
It’s widely used in the chemical industry, with much of it going into making polyethylene, a common plastic.
Natural Plant Hormone: Ethylene is also a natural plant hormone, used in agriculture to ripen fruits.
Health Effects: Exposure to excessive amounts of ethylene can cause headaches, drowsiness, dizziness, and even unconsciousness, but it’s generally not highly toxic to humans.
Carcinogenicity: Ethylene itself is not a carcinogen, but its derivative, ethylene oxide, is known to cause cancer.
Asbestos
It’s a group of six naturally occurring minerals that form fibrous crystals. These minerals are chrysotile, crocidolite, amosite, anthophyllite, tremolite, and actinolite.
Health Risks: Prolonged exposure to asbestos fibers, usually through inhalation, can lead to severe and often fatal illnesses. These include lung cancer, mesothelioma (a rare cancer affecting the lining of the lungs and abdomen), and asbestosis (a type of lung disease characterised by scarring and inflammation).
Metallic Oxides
These are compounds formed when metals combine with oxygen. Examples include iron oxide, aluminum oxide, manganese oxide, magnesium oxide, zinc oxide, and others.
Impact on Plants: During mining and metallurgical processes, dust containing metallic oxides can settle on plants, causing various issues.
Effects: This deposition can lead to physiological, biochemical, and developmental problems in plants. It can also contribute to reproductive failure in plants, affecting their ability to produce seeds or fruit.
Biological Pollutants
These are substances originating from living organisms that can negatively affect human health when present in the environment.
Examples: They include pollen from plants, dust mites, pet dander (hair and skin), fungal spores, parasites, and certain bacteria.
Health Effects: Many of these biological pollutants act as allergens, triggering allergic reactions in susceptible individuals. Common health issues associated with exposure include asthma, hay fever, and other allergic diseases.
Radon
It’s a naturally occurring gas that comes from the soil.
Issue with Modern Houses: Because newer homes are often built with tighter seals for energy efficiency, radon can become trapped indoors.
Health Risk: Radon exposure indoors can increase the risk of lung cancer
Prevention and Control of Air Pollution and Industrial Pollution
Prevention and Control of Air Pollution Control of Industrial Pollution
Industrial pollution can be significantly reduced through various methods:
Cleaner Fuels: Switching to cleaner fuels like liquefied natural gas (LNG) in power plants and fertiliser plants can help reduce pollution. LNG is not only environmentally friendly but also cost-effective.
Environmentally Friendly Processes: Implementing industrial processes that are environmentally friendly can minimise the emission of pollutants and hazardous waste.
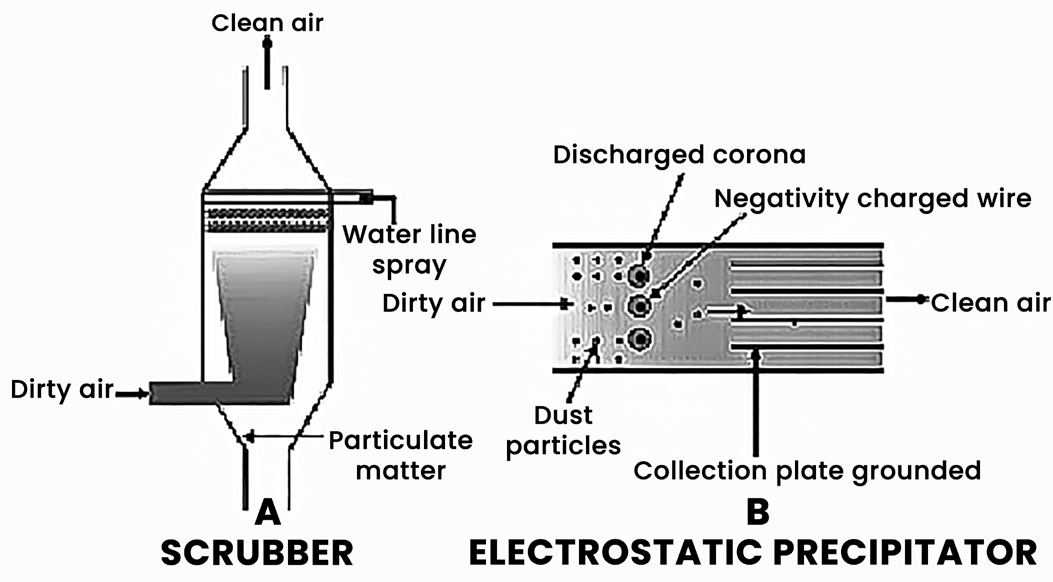
Installing devices that reduce the release of pollutants is crucial. These devices include: Filters, Electrostatic Precipitators, Inertial Collectors, Scrubbers, Gravel Bed Filters or Dry Scrubbers.
Filters
Filters are used to remove solid particles, known as particulate matter, from gas streams.
Baghouse Filtration System: This is the most common type of filtration system. It consists of bags made of materials like cotton or synthetic fibers for lower temperatures and glass cloth fabrics for higher temperatures, up to 2900 C. These bags capture particles as the gas passes through them, effectively cleaning the gas stream.
Electrostatic Precipitators (ESP)
ESPs are devices used to remove solid particles, or particulate matter, from exhaust gases.
Efficiency: They can remove over 99% of the particulate matter present in the exhaust.
Working Principle:
Electrode wires inside the ESP are charged with several thousand volts, creating a corona that releases electrons.
These electrons attach to dust particles, giving them a negative charge.
The collecting plates, which are grounded (have a relatively positive charge), attract the charged dust particles.
The airflow between the plates must be slow enough to allow the dust to settle.
The collected particles are removed from the plates by shaking or rapping the surface.
Applications: ESPs are commonly used in boilers, furnaces, thermal power plants, cement factories, steel plants, and other industrial settings to clean exhaust gases.
Inertial Collectors
These devices work based on the principle of inertia. They use the difference in inertia between suspended particulate matter (SPM) in the gas and its solvent to collect particles.
Working Principle:
Inertia is a function of the mass of the particulate matter. Heavier particles have higher inertia.
The device uses centrifugation, a technique that exploits this principle, to separate particles based on their inertia.
Cyclone: A common type of inertial collector used in gas cleaning plants is called a cyclone. It uses centrifugal force to separate heavier particles from the gas stream, making it an efficient way to remove particulate matter.
Scrubbers
These are devices used to remove aerosols (small liquid or solid particles suspended in a gas) from a gas stream.
Working Principle:
Scrubbers are wet collectors, meaning they use a liquid to trap particles from the gas stream.
There are two main methods:
Surface Collection: Wet particles in the gas stream are collected on a surface, then removed.
Wetting: Particles in the gas stream are wetted by a scrubbing liquid, causing them to be trapped.
The particles are trapped as they move from the gas phase to the liquid phase, similar to how mucus in the trachea traps dust particles.
Application: Scrubbers can effectively remove gases like sulphur dioxide from industrial emissions.
Catalytic Converter
This device, typically containing expensive metals like platinum, palladium, and rhodium, is installed in automobiles to reduce the emission of harmful gases.
Function:
Unburnt hydrocarbons are converted into carbon dioxide and water.
Carbon monoxide and nitric oxide are converted into carbon dioxide and nitrogen gas, respectively.
Requirement: Vehicles with catalytic converters should use unleaded petrol because lead in petrol deactivates the catalyst.
Other Control Measures:
Increased Chimney Height: This helps disperse pollutants higher into the atmosphere, reducing ground- level concentrations.
Closure of Polluting Industries: Shutting down industries that heavily pollute the environment can reduce overall pollution levels.
Relocation of Industries: Moving polluting industries away from cities and densely populated areas can mitigate pollution exposure.
Green Belt Development: Establishing and maintaining a wide green belt around urban areas helps absorb pollutants and improve air quality
Measures Taken to Control Air Pollution
Measures Taken to Control Air Pollution
• The National Green Tribunal (NGT) has instructed the Central Pollution Control Board (CPCB) to shut down industries categorised as “critically polluted” and “severely polluted” within three months.
• Industries classified as ‘red’ and ‘orange’ category units will not be permitted to carry out further industrial activities until they comply with prescribed pollution parameters.
• The CPCB has been tasked with evaluating the amount of compensation that polluting units must pay for the last five years.
• Industries classified as ‘white’ and ‘green’ or non- polluting will not be impacted by this directive.
• Industrial clusters were identified as Polluted Industrial Areas (PIAs) based on a joint study conducted by the CPCB and State Pollution Control Boards (SPCB) in 2009-10.
• These areas were categorised as ‘critically polluted’ (CPA - red category), ‘severely polluted’ (SPA - orange category), and ‘other polluted areas’ (OPAs - green category).
Pollution Index
The Ministry of Environment, Forest and Climate Change (MoEFCC) has developed a Pollution Index to categorise industrial sectors based on their pollution levels. This index considers emissions (air pollutants), effluents (water pollutants), hazardous wastes generated, and resource consumption.
Categories based on Pollution Index:
• Red Category: Industries with a Pollution Index score of 60 and above (60 industries).
• Orange Category: Industries with a Pollution Index score of 41 to 59 (83 industries).
• Green Category: Industries with a Pollution Index score of 21 to 40 (63 industries).
• White Category: Industries with a Pollution Index score up to 20 (36 industries).
• Newly introduced White category sectors are considered practically non-polluting.
Regulatory Requirements:
White Category Industries: They do not require Environmental Clearance (EC) or Consent to Operate. They only need to inform the State Pollution Control Board (SPCB) and Central Pollution Control Board (CPCB).
Red Category Industries: Generally, they are not allowed in ecologically fragile or protected areas.
Measures Taken to Control Vehicular Pollution in India
• India has set standards for vehicle emissions, which, if followed, reduce pollution.
• Catalytic converters in vehicles have durability standards to ensure they effectively reduce emissions.
• Pollution Under Control (PUC) Certificate: Vehicles in cities like Delhi need to obtain a PUC certificate regularly to ensure emissions are within legal limits.
• Sulphur content in diesel has been reduced to 0.05% to reduce sulphur dioxide emissions.
• Ban on Lead in Petrol: Lead additives in petrol have been banned to prevent lead emissions.
• Public transport vehicles in cities like Delhi are required to use alternative fuels like CNG.
•
Phasing Out Old Vehicles: Old vehicles are being phased out to reduce pollution.
• Use of Low-Sulphur Fuels: Both petrol and diesel with low sulphur content are being used to reduce emissions.
• Stringent Pollution Norms: Strict pollution norms for vehicles, including the use of catalytic converters, are enforced.
• Improvement in Fuel Quality: Fuels are being improved by reducing sulphur and aromatics content.
• Future Goals: The aim is to further reduce sulphur and aromatic hydrocarbons in fuels to 50 ppm and 35% respectively.
BS VI from 2020
• Since April 2017, Bharat Stage IV (BS IV) emission norms have been applicable across India.
• In October 2018, the Supreme Court ordered a ban on the sale of vehicles compliant with Bharat Stage IV norms starting from April 1, 2020.
• The central government set April 1, 2020, as the deadline for manufacturers to adopt Bharat Stage VI (BS VI) emission norms.
Continued Use of Existing Vehicles:
• Despite the deadline, existing vehicles compliant with earlier emission norms like BS III and BS IV will be allowed to continue running even after April 1, 2020.
Bharat Stage (Bs) Norms
• The Government of India (GOI) instituted Bharat Stage (BS) norms in 2000 to regulate air pollutant emissions from motor vehicles.
• These norms aim to limit the release of harmful air pollutants such as nitrogen oxides, carbon monoxide, hydrocarbons, particulate matter (PM), and sulphur oxides from vehicles with internal combustion engines.
• The norms require the use of appropriate fuel and technology to control emissions.
• With each stage, the control of emissions becomes stricter, leading to reduced pollution from vehicles.
• BS IV and BS VI norms are aligned with similar standards in Europe known as Euro 4 and Euro 6, respectively.
• Originally, BS V was planned for 2021 and BS VI for 2024. However, India leapfrogged directly to BS VI norms by 2020, skipping BS V, to meet carbon footprint obligations more effectively.
Differences Between BS IV and BS VI
The main difference between Bharat Stage IV (BS IV) and Bharat Stage VI (BS VI) norms is the level of sulphur in the fuel.
• BS IV: BS IV grade fuels contain 50 parts per million (ppm) of sulphur.
• BS VI: BS VI grade fuel has significantly lower sulphur content, with only 10 ppm of sulphur (10 mg/kg).
Advantages of BS VI Vehicles and Fuel
• BS VI vehicles reduce particulate matter emissions from diesel cars by 80%.
• Nitrogen oxides emissions are reduced by 70% in diesel cars and by 25% in petrol cars under BS VI standards.
• The reduction in sulphur content in BS VI fuel allows for better catalytic converters in vehicles.
• BS VI mandates the use of OBD devices in all vehicles, providing information to owners or technicians about the efficiency of vehicle systems.
• Real Driving Emission (RDE): Introduction of RDE measures emissions under real-world driving conditions, not just during tests.
•
Change in Particulate Matter Measurement: BS VI norms measure particulate matter by number standard rather than mass standard.
Impact
• Manufacturers had to invest more in technology to produce vehicles compliant with BS VI standards.
• Upgrading existing vehicles to meet BS VI standards added extra costs for manufacturers.
• BS VI-compliant vehicles became more expensive due to the higher technology and manufacturing costs involved.
• BS VI-compliant fuel also became more expensive, contributing to the overall increase in vehicle operating costs.
Electric Mobility
• Government’s Electric Mobility Goal: In 2017, the Government of India (GOI) announced its ambition for India to transition fully to electric vehicles (EVs) by 2030.
• However, this goal has not been fully committed to due to challenges such as inadequate infrastructure and concerns about financial risks for the automobile industry in transitioning to EVs.
• Despite initial uncertainty, the GOI is now aggressively promoting the shift away from fossil fuels towards electric vehicles.
• Initially, the government is concentrating on transitioning two- and three-wheelers to electric power.
• NITI Aayog, a policy think tank of the GOI, has suggested banning all internal combustion engine-powered two- wheelers by 2025 and three-wheelers by 2023 as part of this transition.
Phase-II of the Faster Adoption and Manufacturing of Electric (& Hybrid) Vehicles in India(FAME India) Scheme
• The Department of Heavy Industry has introduced Phase- II of the Faster Adoption and Manufacturing of Electric (and Hybrid) Vehicles in India (FAME India) Scheme to promote electric and hybrid vehicles in the country.
• The scheme emphasises the localisation of electric vehicle parts, which is crucial for the growth of the sector.
• The policy aims to create a market for one million electric two-wheelers (e-2Ws) and five lakh electric three- wheelers (e-3Ws) within the next three years.
• Electric Mobility Promotion Scheme 2024 (EMPS 2024) scheme is being introduced by Ministry of Heavy Industries, Government of India with the approval of Department of Expenditure, Ministry of Finance to further accelerate the adoption of EVs in the country.
• This is a fund limited scheme with a total outlay of Rs.
500 crore for the period of 4 months, w.e.f. 1st April 2024 till 31st July 2024, for faster adoption of electric two- wheeler (e-2W) and three-wheeler (e-3W) to provide further impetus to the green mobility and development of electric vehicle (EV) manufacturing eco-system in the country.
EV Charging Guidelines to Encourage EV Adoption
• The Minister of Power has approved changes to the Electric Vehicle (EV) Charging Guidelines and Specifications to encourage the adoption of electric vehicles.
• The plan is to implement the guidelines in phases. In the first phase, which spans 1-3 years, all major cities with a population of 4 million or more, along with the highways connecting these cities, will be covered. In the second phase, spanning 3-5 years, other significant cities like state capitals and union territory headquarters may be included.
• The Bureau of Energy Efficiency (BEE), a statutory body under the Ministry of Power, has been designated as the Central Nodal Agency responsible for overseeing the implementation of these guidelines.
Electric Vehicle Charging Guidelines and Specifications
• Guidelines specify that there should be at least one charging station available within a grid of 3 km x 3 km in cities, ensuring easy access for urban residents.
• On highways or major roads, there should be one charging station every 25 km on both sides, and fast charging stations should be available every 100 km.
• Private charging facilities at residences and offices will be managed by DISCOMs (Distribution Companies), ensuring that individuals and businesses have access to reliable charging infrastructure where they need it most.
• Public Charging Stations (PCS): Setting up public charging stations is not restricted to specific entities; it’s open to anyone interested. This aims to encourage widespread deployment of charging infrastructure and foster competition among providers.
• Public charging stations are given the freedom to install chargers based on market demand, allowing them to adapt to changing needs and preferences of electric vehicle owners.
Tax Incentives
• Tax incentives are being provided to encourage the adoption of electric vehicles:
• Purchasers of electric vehicles will receive an additional income tax exemption of up to 1.5 lakh, reducing their taxable income by this amount. This serves as an incentive
for individuals to choose electric vehicles over conventional ones.
• The Goods and Services Tax (GST) rate on electric vehicles will be lowered from 12% to 5%. This reduction in tax rate makes electric vehicles more affordable for consumers.
Scepticism Surrounding Adaptation of Electronic Mobility
• Transition to electric vehicles (EVs) might not bring clear long-term environmental benefits globally.
• India’s large automobile market makes setting up charging infrastructure much harder compared to Western countries.
• China has an advantage in EV adoption due to access to key materials and cheaper batteries, while India relies heavily on imports.
• Challenges for the automobile industry include declining sales due to various factors, rising insurance costs, expensive raw materials, and volatile fuel prices.
• The industry has already spent a lot on upgrading to BS- VI emission standards from BS-IV.
Will Electric Vehicles Reduce Carbon Emission?
• While electric vehicles can reduce pollution in cities, their impact on carbon emissions depends on the source of electricity generation. In India, where 55% of electricity comes from coal, the net reduction in carbon emissions may not be significant.
Coal Gasification
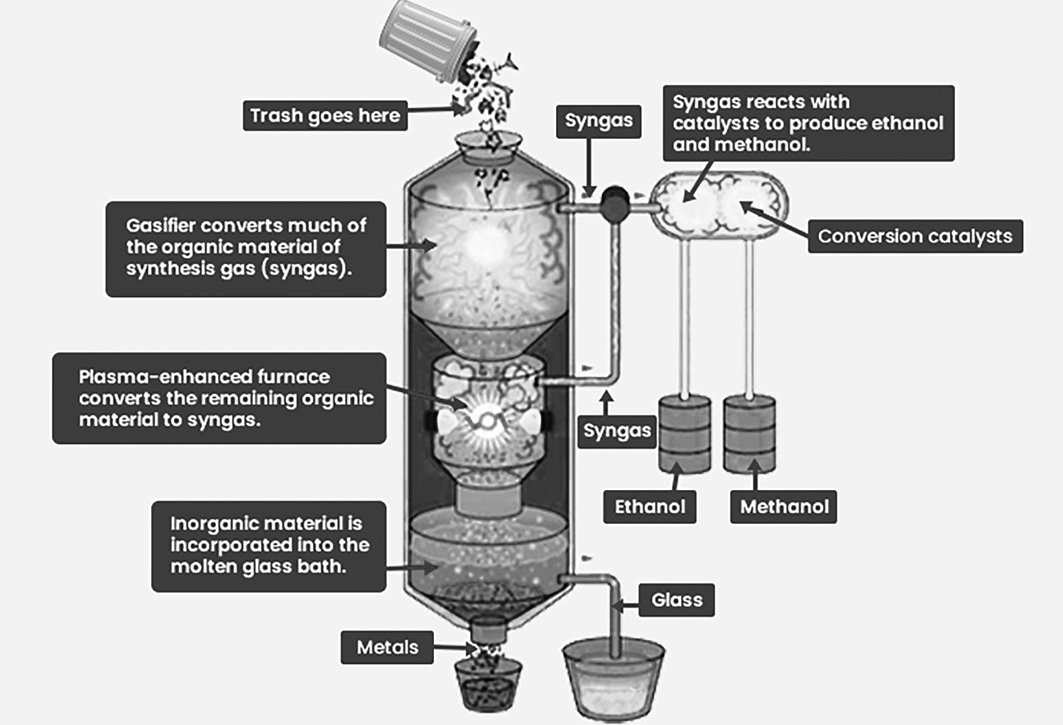
• Gasification is a thermochemical process that converts carbonaceous materials like coal into fuel gas called synthesis gas or syngas.
• This process occurs in a gasifier, where the material is reacted with oxygen and/or steam at high temperatures (>700 C) without combustion, resulting in the production of syngas along with ash or slag residues.
• Syngas contains carbon monoxide, hydrogen, and carbon dioxide and can be used as a fuel itself.
Syngas
• Syngas, short for synthesis gas, refers to a mixture of combustible gases typically composed of carbon monoxide and hydrogen.
• It is produced through the gasification of organic materials like biomass using steam or oxygen.
• Once cleaned up, syngas can be utilised to manufacture various organic molecules, including synthetic natural gas (methane) or liquid biofuels like synthetic diesel.
National Clean Air Program (NCAP)
• The National Clean Air Program (NCAP), initiated by the Government of India in 2019, aims to significantly reduce pollution levels, specifically targeting PM2.5 and PM10, by 20-30% in cities by the year 2024.
• It operates as a mid-term, five-year action plan, with the first year being 2019.
• Taking cues from successful models like Beijing’s, which achieved a 33.3% reduction in PM2.5 over five years, NCAP focuses on expanding the national air quality monitoring network, enhancing capacity for air pollution management, and raising public awareness about the hazards of air pollution.
Green Tax
• The proposed “green tax” for 15-year-old petrol and diesel vehicles operates on the principle of “polluters must pay.”
• This tax would be imposed when commercial vehicles seek fresh fitness certificates and private vehicles apply for registration renewal.
• State governments have the authority to impose this tax in addition to regular road taxes.
• Several states like Andhra Pradesh, Maharashtra, Karnataka, Telangana, Uttar Pradesh, and Jharkhand already have similar taxes in place.
• Exceptions to the tax may include transport vehicles like city buses and vehicles used for farming, such as tractors and combined harvesters.
• Additionally, vehicles running on cleaner fuels like CNG, LPG, ethanol, and strong hybrids would be exempt from this tax.
What is the Polluter Pays Principle?
• The “polluter pays” principle is a widely accepted concept that holds those responsible for pollution accountable for managing its consequences to prevent harm to human health or the environment.
•
For example, if a factory produces a harmful substance as a by-product, it’s expected to safely dispose of it. This principle is part of a broader framework for sustainable development outlined in the 1992 Rio Declaration.
• When the costs of pollution, such as greenhouse gas emissions, aren’t borne by the emitters, these expenses are passed on to society, resulting in what’s known as “market failure.”
• Society ends up shouldering these costs as greenhouse gases are released into the atmosphere, which is considered a global common shared by everyone.
NGT’s Criticism
• The National Green Tribunal (NGT) criticised the Ministry of Environment, Forest and Climate Change (MoEF) for its plan under the National Clean Air Programme (NCAP), which aims to reduce air pollution by 20-30% by 2024. The plan covers 102 non-attainment cities identified by the Central Pollution Control Board (CPCB) based on air quality data from 2011 to 2015. Non-attainment cities are those where pollution standards were not met for five consecutive years.
• NGT argued that the MoEF’s plan contradicted the constitutional mandate under Article 21, which recognises the right to clean air as part of the right to life. Failure to address air pollution was seen as a denial of this right. NGT emphasised the need to enforce the principles of sustainable development and the public trust doctrine, calling for stringent measures.
• Under the NCAP, the target was to achieve pollution norms within 10 years, with a 35% reduction in the first three years and further reductions later. However, NGT criticised this approach, stating that tolerating pollution violations for such a long period went against the fundamental right to clean air.
Other Criticism
• It is not clear which pollutants will be targeted for reduction, raising concerns about the effectiveness of the program.
• The NCAP is described as a cooperative and participatory initiative, rather than being mandated by law.
• The NCAP is not notified under any Act, which means it lacks a firm mandate with strong legal support.
• The program mentions that the Central Pollution Control Board (CPCB) will execute it in line with the Air (Prevention and Control of Pollution) Act, 1986, but specifics on implementation are not provided.
• Previous plans such as the National Clean Air Action Plan from the 11th and 12th Five Year Plans faced challenges due to similar issues of lacking a clear legal mandate and adequate funding.
National Air Quality Monitoring Programme
• The National Air Quality Monitoring Programme (NAMP) is a nationwide initiative led by the Central Pollution Control Board (CPCB).
• NAMP aims to determine the current status and trends of ambient air quality across various locations in the country.
• The program helps ascertain whether the National Ambient Air Quality Standards (NAAQS) are being met in different regions.
• It identifies cities where air quality standards are not being met consistently, known as non-attainment cities.
• Studying Natural Processes: NAMP also seeks to understand the natural processes involved in cleaning the atmosphere.
• By monitoring air quality and identifying areas of concern, NAMP facilitates the implementation of preventive and corrective measures to address air pollution effectively.
National Ambient Air Quality Standards(NAAQS)
• NAAQS is developed by the Central Pollution Control Board.
| National Ambient Air Quality Standards, as of 2009 | |||
| Pollutant (must remember) | Time Weighted Average | Concentration in Ambient Air (numbers not important) | |
| Industrial, Residential, Rural & Other Area | Ecologically Sensitive Area (notified by GOI) | ||
| SO , µg/m3 2 | Annual | 50 | 20 |
| 24 hours | 80 | 80 | |
| NO , µg/m3 2 | Annual | 40 | 30 |
| 24 hours | 80 | 80 | |
| 3 PM10, µg/m | Annual | 60 | 60 |
| 24 hours | 100 | 100 | |
| PM , µg/m3 2.5 | Annual | 40 | 40 |
| 24 hours | 60 | 60 | |
| O , µg/m3 3 | 8 hours | 100 | 100 |
| 1 hou | 180 | 180 | |
| Lead (Pb), µg/m3 | Annual | 0.50 | 0.50 |
| 24 hours | 1 | 1 | |
| CO, mg/m3 | 8 hours | 2 | 2 |
| 1 hou | 4 | 4 | |
| Ammonia (NH3), µg/ m3 | Annual | 100 | 100 |
| 24 hours | 400 | 400 | |
| Benzene | Annual | 5 | 5 |
| Benzopyrene | Annual | 1 | 1 |
| Arsenic (As), ng/m3 | Annual | 6 | 6 |
| Nickel (Ni), ng/m3 | Annual | 20 | 20 |
SAFAR System for Monitoring Air Pollutants
• The System of Air Quality and Weather Forecasting and Research (SAFAR) is a national initiative led by the Ministry of Earth Sciences (MoES).
• SAFAR measures the overall pollution level and location- specific air quality of metropolitan cities. It utilises multiple air quality monitoring stations equipped with real-time monitors for various pollutants like PM2.5 and PM10.
• In addition to air quality, SAFAR also monitors various weather parameters such as temperature, rainfall, humidity, wind speed, wind direction, UV radiation, and solar radiation.
• The system is developed by the Indian Institute of Tropical Meteorology (IITM), Pune, and operationalised by the India Meteorological Department (IMD).
• SAFAR features a large LED display providing real-time air quality index information with colour-coding for easy interpretation. It also offers a 72-hour advance forecast.
• The primary goal of SAFAR is to increase public awareness about air quality in their city. It aims to provide timely information to help individuals make informed decisions about outdoor activities and protect their health
SAFAR is an essential component of India’s first Air Quality Early Warning System, particularly operational in Delhi, aimed at alerting residents about deteriorating air quality conditions in advance.
Pollutants monitored under SAFAR System include:
1. PM2.5,
2. PM10,
3. Ozone,
4. Carbon Monoxide (CO),
5. Nitrogen Oxides (NOx),
6. Sulphur Dioxide (SO2),
7. Benzene (Benzene is found in crude oil. It’s used to make plastics, resins, synthetic fibres, rubber lubricants, etc. As a Volatile Organic Compound, benzene reacts with other air pollutants to form ground level ozone which can damage crops (in the form of smog) and materials),
8. Toluene (methylbenzene — used in paint thinners and as an octane booster in gasoline engines),
9. Xylene (dimethylbenzene— used as a solvent in printing, rubber, and leather industry), and
10. Mercury
National Air Quality Index (AQI)
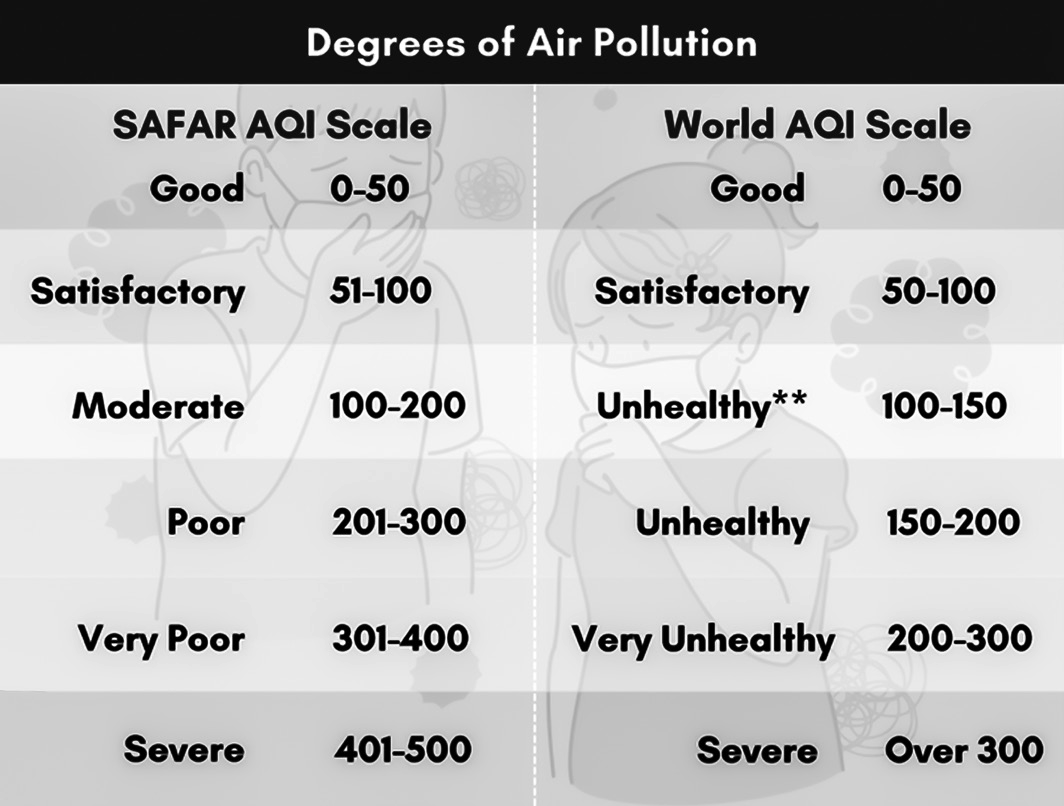
• The National Air Quality Index (AQI) was introduced by the Environment Ministry in April 2015 under the ‘Swachh Bharat’ initiative.
• The AQI is designed to provide the general public with a simple way to assess the air quality in their vicinity. It helps individuals understand the level of pollution and its potential impact on health.
• The AQI categorises air quality into six levels: Good, Satisfactory, moderately polluted, Poor, Very Poor, and Severe. Each category corresponds to a range of AQI values, indicating different levels of pollution severity.
• The AQI considers eight pollutants to calculate the overall air quality index. These pollutants include particulate matter (PM10 and PM2.5), nitrogen dioxide (NO2), sulphur dioxide (SO2), carbon monoxide (CO), ozone (O3), ammonia (NH3), and lead (Pb).
Measures Taken to Control Air Pollution in the National Capital Region
• The Environment Pollution (Prevention and Control) Authority (EPCA) is a body appointed by the Supreme Court with a mandate to address environmental pollution.
• EPCA was established in 1998 under the Environment Protection Act, 1986. It was created with the purpose of tackling environmental pollution in the National Capital Region (NCR).
• Initially, EPCA’s primary focus was on ensuring the transition of Delhi’s bus and auto fleet to Compressed Natural Gas (CNG) to reduce air pollution in the city.
• Over time, EPCA’s mandate has evolved to encompass a broader range of responsibilities related to environmental pollution control. Its current mandate includes preventing and controlling pollution in the National Capital Region.
• EPCA is tasked with enforcing the Graded Response Action Plan (GRAP) in the NCR.
Graded Response Action Plan (GRAP)
• The Graded Response Action Plan (GRAP) is a comprehensive strategy designed to address air pollution levels in the Delhi-NCR region.
• GRAP is activated during periods of high air pollution as an emergency response.
• GRAP is structured in a step-by-step manner. As air quality worsens, additional measures are implemented to address the increasing pollution levels.
• GRAP involves coordination among various government agencies, including pollution control boards, industrial authorities, and municipal corporations. This collaboration ensures a unified approach to pollution control efforts.
• GRAP requires action and coordination from 13 different agencies across Delhi and neighboring states like Uttar Pradesh, Haryana, and Rajasthan.
• Before implementing any measures, the Environment Pollution (Prevention and Control) Authority (EPCA) convenes a meeting with representatives from all NCR states to discuss and plan the necessary actions.
ACTIONS UNDER GRAP
Severe+ or Emergency (PM2.5 over 300 μg/cubic Meter or PM10 over 500 μg/cu. m. for 48+ hours):
• Trucks are barred from entering Delhi, except those carrying essential goods.
• Construction activities are halted.
• The odd-even scheme for private vehicles is implemented, with minimal exemptions.
Severe (PM2.5 over 250 μg/cu. m. or PM10 over 430 μg/cu. m.):
• Brick kilns, hot mix plants, and stone crushers are shut down.
• Power generation from natural gas is increased to reduce reliance on coal.
• Roads are regularly cleaned with mechanised equipment and water sprinkling.
Very Poor (PM2.5 121-250 μg/cu. m. or PM10 351-430 μg/cu. m.):
• Diesel generator sets are prohibited from use.
• Parking fees are increased significantly.
• Apartment owners are encouraged to provide electric heaters instead of burning fires in winter.
Moderate to Poor (PM2.5 61-120 μg/cu. m. or PM10 101-350 μg/cu. m.):
• Heavy fines are imposed for garbage burning.
• Regulations in brick kilns and industries are strictly
enforced.
• Roads with heavy traffic are cleaned using mechanised sweeping and water sprinkling.
• The ban on firecrackers is strictly enforced.
World Air Quality Report
• IQAir publishes World Air Quality Report to monitor the air quality of different country. As per the report, India ranked sixth most polluted country in the world based on average PM2.5 concentration levels in 2025.
• It shows that the air quality is decreasing as the pollution level in India is increasing. It is due to the outcome of the flexible Indian environment law, administrative ineffectiveness and low awareness in public
Other Measures
• NGT issued a ban on the operation of old diesel and petrol vehicles within the city limits.
• Open burning of waste, such as garbage and agricultural residues, has been largely restricted or curtailed.
• The construction and completion of the eastern and western peripheral expressways provide alternative routes for vehicles not destined for Delhi.
Has GRAP Helped?
• GRAP has succeeded in establishing clear accountability and deadlines for actions to be taken under different air quality categories.
• Each action is assigned to specific executing agencies, simplifying coordination among multiple agencies across different states.
• GRAP has played a pivotal role in shaping important policy decisions aimed at reducing air pollution. These include the closure of the thermal power plant at Badarpur, the early introduction of BS-VI fuel in Delhi, and the ban on the use of Peat coke as a fuel in Delhi-NCR.
• The Environmental Pollution (Prevention and Control) Authority (EPCA), established by the Supreme Court in 1998, oversees the implementation of GRAP. EPCA, along with other stakeholders such as the Centre for Science and Environment, continues to monitor pollution levels and assist the Supreme Court in addressing pollution- related matters.
MEASURES TO REDUCE STUBBLE BURNING
PUSA Decomposer
• This invention by scientists at the Indian Agricultural Research Institute (IARI) is aimed at quickly decomposing stubble in Delhi and neighboring states.
• It involves capsules that produce a liquid substance, which farmers can then mix with jaggery and gram flour and spray onto the stubble. This mixture helps the stubble biodegrade within 20 days.
Super Stubble Management Systems (Super SMS) and Happy Seeders
• The Punjab government provided over 50,000 subsidised stubble management machines to farmers.
• The Super SMS chops and spreads stubble evenly, while the Happy Seeder allows for direct sowing of wheat without clearing the stubble.
• However, the short window between paddy harvesting and wheat sowing limits the coverage of these machines.
• Farmers are also demanding cash incentives to stop burning crop residue.
Smog Towers
• Following a directive from the Supreme Court in November 2020, the government was tasked with developing a plan to install “smog towers” across the capital to combat air pollution.
• These towers function as large-scale air purifiers, equipped with multiple layers of air filters that remove pollutants as the air passes through.
• The filters are designed to include carbon nanofibers as a key component.
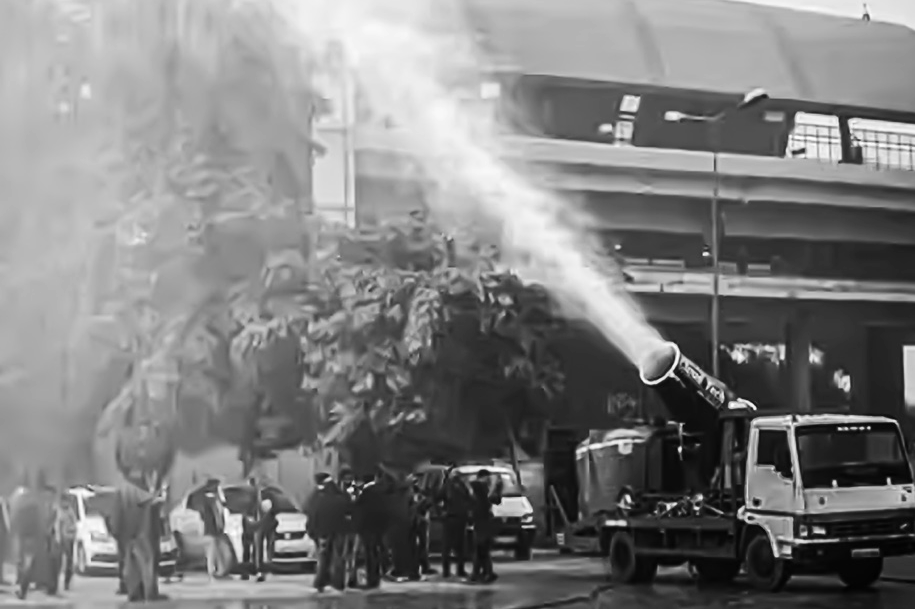
• Also, the Supreme Court mandated the installation of anti-smog guns in projects requiring environmental clearance and having a built-up area exceeding 20,000 square meters.
• Consequently, 47 large projects in Delhi were required to install these anti-smog guns as per the Supreme Court’s instructions.
Emissions Trading Scheme (ETS) by Gujarat for Trading in Particulate Matter
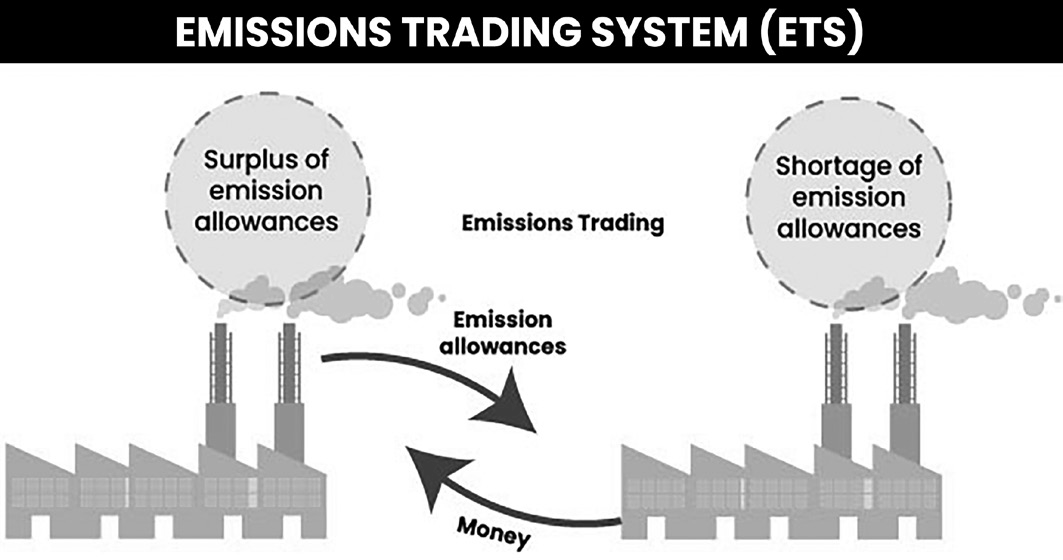
• Gujarat’s Emissions Trading Scheme (ETS) introduces a new approach to pollution control by focusing on trading in particulate matter emissions.
• Unlike existing mechanisms such as the Clean Development Mechanism (CDM) for carbon credits or the European Union’s Emission Trading System for greenhouse gas emissions, this scheme targets particulate matter specifically.
• Launched initially in Surat, the ETS aims to reduce
pollution while also minimising compliance costs for industries.
• Notably, the Abdul Latif Jameel Poverty Action Lab (J-PAL), led by Nobel Laureates Abhijit Banerjee and Esther Duflo, is among the primary agencies involved in developing and implementing this innovative scheme.
How does Emission Trading Scheme (ETS) work?
• In the Emission Trading Scheme (ETS), the Gujarat Pollution Control Board (GPCB) establishes a limit, or cap, on the total amount of particulate matter emissions permitted for all industries combined. Each industry is allocated a certain number of permits, representing the right to emit a specified amount of particulate matter, usually measured in kilograms.
• Industries that can reduce their emissions more easily or at a lower cost may end up with surplus permits, which they can then sell to other industries that find it more difficult or expensive to reduce their emissions.
• By creating a market for emissions permits, the ETS incentivises industries to invest in cleaner technologies and practices to reduce their emissions.
Why was Surat Chosen for the Scheme?
• Surat was chosen for the Emission Trading Scheme (ETS) because it is experiencing significant pollution issues.
• Additionally, industries in Surat have already installed Continuous Emission Monitoring Systems (CEMS), allowing for the measurement and estimation of the mass of particulate matter being emitted.
• This existing infrastructure makes it feasible to implement and monitor the ETS effectively in Surat.
OTHER MEASURES
Green Crackers
• Green crackers were mandated by the Supreme Court in 2019 for Diwali celebrations to reduce pollution. Traditionally, firecrackers contained harmful substances like barium nitrate, but the SC banned its use.
• The National Environmental Engineering Research Institute (NEERI) replaced barium nitrate with potassium nitrate and zeolite in green crackers to cut down PM10 and PM2.5 by 30%.
•
Most of India’s crackers are made in Sivakasi, Tamil Nadu.
Government Initiatives to Reduce SO2 Emissions
• The government set limits for SO2 emissions from coal power plants in 2015. They mandated the installation of flue-gas desulphurisation units by December 2017, but many plants missed this deadline.
• Although the deadline was extended to 2022, as of June 2021, most plants haven’t met the standards.
• The cost to install pollution-control technology in both existing and new plants is estimated to be at least ₹73,000 crore.
Flue-gas Desulphurisation (FGD) Systems
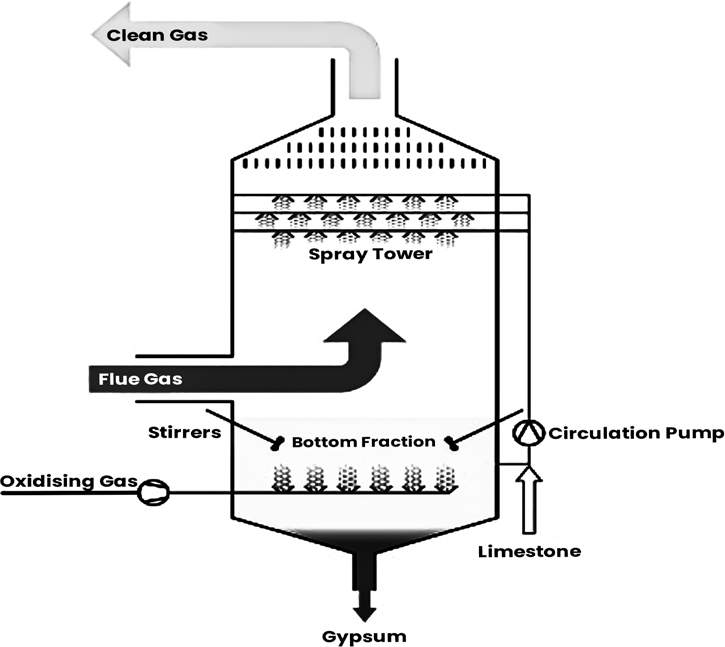
• Flue-gas desulphurisation (FGD) systems use lime to remove acidic gases like sulphur dioxide (SO2) and hydrogen chloride (HCl) from the gases released through exhaust pipes. This process can be done either wet or dry.
• In wet FGD systems, the flue gases come into contact with a liquid or solid absorbent, where the sulphur dioxide reacts with the absorbent to form wet calcium sulfite.
• This sulphite can then be converted into gypsum, which has various uses including in cement production.
• In dry FGD scrubbing, lime is injected directly into the flue gas to remove SO2 and HCl, particularly from low- sulphur fuels.
Pradhan Mantri Ujjwala Yojana to Reduce Household Pollution
• India’s air pollution level in 2015 was 55 micrograms per cubic meter, with New Delhi often reaching over 300 micrograms per cubic meter.
• Using cleaner fuels like LPG instead of biomass could reduce India’s annual air pollution to 38 micrograms per cubic meter, slightly below the national standard of 40 and above the WHO standard of 10.
• The Pradhan Mantri Ujjwala Yojana, started in 2016 by the Ministry of Petroleum & Natural Gas, aims to provide LPG connections to women from Below Poverty Line households.
Effects of Air Pollution
EFFECTS OF AIR POLLUTION
Air Pollution is the 4th Greatest Killer-State of Global Air 2020
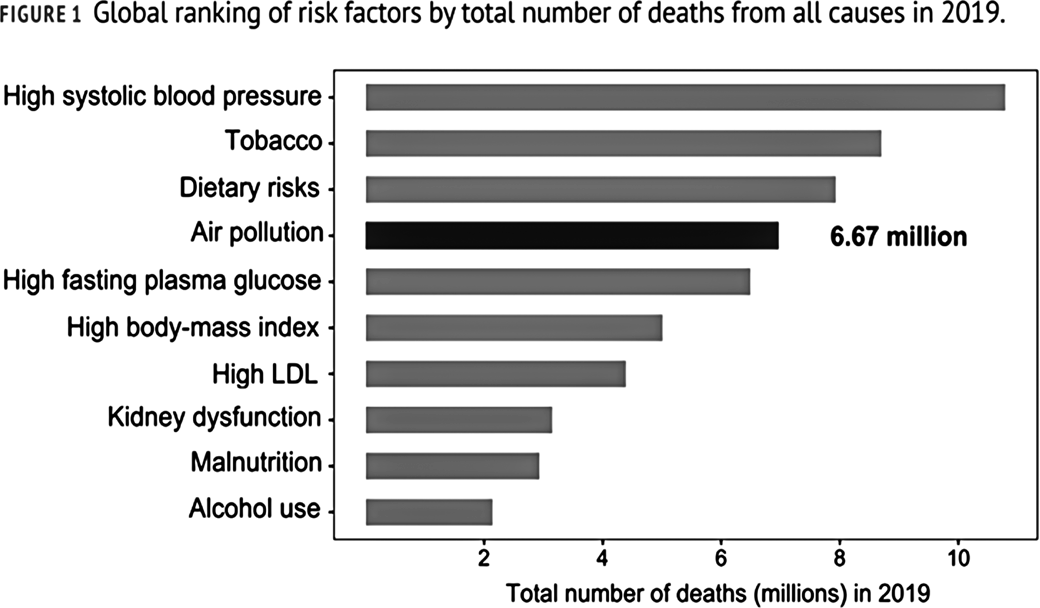
According to the ‘State of Global Air 2020’ report by the Health Effects Institute, air pollution, both outdoor and indoor, led to over 1.67 million deaths in India in 2019, with more than 55% attributed to outdoor pollution.
Globally, air pollution was responsible for 6.67 million deaths in 2019, with 4.14 million due to outdoor PM2.5 exposure and 2.31 million due to household air pollution.
India had the highest population-weighted annual average exposure to PM2.5 and the third highest exposure to ozone.
Air pollution ranked as the fourth leading cause of all deaths globally in 2019.
Smog (Smoke + Fog)
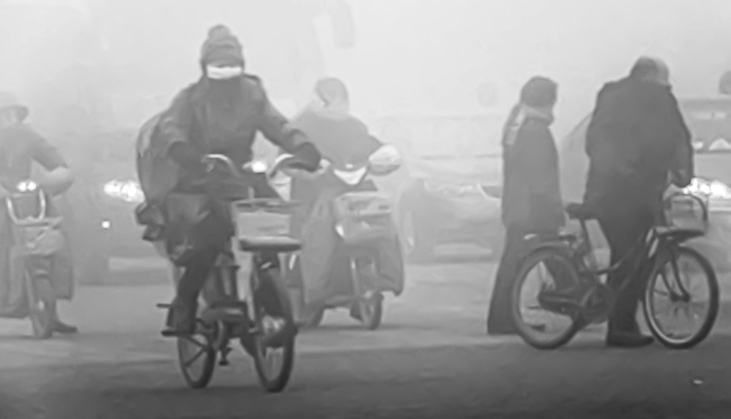
Smog, a portmanteau of “smoke” and “fog,” results from the combustion of coal, vehicle emissions, and industrial fumes, which are primary pollutants.
It comprises soot particulates, including smoke, as well as ozone (O3), carbon monoxide (CO), sulphur dioxide (SO2), nitrogen dioxide (NO2), and other pollutants.
Two main types of smog are identified: sulphurous smog and photochemical smog.
Sulphurous Smog
Sulphurous smog, also known as London smog due to its origins in the industrial revolution, is characterised by a high concentration of sulphur oxides in the air.
It is primarily caused by the combustion of sulphur- bearing fossil fuels, particularly coal, which is a major source of electricity generation in India.
This type of smog is worsened by damp conditions and a high concentration of suspended particulate matter in the air.

Sulphurous Smog
Photochemical Smog
Photochemical smog, also called summer smog or Los Angeles smog, occurs mainly in urban areas with high automobile traffic.
It forms when nitrogen oxides, primarily emitted by vehicles, and volatile organic compounds react in sunlight to produce ozone.
Occupational Health Hazards
Black lung disease
• In coal mining regions, coal dust is the primary air pollutant.
• When miners inhale this dust over many years, it accumulates in their lungs, causing a condition known as pneumoconiosis or anthracosis, commonly referred to as black lung disease.
• The name comes from the appearance of the miners’ lungs, which turn black due to the deposited coal dust.
Over time, this accumulation leads to thickening and scarring of the lungs, impairing their ability to efficiently supply oxygen to the blood
Chemicals and Biological Agents
• Certain substances like benzene, chromium, nitrosamines, and asbestos have been linked to various cancers such as lung, bladder, skin, mesothelium, and liver cancers.
• Occupational asthma can result from exposure to organic dust, microorganisms like bacteria and fungi,
This smog appears as a light brownish haze in the atmosphere, reducing visibility and causing irritation to the eyes and respiratory system.

Photochemical smog
Haze
Haze is when dust, smoke, and other dry particles make the sky less clear without any condensation. It’s similar to smog but without the condensation. Haze particles come from activities like farming, traffic, industry, and wildfires.
Effects of Smog
| Toxic Chemical | Sources | Environmental Effects |
| Nitrogen Oxides (NO and NO2) | Combustion of oil, coal, gas Bacterial action in soil Forest fires, volcanic action Lightning | Decreased visibility due to yellowish colour of NO2 NO2 can suppress plant growth |
| Volatile Organic Compounds (VOCs) | Evapouration of fuels Incomplete combustion of fossil fuels | Eye irritation Respiratory irritation Some are carcinogenic Decreased visibility due to blue-brown haze |
| Ozone (O3) | Formed from photolysis of NO2 Sometimes resultsfrom stratospheric ozone intrusions | Decreased crop yields Retards plant growth Damages plastics Breaks down rubbe |
| Peroxyacetyl Nitrates (PAN) | Formed by the reaction of NO2 with VOCs | Eye irritation High toxicity to plants Damaging to proteins |
In cities like Los Angeles, Beijing, Delhi, and Mexico City, pollution levels increase because of inversions, which trap smog near the ground.
This smog is harmful to humans, leading to sickness or even death.
Inversions make temperatures higher and reduce rainfall, worsening the smog. This smog-related haze also reduces visibility.
Acid Rain – Acidification
Acid rain occurs when rain or other forms of precipitation become more acidic than usual, with a pH level below 5.6.
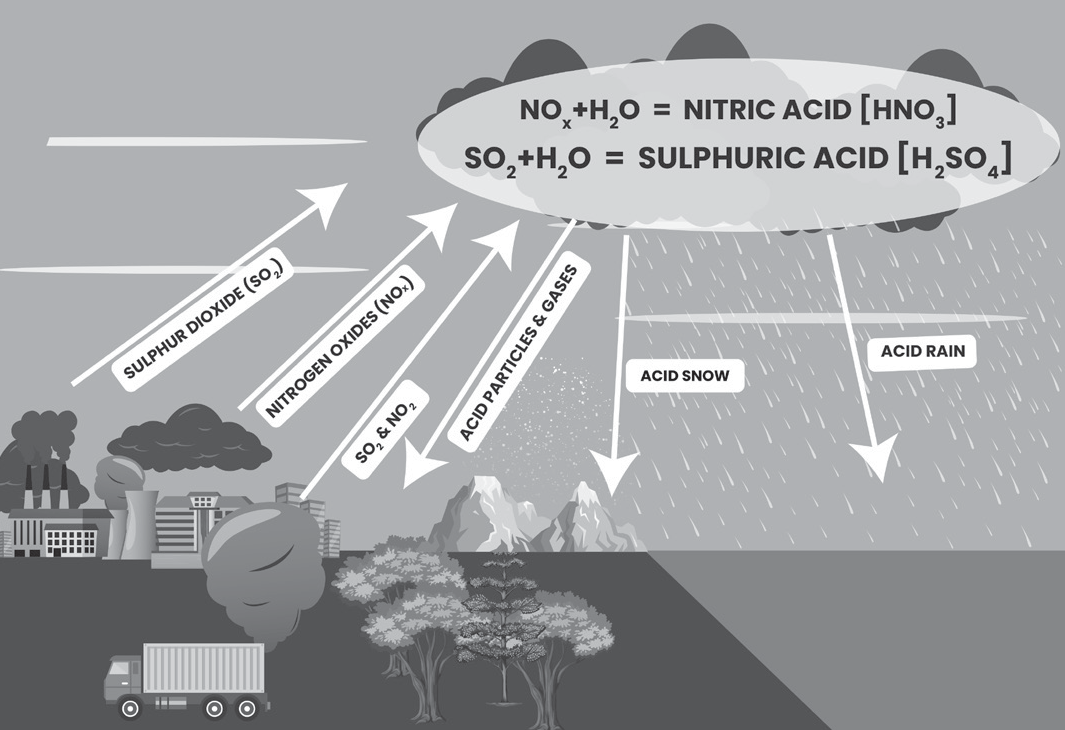
This acidity is caused by pollution in the air, particularly from gases like sulphur dioxide and nitrogen oxides emitted during the burning of fossil fuels.
Also, acidic smog, fog, and mist in the atmosphere can settle on dust particles and accumulate on plants, leading to acid depositions.
When it rains, these acids can leach out from the dust and form acid dews.
Gases that Cause Acid Rain
| Acidic gases | Source |
| SOx (Sulphur oxides) | Burning fossil fuels like coal and oil, operating power plants, processing metal ores containing sulphur, industrial activities such as producing sulphuric acid, natural events like volcanic eruptions, and natural processes like decay of organic matter and emissions from seas and oceans. |
| NOx (Nitrogen oxides – NO, NO2 and N2O) | Fossil fuel burning, lightning, biomass burning, forest fires, oceans, power plants. |
Types of Acid Deposition
Acid deposition comes in two main forms: wet and dry deposition.
Wet Deposition: When acidic pollutants in the air are carried to areas with moist weather, like rainforests or coastal regions, they can mix with water vapour and fall to the ground as rain, snow, fog, or mist. As this acidic water moves over and through the soil, it can affect plants and animals.
Dry Deposition: In drier regions, acidic pollutants can mix with dust or smoke and settle on surfaces like the ground, buildings, vegetation, and vehicles. When it rains, this dry deposition can be washed into the soil, rivers, and lakes, making them more acidic. Around half of the acidic pollutants in the air return to the earth through dry deposition.
Chemistry of Acid Rain
The atmosphere gets sulphur and nitrogen oxides from both natural sources (like volcanoes) and human activities (like burning fossil fuels).
Some of these oxides fall back to the ground as dry deposition, either near where they were emitted or farther away.
Sunlight triggers the formation of photo-oxidants (like ozone) in the air.
These photo-oxidants react with sulphur and nitrogen oxides, as well as other gases like ammonia, to create sulphuric acid (H2SO4) and nitric acid (HNO3) through oxidation.
The resulting acid rain, containing sulphate, nitrate, ammonium, and hydrogen ions, falls to the ground as wet deposition, such as rain or snow.
Harmful Effects of Acid Rain
Acid rain has various harmful effects on the environment:
Effects on Soil:
Acid precipitation leads to the leaching of essential nutrients like potassium and magnesium from the soil, making it infertile.
It also increases ammonia levels while decreasing nitrate levels, impacting decomposition rates.
However, Indian soils are less affected due to their alkaline nature and strong buffering capacity.
Effects on Humans:
Acid rain causes unpleasant odours, reduced visibility, and irritation of the skin, eyes, and respiratory tract.
Prolonged exposure can lead to chronic bronchitis, pulmonary emphysema, and even cancer.
Effects on Aquatic Life:
pH changes from acid rain affect the reproductive cells of fish, frogs, and other aquatic organisms.
It disrupts their life cycles and productivity, leading to imbalances in ecosystems.
Acidic waters can also kill essential microbes and release metals into aquatic environments.
Effects on Terrestrial Life:
Acid rain damages the cuticles of plant leaves, hindering photosynthesis.
It promotes the leaching of toxic heavy metals like aluminium, lead, and mercury into the soil.
This affects soil microorganisms and can indirectly impact wildlife by altering food and habitat resources.
Effects on Microorganisms:
pH changes affect microbial proliferation, with bacteria and protozoa preferring neutral pH and fungi favouring acidic conditions.
Shifts in microbial populations can delay soil organic material decomposition, particularly in taiga vegetation areas.
Effects on Buildings and Monuments:
Acid rain corrodes materials like limestone and marble, causing them to dissolve or flake away.
Many structures, including the Taj Mahal, have suffered damage from acid rain, leading to phenomena like “Marble Cancer.”
Acid Rain Areas
Acid rain is primarily found in industrialised regions of the northern hemisphere, including Scandinavia, Canada, Japan, the Northeast United States, and Northwestern Europe.
In India
In India, acid rain was first reported in Bombay in 1974, and instances have been observed in many metropolitan cities. Soil pH reduction has been noted in areas such as northeastern India, coastal Karnataka and Kerala, as well as parts of Odisha, West Bengal, and Bihar.
Acid Rain Control
To control acid rain, several measures can be implemented:
Using low sulphur fuel, natural gas, or washed coal in thermal plants to reduce emissions.
Buffering, which involves adding neutralising agents like lime (calcium oxide and calcium carbonate) to acidified water to raise its pH level.
Ocean Acidification
Ocean acidification is often described as the “evil twin of global warming” or “the other CO2 problem.”
It refers to the ongoing decrease in the pH of the Earth’s oceans, primarily caused by the absorption of carbon dioxide (CO2) from the atmosphere.
Approximately 30–40% of the carbon dioxide emitted by human activities is absorbed by the oceans, rivers, and
lakes. When CO2 dissolves in water, it forms carbonic acid, which increases the acidity of the ocean.
This process occurs because some of the carbonic acid molecules react with water to produce bicarbonate ions and hydronium ions (H+), resulting in higher ocean acidity.
To mitigate ocean acidification, it’s essential to reduce CO and CO2 emissions and control pollution, as these are the primary means of limiting the amount of carbon dioxide entering the atmosphere and subsequently being absorbed by the oceans.
Other Contributors
Eutrophication, the process by which excessive nutrients like nitrogen and phosphorus enter aquatic ecosystems, can exacerbate ocean acidification.
This occurs because eutrophication promotes large plankton blooms, and when these blooms die and sink to the seabed, bacteria decompose the organic matter.
This decomposition process consumes oxygen and releases carbon dioxide (CO2), leading to a decrease in seawater oxygen levels and an increase in CO2 concentration, which further contributes to a decline in pH and exacerbates ocean acidification.
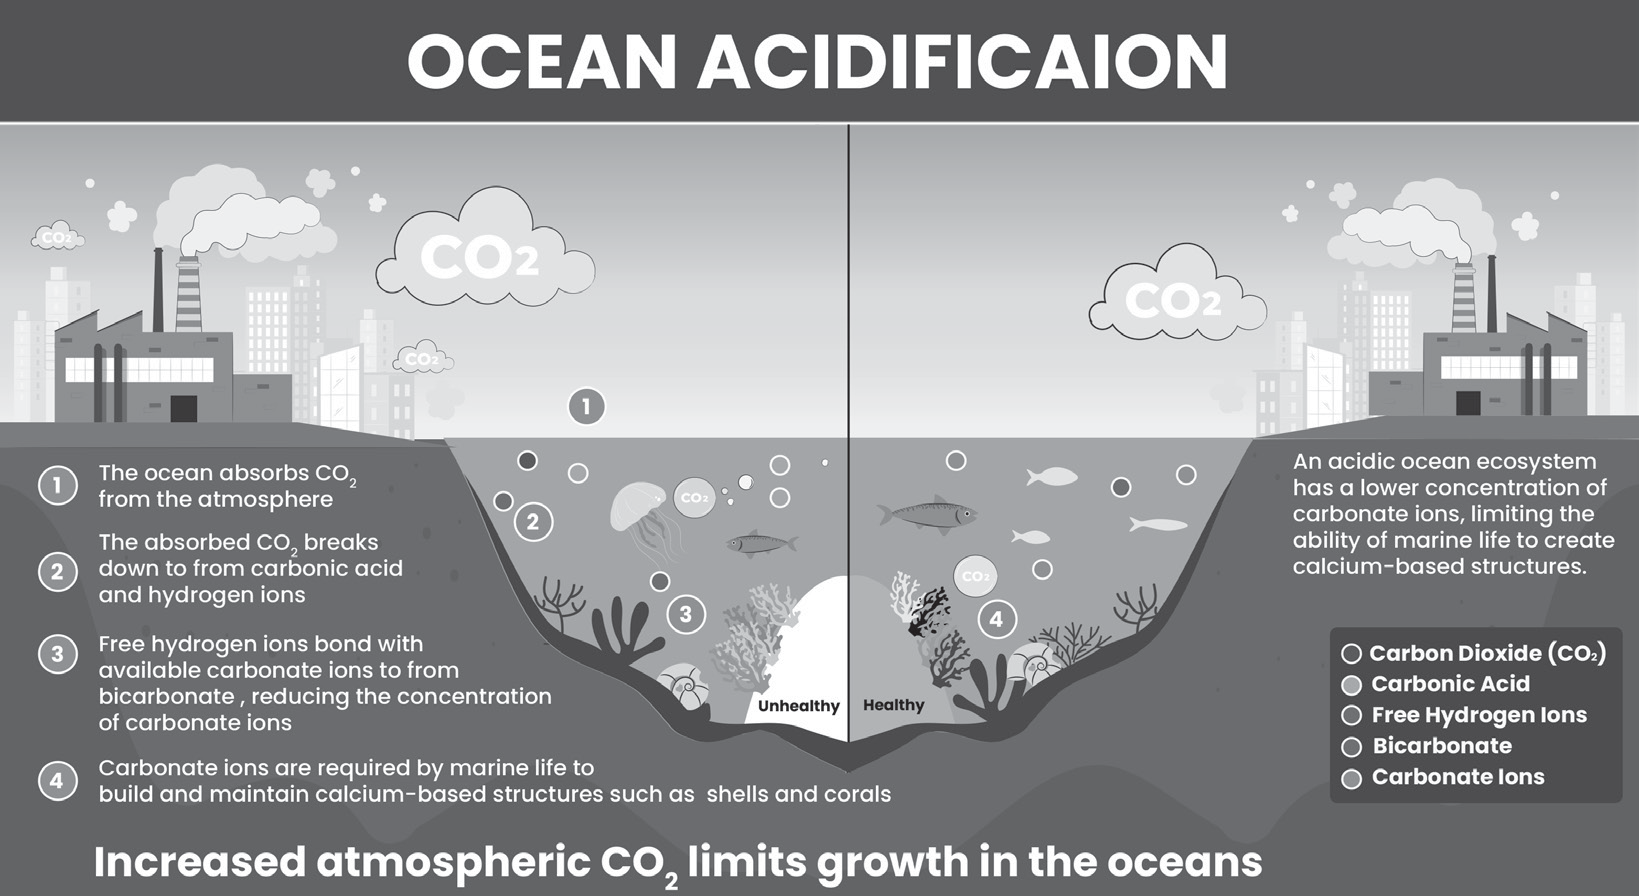
Effects of Ocean Acidification
Reduced Buffering Capacity:
Oceans absorb a significant amount of CO2 produced by human activities, helping to mitigate climate change.
However, the rate of CO2 absorption is surpassing the oceans’ natural capacity to buffer changes in acidity.
This increased acidity affects the metabolic rates and immune responses of some marine organisms.
Adverse Effects on Marine Calcifying Organisms:
When seawater absorbs CO2, it forms carbonic acid, bicarbonate, and carbonate ions.
Higher atmospheric CO2 levels cause a decrease in pH and an increase in carbonic acid and bicarbonate ions, reducing the concentration of carbonate ions.
This reduction in carbonate ions makes it harder for calcifying organisms like coral and some plankton to build calcium carbonate structures.
Fisheries are at risk as acidification harms these calcifying organisms, which form the foundation of Arctic food webs.
Coral bleaching is worsened by increasing acidity, as corals are highly sensitive to changes in water chemistry.
Impact of Ocean Acidification on Cloud Formation:
Phytoplankton in the ocean emits sulphur, mainly in the form of dimethylsulphide (DMS).
DMS reacts in the atmosphere to form sulphuric acid, which aggregates into aerosols, or tiny airborne particles.
These aerosols serve as nuclei for cloud formation, which helps cool the Earth by reflecting sunlight.
However, in acidified ocean water, phytoplankton produces less DMS.
This reduction in sulphur emissions may lead to decreased cloud formation, potentially raising global temperatures.
Aerosols from Air Pollution and their Impact on Monsoon Rainfall
Scientists have observed that aerosols contribute to increased instances of heavy rainfall events in the foothills of the Himalayan region, leading to uneven distribution of rainfall.
This region experiences high levels of aerosol concentration, particularly black carbon and dust.
The elevation difference forces air masses from lower to higher altitudes, resulting in rainfall due to orographic forcing.
Aerosols:
Aerosols are fine solid particles or liquid droplets suspended in air or another gas.
They can be either natural or human-made.
Natural aerosols include fog, mist, dust, emissions from forests, and geyser steam.
Human-made aerosols consist of particulate air pollutants and smoke.
Most aerosols are found in the lower layers of the atmosphere (below 1.5 km) because their sources are predominantly located on the Earth’s surface.
However, some aerosols, particularly volcanic aerosols, can reach the stratosphere, which is higher in altitude.
Effects of Aerosols:
They influence the chemical composition of the atmosphere.
They reduce visibility, affecting air quality and human health.
Aerosols serve as nuclei for cloud droplets or ice crystals, impacting cloud formation processes.
Asian Tropopause Aerosol Layer (ATAL) – Negatively Affects Indian Monsoon
The Asian Tropopause Aerosol Layer (ATAL) extends over South Asia during the monsoon season and is suspected to influence monsoon precipitation.
ATAL forms due to the upward transport of aerosols from the lower atmosphere to the upper troposphere and lower stratosphere (UTLS), typically ranging from 12 to 18 kilometers in altitude.
It comprises sulphates, black carbon, organic aerosols, nitrates, and dust particles.
Black carbon aerosols in ATAL originate from North India and East China during El Niño events, while sulphate aerosols come from East Asia.
The accumulation of these pollutants in the UTLS thickens and expands the ATAL.
The increased presence of sulphate aerosols in the UTLS results in a cooling effect on the Earth’s surface by scattering incoming solar radiation, thus adversely impacting the monsoon.
During El Niño events, which typically lead to decreased rainfall over India, the inclusion of aerosols exacerbates the reduction in rainfall by 17% over central India.
Impact of Aerosols on Regional Rainfall Patterns
Urban areas experience increasing incidents of high rainfall events due to high aerosol loading.
High pollution levels lead to high aerosol loading, which in turn results in more cloud condensation nuclei.
The presence of more cloud condensation nuclei leads to increased precipitation, ultimately resulting in floods.
On the other hand, this phenomenon causes a rainfall deficit in rural areas, leading to drought conditions.
While urban areas face floods, rural areas suffer from drought, creating imbalanced water percolation and lowering the groundwater table, which adversely affects agriculture.
Ozone Depletion
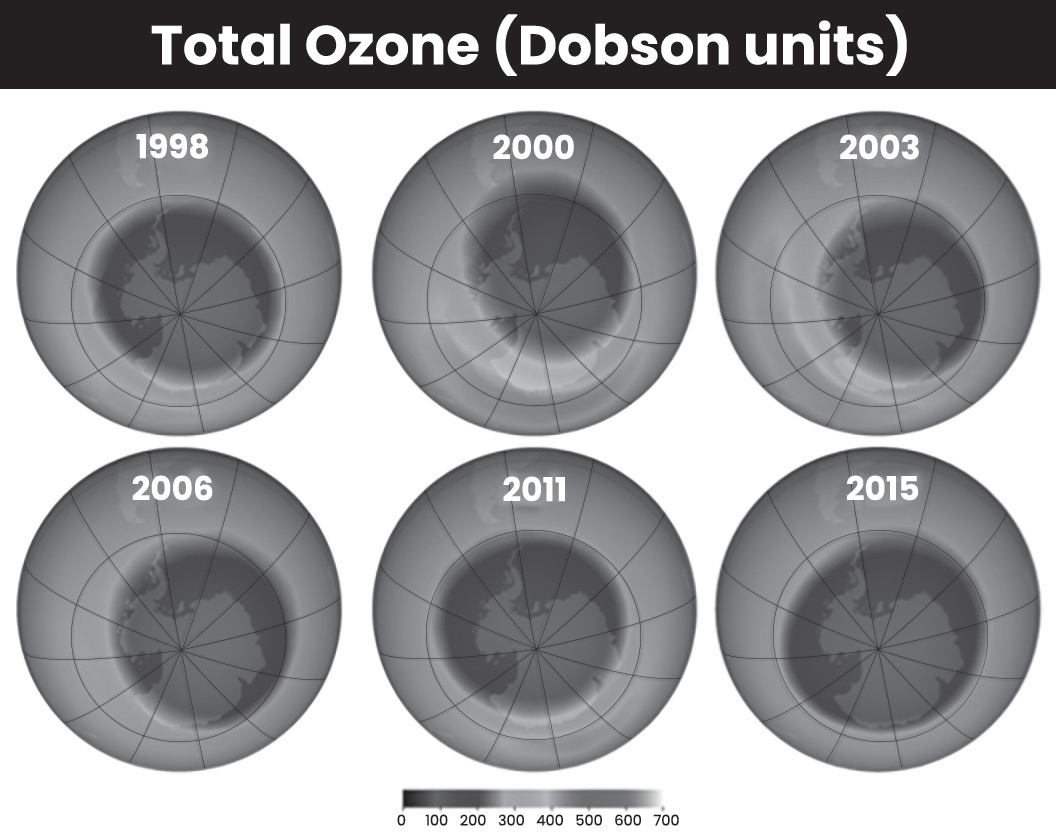
Ozone Hole at the South Pole
Ozone in Earth’s stratosphere is decreasing steadily.
More significant ozone loss is observed around the polar regions.
Special conditions (like the strong polar vortex) in polar areas create clouds that react with CFCs, damaging the ozone layer.
Ozone holes are mainly found over Antarctica due to strong polar winds.
They’re less common over the Arctic because of weaker winds and warmer temperatures.
Ozone depletion is caused by an increase in halocarbons in the air.
Halocarbons are compounds where hydrogen in hydrocarbons is replaced by reactive elements like fluorine, chlorine, bromine, or iodine.
Halogen Atoms Like Chlorine Destroy Ozone
Halogen atoms like chlorine destroy ozone by breaking down ozone molecules into oxygen molecules under sunlight. This process, called photodissociation, occurs with ozone-depleting substances such as CFCs, HCFCs, carbon tetrachloride, trichloroethane, freons, and halons.
When these substances break down, they release free chlorine atoms that contribute to ozone depletion.
Polar Vortex Acts as the Transportation System for Halogens
The polar vortex acts as a transportation system for halogens by creating polar cyclones. These cyclones, which can be as wide as 2,000 km, occur in polar regions and sometimes extend into the lower levels of the stratosphere.
The polar vortex also gives rise to Polar Stratospheric Clouds (PSCs). These clouds play a role in ozone
depletion by providing surfaces for chemical reactions involving ozone-depleting substances.
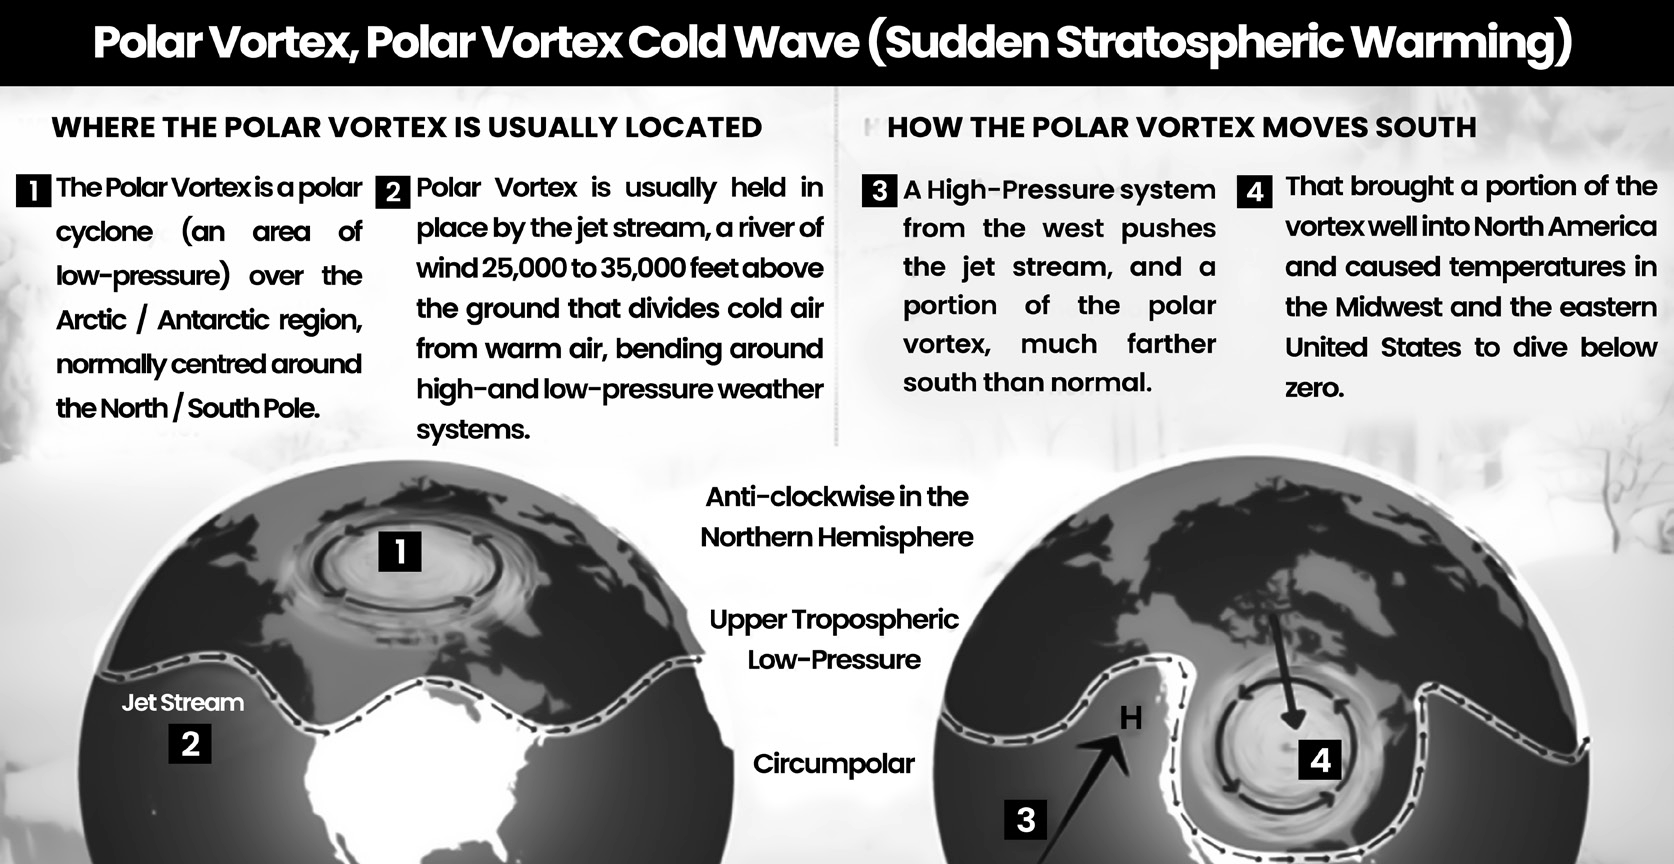
Polar Stratospheric Clouds (PSCs)
Polar Stratospheric Clouds (PSCs) are rare, bright clouds found in the frigid regions of the lower stratosphere, typically between 12 and 22 kilometers above the Earth’s surface.
They are most visible within two hours after sunset or before dawn because there is still sunlight at those heights.
These clouds are mainly seen during winter at high latitudes and are more intense at the South Pole.
PSCs contain water, nitric acid, and/or sulphuric acid and are formed during the event of the polar vortex in winter, particularly at the South Pole.
They play a significant role in ozone depletion by converting reservoir compounds into reactive free radicals such as chlorine and chlorine oxide (Cl and ClO).
These free radicals accelerate the depletion of ozone, thus contributing to the overall reduction of ozone in the atmosphere. Therefore, the polar vortex, through the formation of PSCs, accelerates ozone depletion.
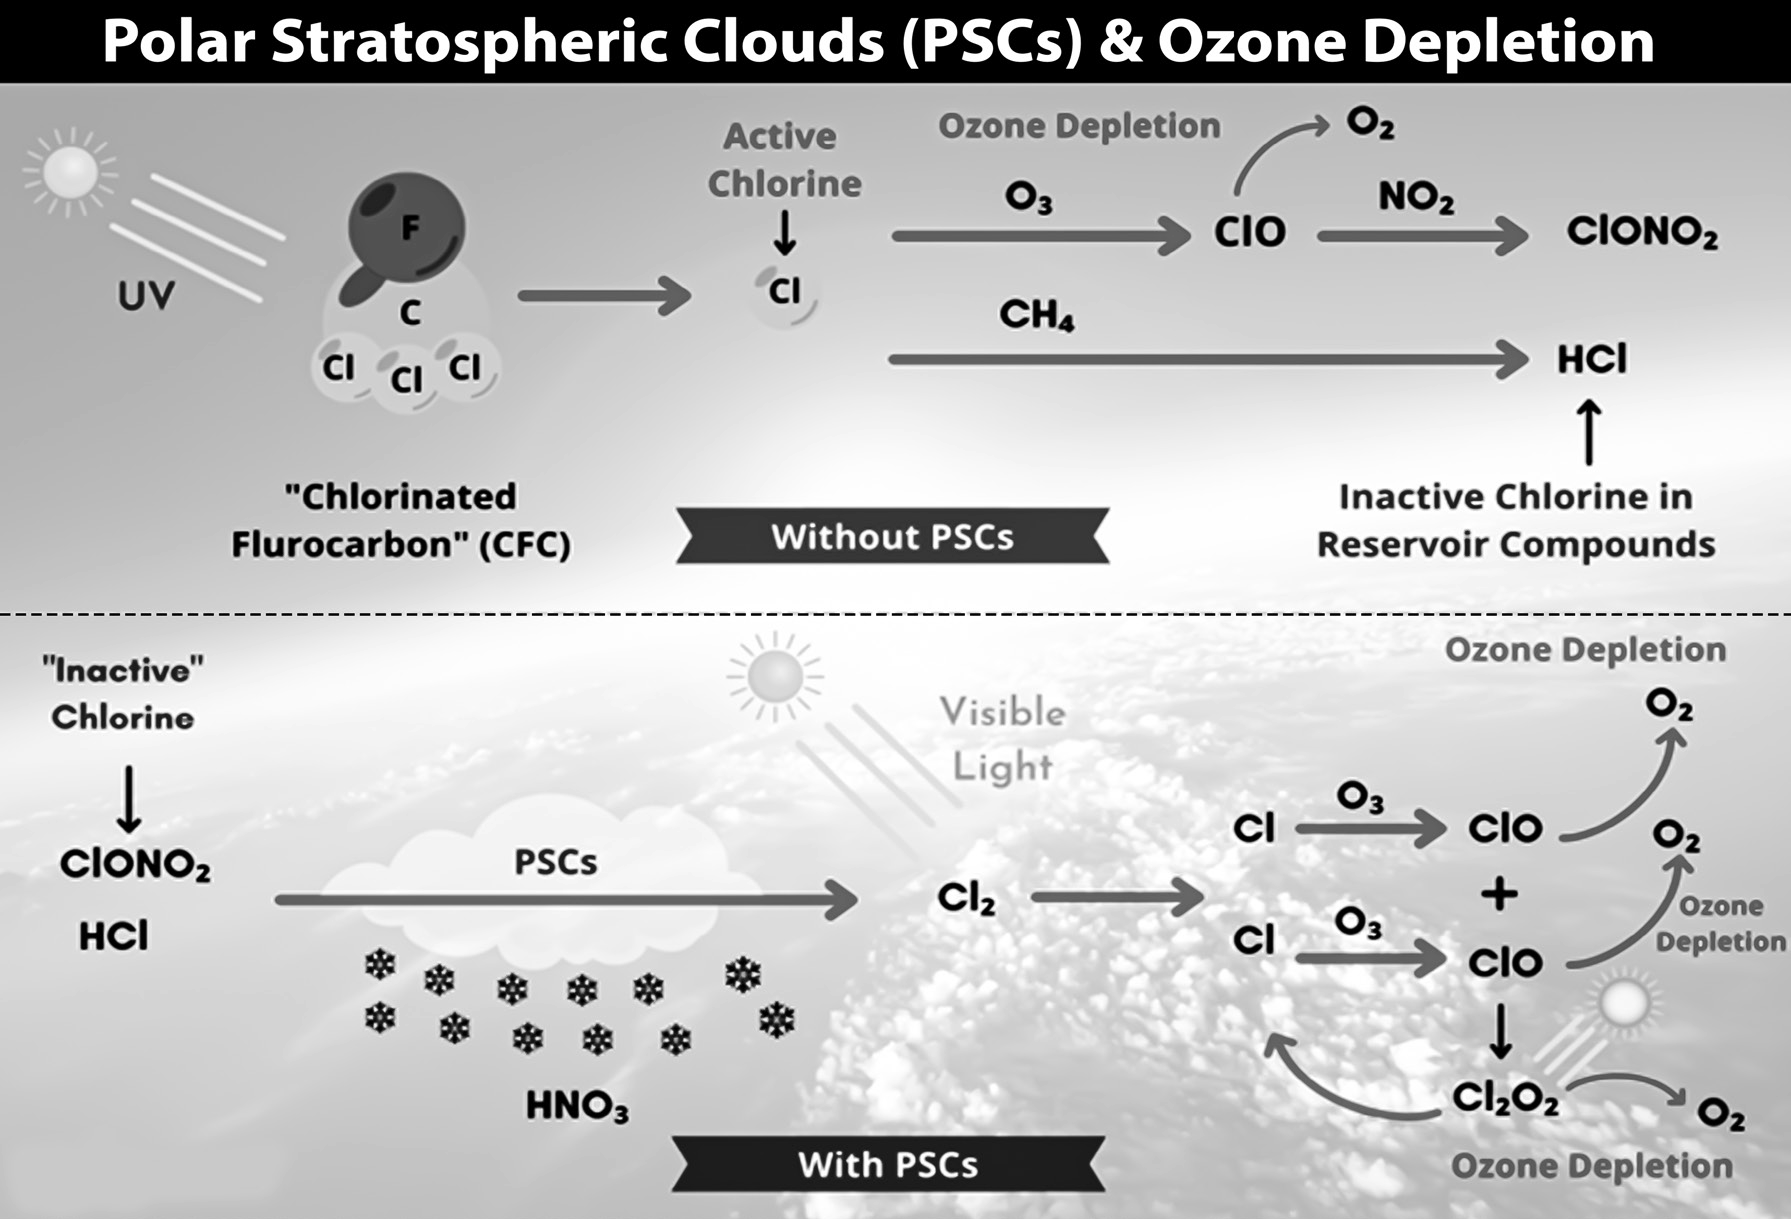
Ozone Depletion is Enhanced by PSCs
Light Pollution
Light pollution refers to the unwanted or excessive artificial lighting that interferes with the natural darkness of the night sky.
This type of pollution is becoming more prevalent due to increasing urbanisation and the widespread installation of streetlights, security floodlights, and decorative outdoor lighting.
As a result, nights are becoming brighter on a global scale.
Sky glow is a phenomenon characterised by a pervasive glow of light across the night sky, particularly in and around urban areas.
This glow can obscure the visibility of all but the brightest stars. Sky glow is caused by both natural and human- made sources.
Natural sources include sunlight reflected off the moon and Earth, faint airglow in the upper atmosphere, and sunlight reflected off interplanetary dust.
However, artificial lighting, or light pollution, has intensified the process of sky glow, exacerbating its effects on the natural darkness of the night sky.
Light Pollution has Several Harmful Effects
Disruption of Wildlife: Excessive artificial lighting can disorient nocturnal animals, causing them to deviate from their natural paths and behaviours. This disruption can have adverse effects on their hunting, mating, and migratory patterns.
Disruption of Circadian Rhythm: The artificial illumination at night can interfere with the natural sleep- wake cycle, known as the circadian rhythm, in humans. This disruption can lead to sleep disturbances, insomnia, and other health issues.
Impact on Plant Life: Plants rely on the daily cycle of light and darkness to regulate vital processes such as growth, reproduction, and protection from predators. Light pollution can disrupt this cycle, affecting plant behaviour and overall ecosystem balance.
Who Guidelines on Air Pollution
WHO: Air Quality Guidelines
The World Health Organisation (WHO) updated its Global Air Quality Guidelines (AQGs) due to a significant increase in scientific evidence demonstrating the harmful effects of air pollution on human health, even at lower concentrations than previously recognised. This update comes after the last revision in 2005.
The new guidelines provide recommended air quality levels for six pollutants:
Particulate Matter 2.5 (PM2.5)
Particulate Matter 10 (PM10)
Ozone (O3)
Nitrogen Dioxide (NO2)
Sulphur Dioxide (SO2)
Carbon Monoxide (CO)
WHO highlighted that some air pollutants, such as black carbon (a component of PM) and tropospheric (ground-level) ozone, are not only harmful to health but also contribute to near-term warming of the planet, making them short-lived climate pollutants.
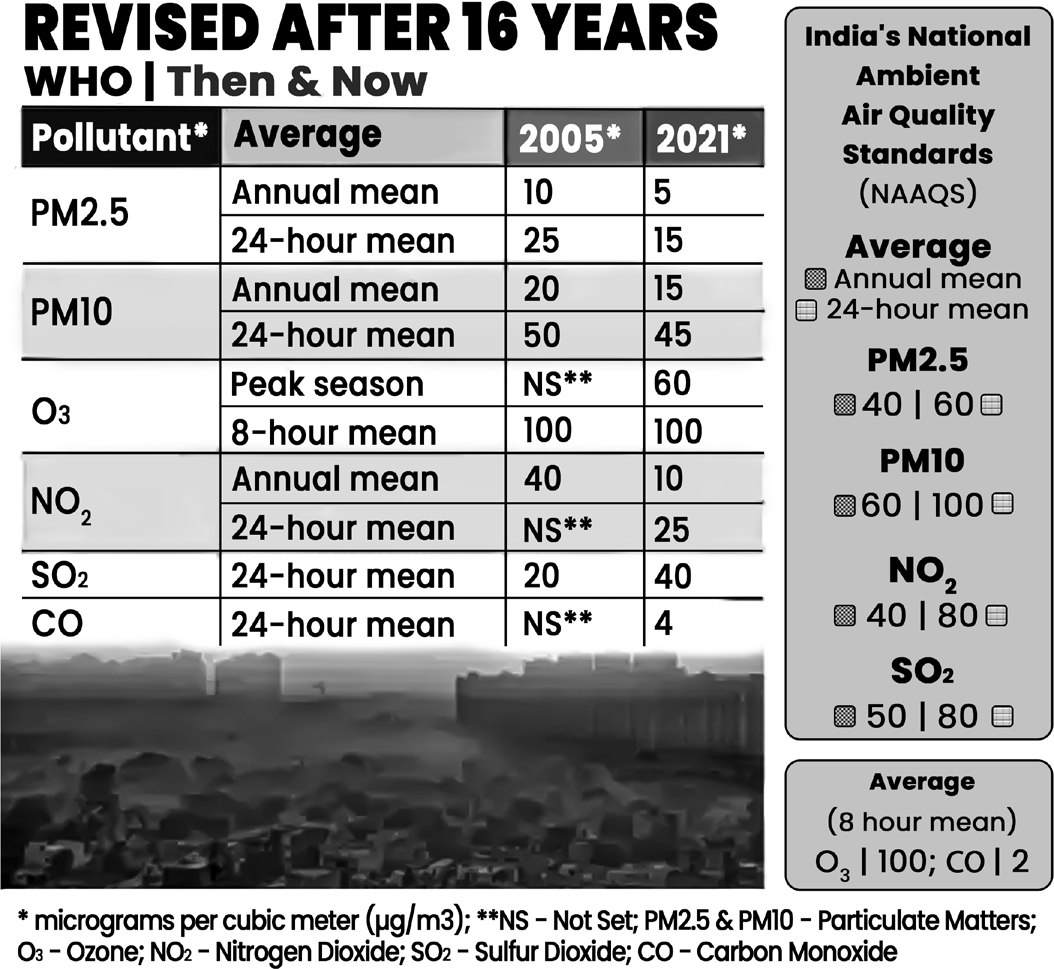
Impact of New Guidelines on India
The implementation of the new WHO air quality guidelines implies that almost the entire Indian territory would be classified as a polluted zone for a significant portion of the year.
Although these guidelines are not legally binding, they serve as a critical benchmark for air quality management.
The adoption of stricter standards by WHO should prompt India to intensify efforts to improve air quality nationwide. However, since the National Ambient Air Quality Standards (NAAQS) in India do not currently align with the WHO’s existing standards, the immediate impact on India may be limited.
Bio Mining of Solid Waste
Bio Mining of Solid Waste
Biomining is a method of extracting valuable metals like copper, uranium, nickel, and gold from ores and other solid materials using microorganisms such as bacteria, fungi, or plants. These organisms produce organic compounds that bind to metals and extract them from the environment.
Bioleaching involves directly dissolving the metal in the process, while bio-oxidation breaks down surrounding minerals to facilitate metal recovery.
Advantages of biomining include its environmentally friendly nature compared to traditional mining methods, which often involve explosives, toxic chemicals, and high temperatures.
However, environmental risks include potential leakage and treatment challenges associated with the acidic, metal-rich solution produced by the microbes, similar to acid mine drainage from abandoned mines.