Poverty
Introduction to Poverty
Poverty is a state or situation in which a person or a group of people don’t have enough money or resources to meet their basic needs. People and families who are poor may not have access to shelter, clean water, healthy food, education or medical care.
As per Global Multidimensional Poverty Index 2023, across 110 countries, 1.1 billion out of 6.1 billion people are poor.
Poverty is also characterized by a lack of participation in decision-making and in civil and sociocultural life. Besides, Poverty is inseparably linked to lack of access to or loss of control over resources, including land, skills, knowledge, capital and social connections.
Poverty can have various manifestations like hunger and malnutrition; ill health; limited or lack of access to education and other basic services; increased morbidity and mortality from illness; homelessness and inadequate housing; unsafe environments; and social discrimination and exclusion.
Without resources, people have limited access to institutions, markets, employment and public services. Therefore, specific measures are needed to address the juvenilization and feminization of poverty.
According to United Nations, poverty is defined as income of less than US $2 per day and today, nearly half of the world’s population currently lives in poverty including one billion children. Of those living in poverty, over 800 million people live in extreme poverty, surviving on less than US $1.25 a day.
Therefore, it is also important to differentiate between
chronic poverty and sporadic poverty: the former, a result of generations of deprivation and the latter, a consequence of a sudden crises or short-term shock like current Corona pandemic.
Vicious Circle of Poverty and Process of Deprivation: Poverty Trap
Poverty is a multi-dimensional concept that encompasses not only economic deprivation, but also deprivation of opportunities as well as deprivation of basic needs such as health, education, housing etc.
The ‘Vicious Circle of Poverty’ refers to the interconnectedness of different factors that reinforce each other for generating poverty. They are poor because they are too many. They are too many because they are poor.
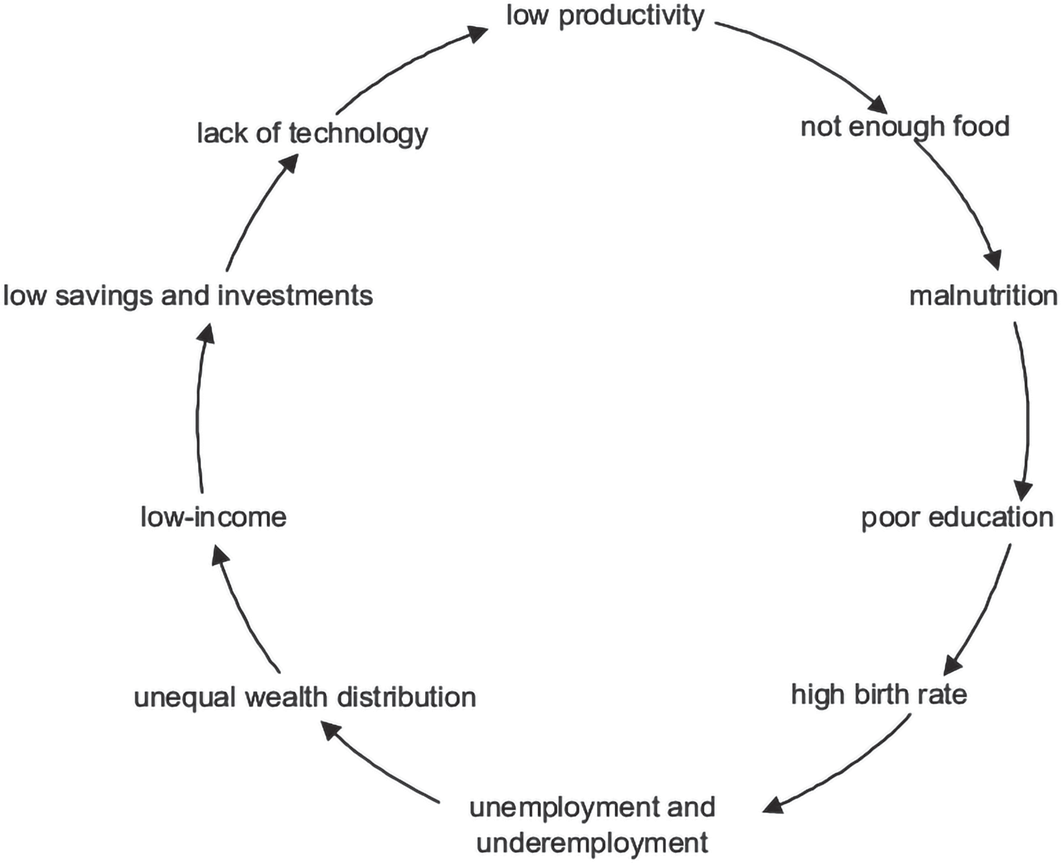
Figure: The Vicious Cycle of Poverty
Cycle of Poverty or Poverty Trap is caused by self- reinforcing mechanisms that cause poverty, once it exists, to persist unless there is outside intervention. It can persist across generations, and when applied to developing countries, is also known as a Development Trap.
It is a spiralling mechanism which forces people to remain
poor. It is so binding in itself that it doesn't allow the poor people to escape it. Poverty trap generally happens in developing and under-developed countries, and is caused by a lack of capital and credit to people.
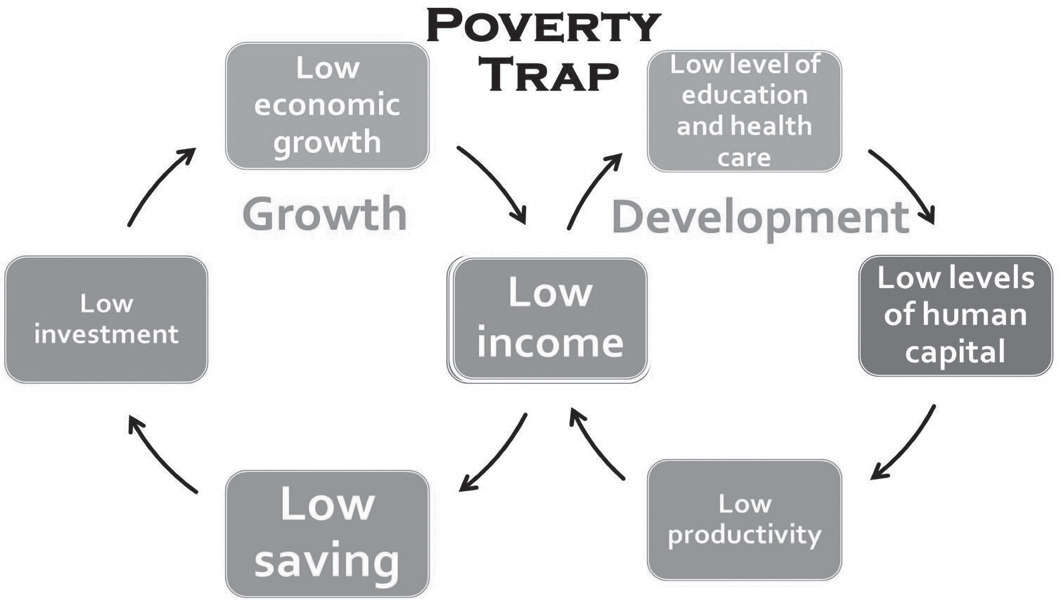
Figure: Concept of Poverty Trap
According to Nurkse and Kindleberger, the reasons for this vicious circle of poverty can be classified into three groups.
a) Supply side factors b) Demand side factors c) Market imperfection
Supply Side Factors
The supply side of the vicious circle indicates that in underdeveloped countries, productivity is so low that it is not enough for capital formation.
According to Samuelson, “The backward nations cannot get their heads above water because their production is so low that they can spare nothing for capital formation by which their standard of living could be raised.”
According to Nurkse, on the supply side there is small capacity to save, resulting from low level of national income. The low real income is the result of low productivity, which in turn, is largely due to the lack of capital. The lack of capital is a result of the small capacity to save, and so, the circle is vicious.
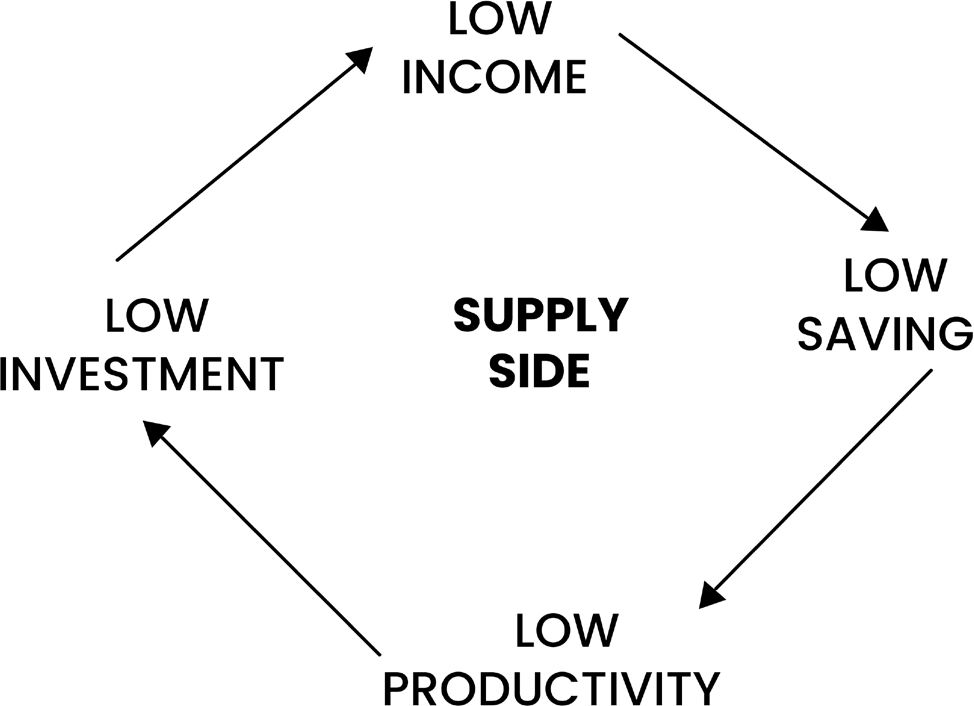
Figure: Supply Side Factors
Thus, it becomes clear from the above diagram that the main reason of poverty is the low level of saving. Consequently, investment is not possible in production channels. A huge chunk of GDP is used for consumption purposes. People cannot save.
So, there is lack of investment and capital formation. Although rich people can save, they spend their surplus in some on luxurious goods instead of saving. They gave preference to high priced items and foreign products. Thus, their demand does not enlarge the size of the market. The developing countries, therefore, lack investment facilities.
Demand Side Factors
According to Nurkse, poverty is caused by several factors in the demand side. In underdeveloped countries the inducement to invest is low because of the low purchasing power of the people, which is due to their small real income. It is illustrated in the following diagram
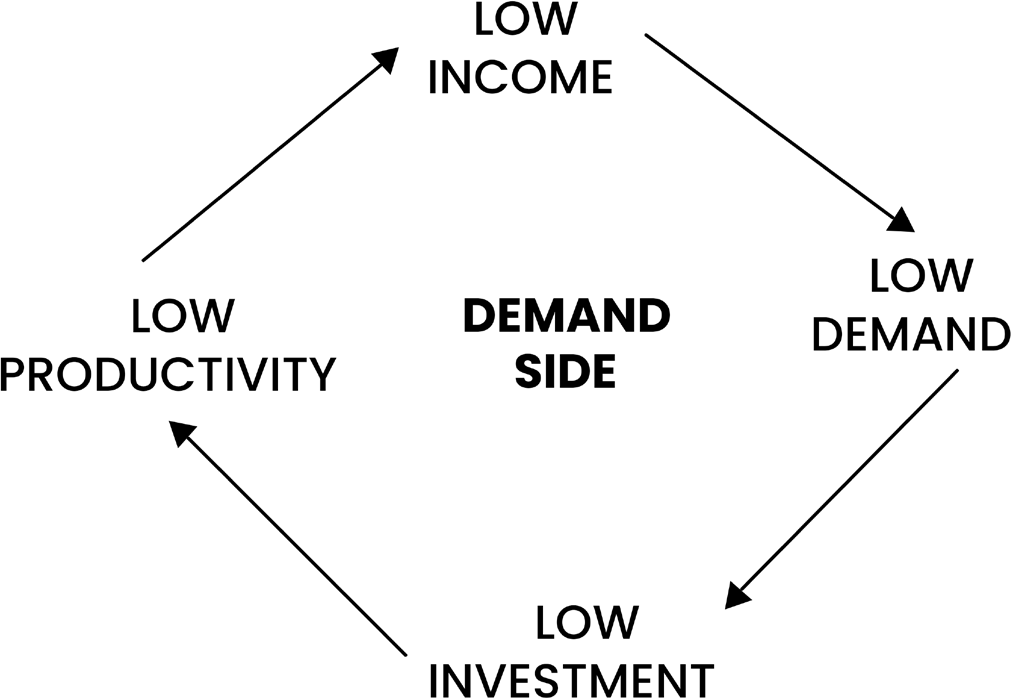
Figure: Demand Side Factors
The main reason for poverty in these countries is the low level of demand. Consequently, the sizes of markets remain low. The small size of the market becomes a hurdle in the path of inducement to invest.
Market Imperfections
According to Meier and Baldwin, the existence of market imperfections prevents optimum allocation and utilization of natural resources, and the result is underdevelopment, and this, in turn, leads to poverty.
The development of natural resources depends upon the character of human resources. But due to lack of skill and low level of knowledge, natural resources remain unutilized, underutilised and misused.
Goal 1 of the 17 Sustainable Development Goals is “Ending poverty in all forms, everywhere”. However, this is not a
standalone goal, since poverty is a result of deprivation, and can be eradicated only by removing that deprivation
Hunger and Relationship Between Poverty and Hunger
What is Hunger?
In context of poverty, hunger is the constant state of undernourishment. According to the Food and Agriculture Organization of the United Nations (FAO) ‘a person is undernourished when his or her regular food consumption is insufficient to provide the necessary
energy to live a normal, active and healthy life’. Hunger is the result of many factors i.e.,
Mismanagement of food production and distribution;
Poor accessibility;
Maldistribution of financial resources;
Unwise exploitation of natural resources;
Unsustainable patterns of consumption;
Environmental pollution;
Natural and human-made disasters;
Irrational population growth; and
Armed conflicts.
According to the Food and Agriculture Organization, as many as 828 million people are facing hunger in the world.
The Relationship between Poverty and Hunger:
Poverty and hunger continue to be among the most urgent and persistent threats to humanity, often preventing millions, especially children and young people, from fully engaging in society.
Extreme poverty is defined by an inability to meet basic needs such as food, shelter, and healthcare. This lack of resources leads to hunger, which in turn results in malnutrition.
Malnutrition refers to an imbalance, deficiency, or excess of essential nutrients, including both energy and micronutrients. It encompasses a wide range of conditions, from severe undernutrition to obesity.
Malnutrition negatively affects both the physical and mental well-being of individuals, reducing their ability to work and contribute to society. This, in turn, deepens poverty, creating a cycle where poverty leads to hunger, and hunger worsens poverty. Therefore, hunger and poverty are deeply interconnected, each reinforcing and
perpetuating the other.
Hunger produces conditions of poverty by reducing the economic potential of the population and likewise, poverty reinforces hunger by increasing the risk of food insecurity.
Therefore, Hunger and poverty are interconnected and both serve as the cause and consequence of each other.
The impact of poverty is seen in multiple manifestations which includes poor nutritional status, food insecurity, vulnerability to disease, reduced productivity levels, and compromised physical and intellectual development.
Growing Divergence between Poverty and Hunger
There has been a phenomenon of rising divergence between calorie intake(hunger) and per capita consumption expenditure(poverty) in India. It implies that despite high income and calorie intake, the person may be hungry (hidden hunger) and despite no hunger, the person may be poor in many other aspects.
Major Reasons include:
• Dispossession and Displacement: Loosing assets to government or private sector through land acquisition, especially in forest and tribal areas leading to loss of access to common property resources. Despite compensation and having food to eat, such people may become poor in cultural, aesthetic and spiritual manner.
• Rising Migration: Rural to Urban migration in search of employment and better life opportunities cause a loss of access to non-market food items like forest produce and source of essential nutrients.
• Declining public expenditure on social sector: Recent cut on Health budget in 2023 and Education budget in 2021 is forcing the poor towards high out of
pocket expenditure on these non- food essential items
in private sector reducing their food expenditure.
• Dominance of Carbohydrates and Fats: Dominance of cereals like Rice and Wheat in the quota of ration through Public Distribution System (PDS) has created hidden hunger of micronutrients among the population. Similar pressure has arose due to vast availability of cheap fatty oily processed food like burger and pizza etc. in the diet of the youth and children. This shows that non-poor are becoming hungry. However, non-communicable diseases like diabetes, liver disease, heart disease etc. caused due to this hidden hunger and malnutrition later make them poor due to high out of pocket expenditure in their treatment.
• High Food Prices: High inflation makes even Above Poverty Line (APL) population to go hungry at times or are forced to spend more and become Below Poverty Line (BPL).
History of poverty and hunger in India: the colonial inheritance
It is said that ‘India has Islands of Prosperity in the Ocean of Poverty’.
Immediately before the advent of Europeans, India was one of the richest countries in the world with one of the largest shares in the global trade. During 16th century, India accounted for 24% of the global wealth.
The British government introduced an economic model that was based on systematic loot, plunder and sub- ordination. It is said that money for industrial revolution in Britain was supplied by economic exploitation of India.
The colonial rule destroyed the agrarian sector by implementing distorted revenue policies, which made agriculture an unprofitable enterprise in India. Besides it ruined the local handicraft industry which pushed millions of people into abject poverty.
By the time India became independent, long history of colonial rule had completely ruined Indian economy and converted it into one of the poorest nations with extreme poverty and deprivation.
Factors Responsible for Poverty and Hunger in India
Factors responsible for Poverty and Hunger in India: Factors of Poverty
Poverty is the outcome of the interaction of range of factors.
The factors may be historical, social, cultural, economic, political and geographical and host of other factors.
Historical factors: Historical factors could be one of the prime reasons for poverty. For example, most of the African Countries have been subjugated and exploited by the imperial powers for centuries that explains the backwardness of the region.
India is one of the best examples of historical legacy of exploitation. When the imperial powers entered India, it was the second largest economy of the world after China, but at the eve of independence it was one of the poorest nations.
Social factor: In India, poverty and hunger is not uniformly distributed across the country rather it is concentrated in few pockets.
The caste dimension of poverty had historically remained unchanged, where majority of the poor and vulnerable belongs to SC/ST community that too from the rural areas. The tribal communities predominantly constitute the disadvantage and deprived social groups in India.
Besides caste, gender discrimination, racial discrimination are certain other social factors responsible for poverty. Also factors like marriage at early age, divorce, dowry, laws of inheritance, old age and social restriction etc. could also lead to poverty.
Economic factors: Money is the primary driving force that pushes someone into poverty. Food insecurity, unemployment, poor infrastructure, physical disability, lack of food and water, high cost of living, lack of investment or resources, unequal distribution of assets etc. are the some of the economic factors. High out - of - pocket expenditure on health, low productivity at work, high prevalence of
various diseases, lack of sanitation and chronic nutritional insecurity have cyclical impact on poverty.
Political factor: Political factors behind poverty includes conflict, war, corruption, injustice, discrimination, lack of proper implementation of public policies etc.
Geographical factor: The geographical factors that could lead to poverty includes extreme climate, natural calamities, depletion of resources, climate change, regional disparities, migration from rural to urban areas, overpopulation etc.
Factors of Hunger
• Every year, 5.8 million children die from hunger related-causes around the world (FAO Hunger Report 2008). This clearly highlights the urgency and extent of problem of global hunger.
• Hunger is the condition where both adults and children cannot access food constantly and have to decrease food intake, eat poor diets, and often go without any food. (Dillon and Marquand, 2011).
• According to Dr Amartya Sen, the main cause for hunger is the lack of ability to pay for food.
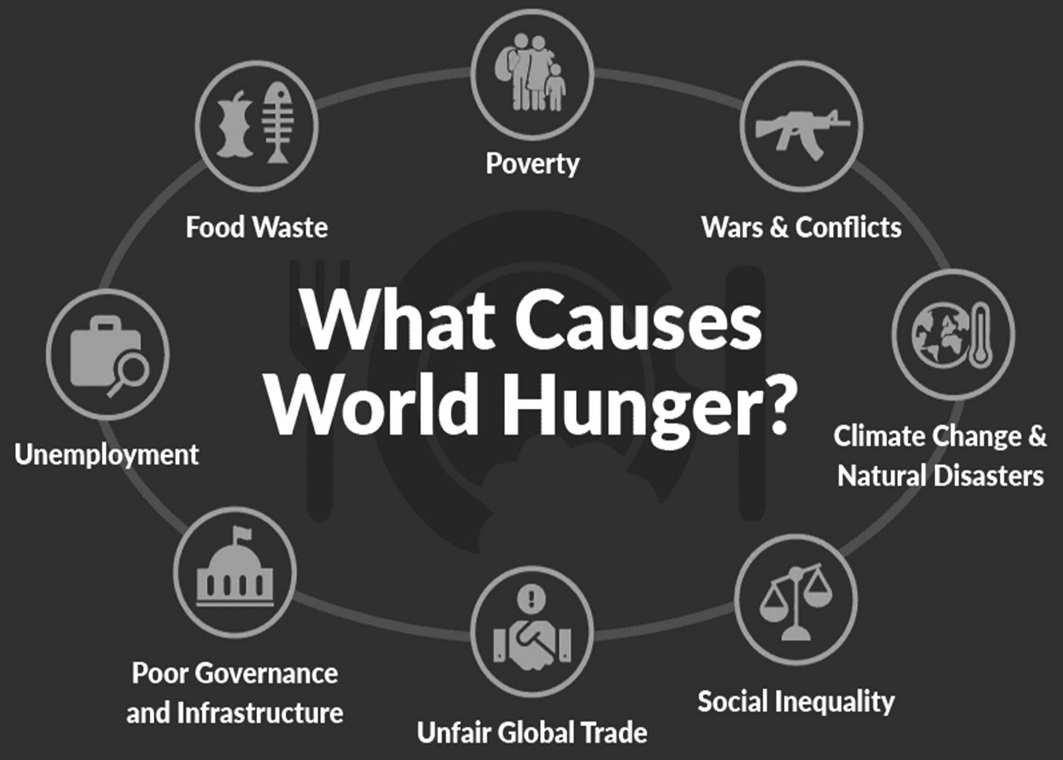
Figure: What Causes World Hunger?
• Poverty: It causes people to go to bed without regular meals because of unaffordability. Its manifestations include hunger and malnutrition, limited access to education and other basic services, social discrimination and elimination as well as the lack of participation in decision-making and lack of sustainable livelihoods.
Social:
• Social Inequality: Inequality, whether it is class-based, racial or gender inequality, has a massive effect on hunger. Just one 1% of the global population owns half of the world’s wealth. Even in the share of food, women and girls make up 60% of all food-insecure people in the world, and over 70% of people suffering from chronic hunger.
• Food Wastage: There are desperately hungry people in the world, yet one-third of all food that is produced is never even consumed - that’s 1.3 billion tonnes of wasted food every year. Wasting food also wastes natural resources.
• Wars and conflicts: As conflict breaks out in an area, many farmers must flee their land and can no longer harvest their crops. People who are displaced have few or no possessions, no money to buy food. Recent Ukraine and Sudan crisis indicate that.
Economic:
• Lack of Infrastructure: Roads and irrigation tanks, if lacking, then food can therefore not be accessed, and crops drown or fail to grow - all leading to scarce supplies and a more expensive product. The lack of security in an area also negatively affects trade.
• Unfair Global Trade: Unfair trade agreements, subsidies and bilateral deals create better market access and prices for developed nations. Unfair trade agreements mean food prices are higher in developing countries, and food distribution is unfair. Both of these factors increase food insecurity, by making food less accessible.
• Unemployment: When someone loses their job or is not paid enough money to cover their bills, they can be plunged into poverty and hunger as a result. In America, as many people lost their jobs due to the
pandemic, food bank use rose by 60% during 2020.
Political/Administrative:
• Poor Implementation: Leakages in schemes like Targeted Public Distribution System (TPDS) and problematic delivery through biometric authentication caused problem of hunger as well. In 2017, hunger death of a girl in Jharkhand exemplified that.
• Poor Governance: Land grabbing preys on smallholder farmers who may have farmed a piece of land for generations, but with no legal documentation, governments and big companies take this land by force, leaving people with no source of income or food. Currently, 33 million people across the globe have lost their means of sustenance through land grabbing from large foreign investors and corporations. Odisha’s Niyamgiri Hills case of 2007 is a fine example.
Similar incidents are still happening in states like Chhattisgarh, Odisha, Maharashtra, Andhra Pradesh, Himachal Pradesh, Telangana, Uttar Pradesh and Karnataka.
Environmental/Geographical:
• Extreme Events: Natural Disaster is a natural event that causes a significant amount of damage or even a loss of life, like floods, droughts, and hurricanes. These extreme conditions, otherwise known as
climate shocks, lead directly to hunger crises on a massive scale, obliterate harvests for hundreds of miles, destroy herds of cattle in one moment.
• Pandemics and diseases: Recent Coronavirus pandemic 2020-2021 caused nationwide lockdown which led to enormous hunger and food insecurity among the poorest of the poor especially the migrant workforce causing loss of life and property.
• Remoteness: Hilly and border areas like Ladakh, remote forests in Chhattisgarh and Jharkhand, Thar desert of Rajasthan, Rann of Kutch etc may also contribute to chronic hunger.
Post-independence Scenario of Hunger and Poverty
Post-Independence scenario of Hunger and Poverty
At the time of independence, the incidence of poverty in India was about 80% or about 250 million. In 1947, agriculture accounted for 54% of India’s GDP and 60% of the population depended on agriculture for a living.
Five Year Plan efforts in reducing poverty
In 1947, India was characterized with widespread poverty, mass illiteracy, low level of production. Therefore, immediately after the independence, the Five-Year Plans were launched for better utilization of the country’s resources in development efforts.
The First Five Year Plan (1951-56) stated that “the central objective of planning in India is to raise the standard of living of the people. It invested 44% of the budget in rural development and social welfare. The primary focus was on agriculture and irrigation.
The Second plan focussed on basic and heavy industries that increased the national income by 25% and generated employment to some extent.
The Third plan saw two wars and severe drought that hampered the poverty alleviation efforts of the government. However, successive five-year plans continued to emphasize poverty eradication as one of the key objectives.
The Fifth Five Year Plan (1974-1979) with the call of ‘Garibi Hatao’ mainly focused on the removal of poverty and aimed at bringing larger sections of the poor masses above the poverty line.
The fifth plan also assured a minimum income of Rs. 40 per person per month calculated at 1972-73 prices. The plan was terminated in 1978 when the Janata Government came to power.
Removal of poverty was the main objective of the Sixth five-year plan (1980-85) with a major focus on economic growth, elimination of unemployment, self-sufficiency in technology, and raising the lifestyles of the weaker sections of the society.
Similarly, the Seventh Five Year Plan aimed at improving the living standards of the poor with a significant reduction in the incidence of poverty.
The Tenth five-year plan aimed at the reduction of the poverty ratio from 26 per cent to 21 per cent by the year 2007 and also to help the children in completing five years of schooling by 2007.
Incidence and Intensity of Poverty and Hunger In India
The last official estimate of Poverty in 2011-12 was released by Planning Commission at 21.92%, which was estimated using Tendulkar Committee approach. The SDG India 2019 Report by Niti Ayog also mentions Tendulkar Poverty Line for 2011-12. For rural areas, the national poverty line using the Tendulkar methodology is estimated at Rs. 816 per capita per month (Rs. 27 per person per day) and Rs. 1,000 per capita per month (Rs 33 per person per day) in urban areas.
The World Bank has classified India as a lower middle- income country and the corresponding poverty line would be PPP $3.2 (2011 prices), which translates into roughly a consumption level of Rs 75 per person per day.
However, global evidence indicates that India is on track to achieve the fastest pace of poverty reduction and meeting its poverty elimination goals by 2030.
State of Urban and Rural Poverty in India
Urban poverty in India is over 25 percent; with more than 80 million people living in urban areas on incomes that are below the poverty line.
There is general consensus that majority of India’s poor are in rural but urban and rural poverty are intimately connected. With growth of Indian economy and fast paced urbanization, the urban growth is a result of population shift from poverty-stricken hinterland to the cities, especially urban slums.
The major causes of Urban poverty are uncontrolled migration, lack of employment opportunities in rural areas, lack of investment, inadequate infrastructure, lack of affordable housing, etc.
In the semi-urban areas, poverty is associated with the process of conversion of agrarian land for commercial projects. This affects patterns of labour force participation, social change, waste generation, pollution and pressure on natural resource systems.
The cost of living in urban areas is comparatively high, therefore the migrant labourers and other informal employees find themselves trapped in the vicious cycle of urban poverty.
Therefore, Urban poverty causes various distinct challenges for housing, water, sanitation, health, education, social security, livelihoods and the special needs of vulnerable groups such as women, children and the aging.
Incidence and Intensity of Hunger in India
Over the last two decades, India has seen tremendous economic growth. Yet, despite being the fifth largest economy in the world, hunger in India is rampant.
In Global Hunger Index (GHI) 2024 by Concern Wildlife and Welthungerlife, India slipped to 105th position out of 127 countries, highlighting serious hunger crisis.
As per the recent report of NFHS-6 (2023-24), the nutrition indicators for children under 5 years in India has improved as compared with NFHS-5 (2019-21).
Stunting among children under five years declined
from 35.5% to 29.3%.
Severe wasting declined from 7.7% to 5.2%.
Underweight prevalence declined from 32.1% to 31.8%.
Overweight children have reduced from 3.4% to 1.3%.
As per the recent report of National Family Health Survey-5 (2019-21)
Anaemia: The incidence of anaemia in under-5 children (from 58.6 to 67%), women (53.1 to 57%) and men (22.7 to 25%) has worsened in all States of India (20%-40% incidence is considered moderate). Barring Kerala (at 39.4%), all States are in the “severe” category(>40%).
Of the 1.3 billion living in India, over 194 million people, or 14.5%, are undernourished. This crisis is a severe problem throughout India, and is difficult to address for a variety of reasons including widespread poverty and lack of access to food.
In the face of these factors, rural areas in India tend to struggle the most. This especially impacts children in these areas. More than 20.8% of children under 5 in India are underweight and 37.9% have had their growth stunted.
Food and Agriculture Report, 2018 stated that India houses 195.9 million, accounting for about a quarter of the world’s hungry. Prevalence of undernourishment in India is 14.8%, higher than both the global and Asian average.
It had been reported in 2017 by the National Health Survey that approximately 19 crore people were compelled to sleep on an empty stomach every night.
Moreover, the most alarming figure revealed is that approximately 4500 children die every day under the age of five years in the country due to hunger and malnutrition, amounting to over three lakh deaths every year, owing to hunger, of children alone.
A National Sample Survey report indicated about 5% of the total population in India sleeps without two square meals a day. This section of the population could be called “hungry”.
Measurement of Poverty and Hunger
Measurement of Poverty and Hunger
1. Global measures to estimate poverty:
The United Nations Global Multidimensional Poverty Index (MPI):
Launched in 2010 by the United Nations Development Program (UNDP) and the Oxford Poverty and Human Development Initiative (OPHI), the MPI is a measure of multidimensional poverty covering more than 100 developing countries. It goes beyond income as the sole indicator for poverty and tracks deprivation across three dimensions and 10 indicators as indicated below:
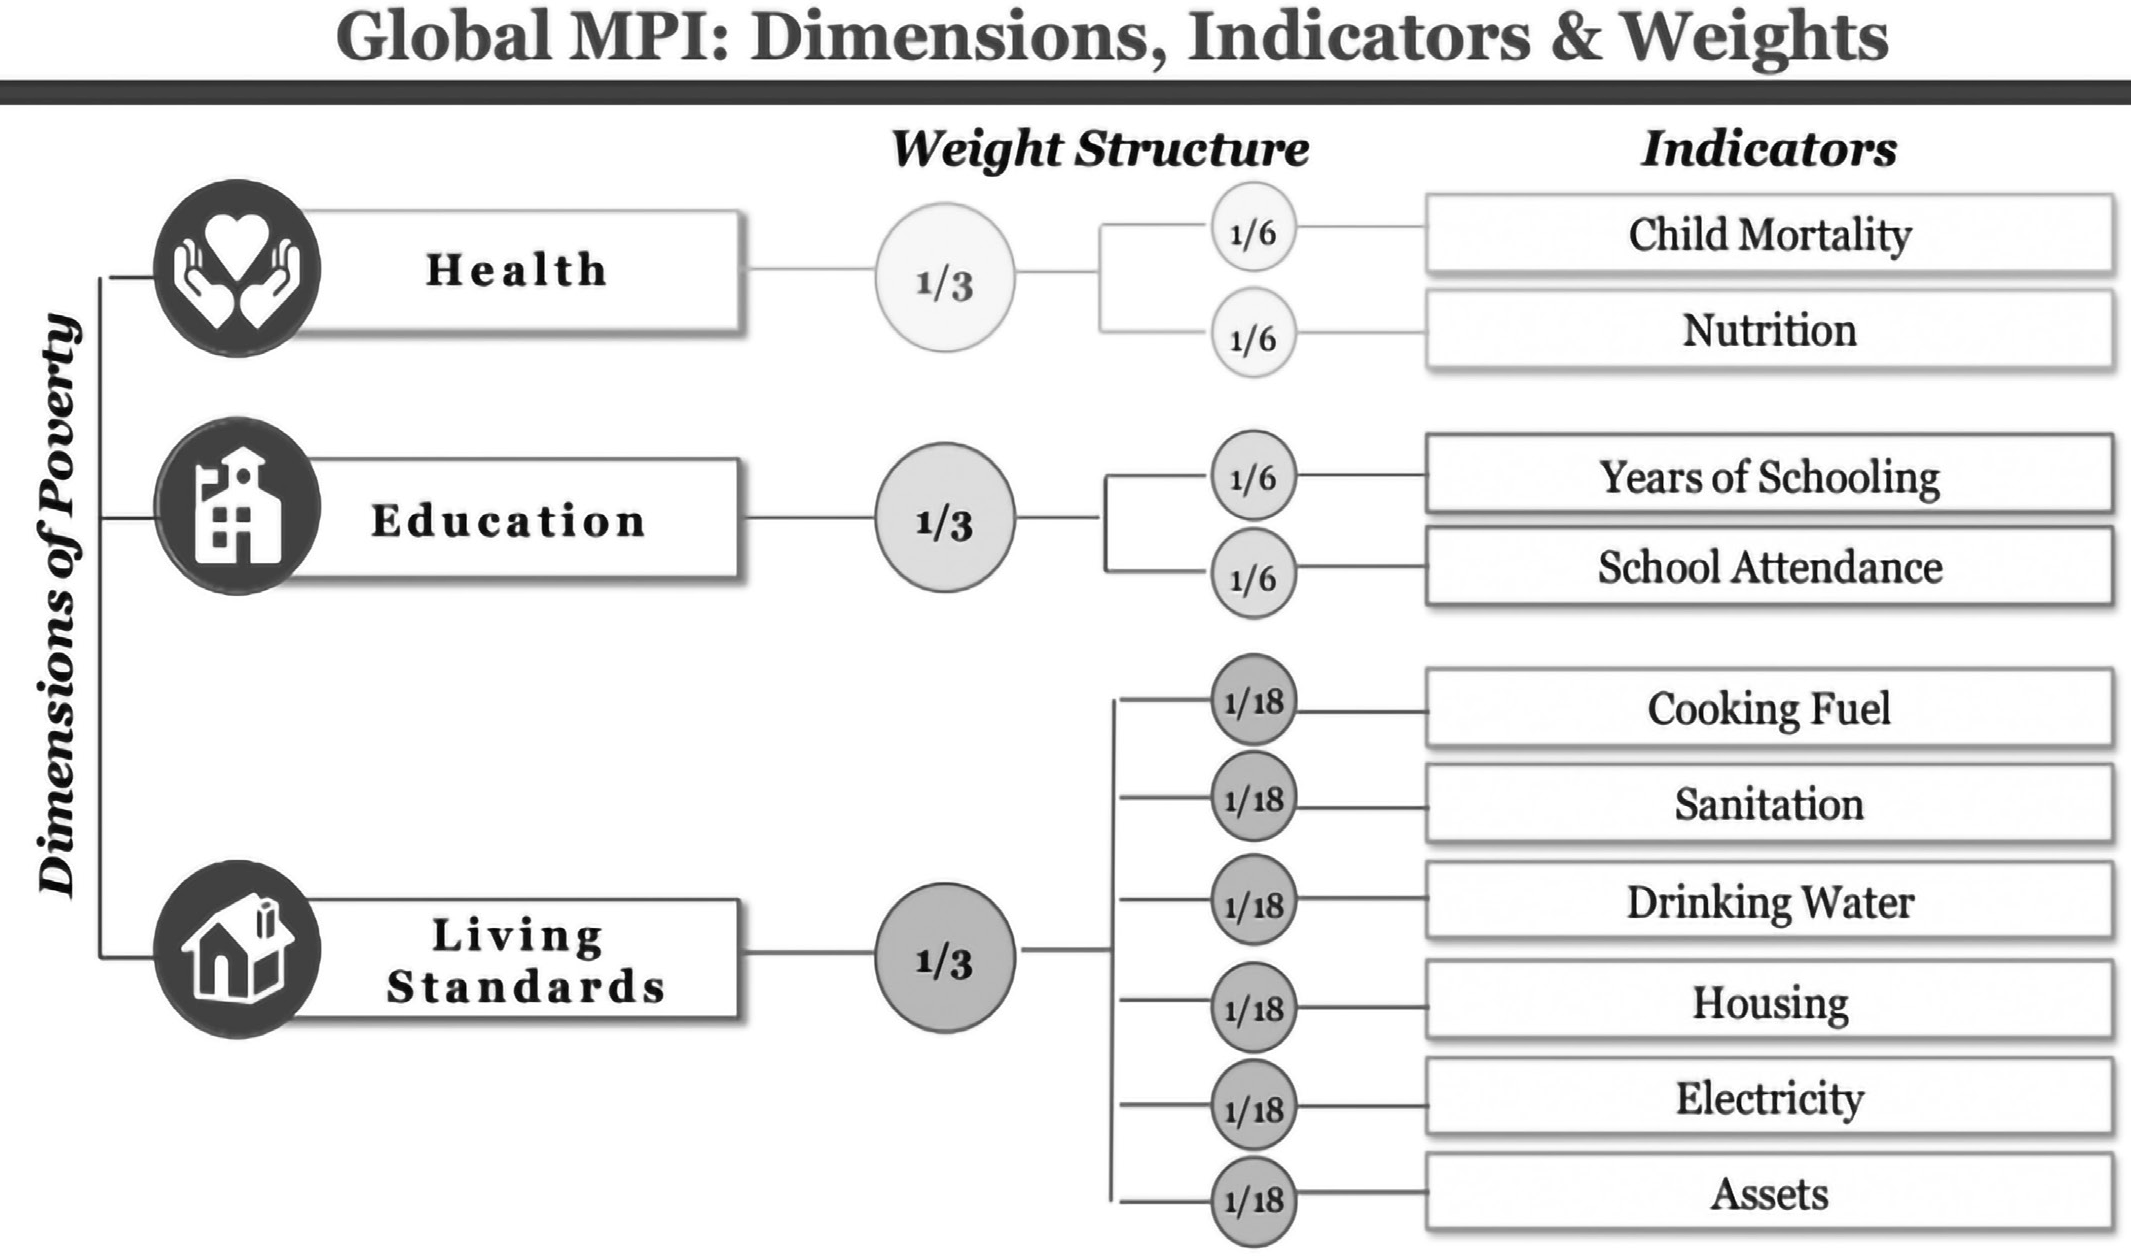
Figure: Global Multidimensional Poverty Index
A person is multi-dimensionally poor if she/he is deprived in one third or more of the weighted ten indicators. Those who are deprived in one half or more of the weighted indicators are considered living in extreme multidimensional poverty.
The MPI ranges from 0 to 1,higher values implying higher poverty. At present MPI is the most comprehensive measure of multidimensional poverty compared to the conventional methodology that measures poverty only in income or monetary terms.
Poverty Measurement in India
India has a long history of studies on measurement of poverty. The erstwhile Planning Commission was the nodal agency in India for estimation of poverty.
The estimation of poverty in India has been based on two critical components.
Consumption expenditures and its distribution
across households as provided by NSS.
• These expenditures by households are evaluated with
reference to a given poverty line.
Estimation of poverty line in India: During the Pre- Independence era ‘the Poverty and Unbritish Rule in India 1901’, ‘National Planning Committee 1938’ and ‘The Bombay Plan; 1944’ were the major efforts in estimation of poverty.
Post- Independence Poverty Estimation: Various expert groups constituted by the Planning Commission have estimated the number of people living in poverty in India.
• Working Group (1962): The poverty line in India was quantified for the first time in terms of minimum requirement (food and non-food) of individuals for healthy living. The Group formulated the separate poverty lines for rural and urban areas (₹20 and ₹25 per capita per month respectively in terms of 1960-61 prices) without any regional variation.
• VM Dandekar and N Rath (1971): They for the first time established the consumption levels required to meet a minimum calorie norm of 2,250 calories per capita per day. They made the first systematic assessment of
• Poverty in India, based on National Sample Survey (NSS) data: They found poverty lines to be Rs. 15 per capita per month for rural households and Rs. 22.5 per capita per month for urban households at 1960‐61 prices.
• Task Force on “Projections of Minimum Needs and Effective Consumption Demand” 1979: headed by Dr. Y. K. Alagh, the task force defined the per capita consumption expenditure level to meet average per
capita daily calorie requirement of 2400 kcal per capita per day in rural areas and 2100 kcal per capita per day in urban areas.
• Lakdawala Expert Group (1993): The Planning Commission constituted the Lakdawala Expert Group to “look into the methodology for estimation of poverty and to re-define the poverty line, if necessary”. It suggested to update methodology using the Consumer Price Index of Industrial Workers (CPI-IW) in urban areas and Consumer Price Index of Agricultural Labour (CPI-AL) in rural areas rather than using National Accounts Statistics.
• Tendulkar Expert Group (2009): The Tendulkar group did not construct a poverty line and adopted the officially measured urban poverty line of 2004-05 (25.7%) based on Lakdawala methodology. It recommended a shift away from basing the poverty lines from calorie norms. Secondly instead of two separate PLBs for rural and urban poverty lines, it recommended a uniform all-India urban PLB across rural and urban India. The national poverty line for 2011-12 was estimated at Rs. 816 per capita per month for rural areas and Rs. 1,000 per capita per month for urban area.
• Rangarajan Committee (2014): It recommended separate consumption baskets for rural and urban areas which include food items that ensure recommended calorie, protein & fat intake and non-food items like clothing, education, health, housing and transport.
NITI Aayog National Multidimensional Poverty Index
The National MPI Project is aimed at deconstructing the Global MPI and creating a customized India MPI for drawing up comprehensive Reform Action Plans with the larger goal of improving India’s position in the Global MPI rankings.
The National Multidimensional Poverty Index baseline Report is based on National Family Health Survey 4 (2015- 16).
The MPI seeks to measure poverty across its multiple dimensions and in effect complements existing poverty statistics based on per capita consumption expenditure. It has three equally weighted dimensions i.e., health, education, and standard of living, which in turn are represented by 12 indicators (more indicators than Global MPI).
According to the report Bihar has the highest proportion of people, at 51.91 per cent of the state’s population, who are multidimensionally poor, followed by Jharkhand at
42.16 per cent and Uttar Pradesh at 37.79 per cent.
Bihar also has the highest number of malnourished people followed by Jharkhand, Madhya Pradesh, Uttar Pradesh, and Chhattisgarh.
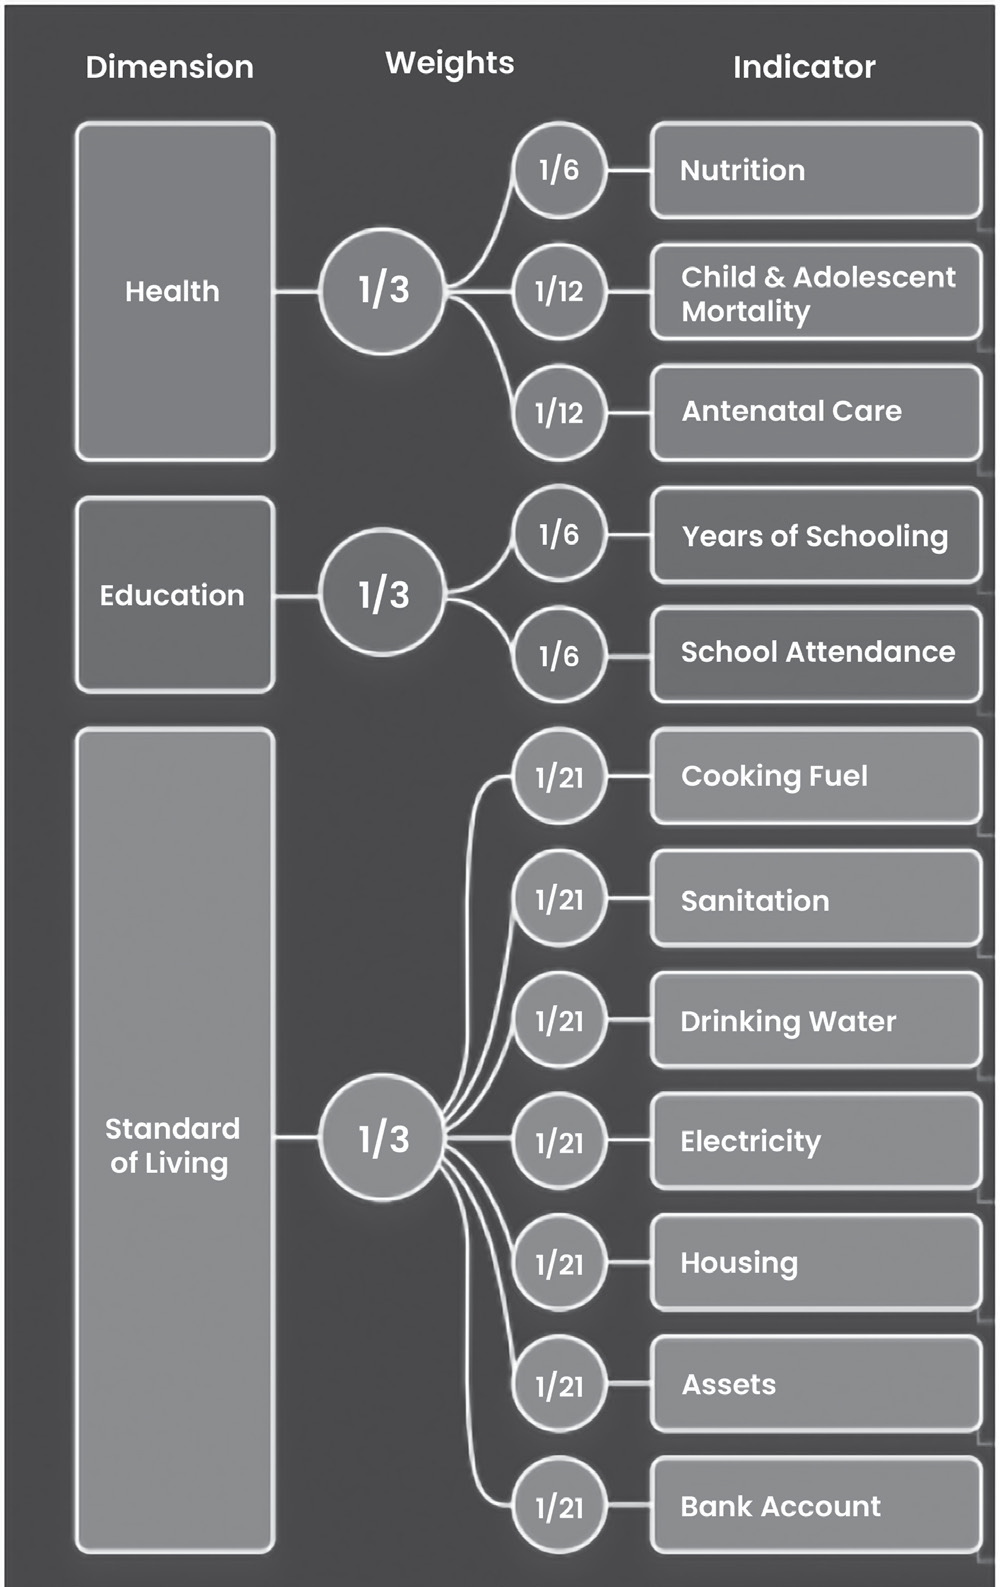
Figure: NITI Aayog MPI Indicators
Socio Economic and Caste Census (SECC) 2011:
Based on the recommendation of Saxena Committee, the Ministry of Rural Development Government of India, commenced the Socio Economic and Caste Census (SECC) 2011, in June 2011 through a comprehensive door to door enumeration across the country.
SECC-2011 is a study of socio-economic status of rural and urban households and allows ranking of households based on predefined parameters.
The objective of the SECC was not to replace the poverty line but to provide ‘information regarding the socio- economic condition, and education status of various castes and sections of the population’ and ‘enable households to be ranked on their socio-economic status’ to identify households that live below the poverty line.
Unlike BPL Censuses, SECC-2011 2011 allows for the first time to track the deprivation of households and address gaps effectively with focus on multi-dimensionality of poverty.
The Sumit Bose Committee (2017) recommended using SECC 2011 data to identify beneficiaries for all centrally sponsored, central and state government schemes as far as possible.
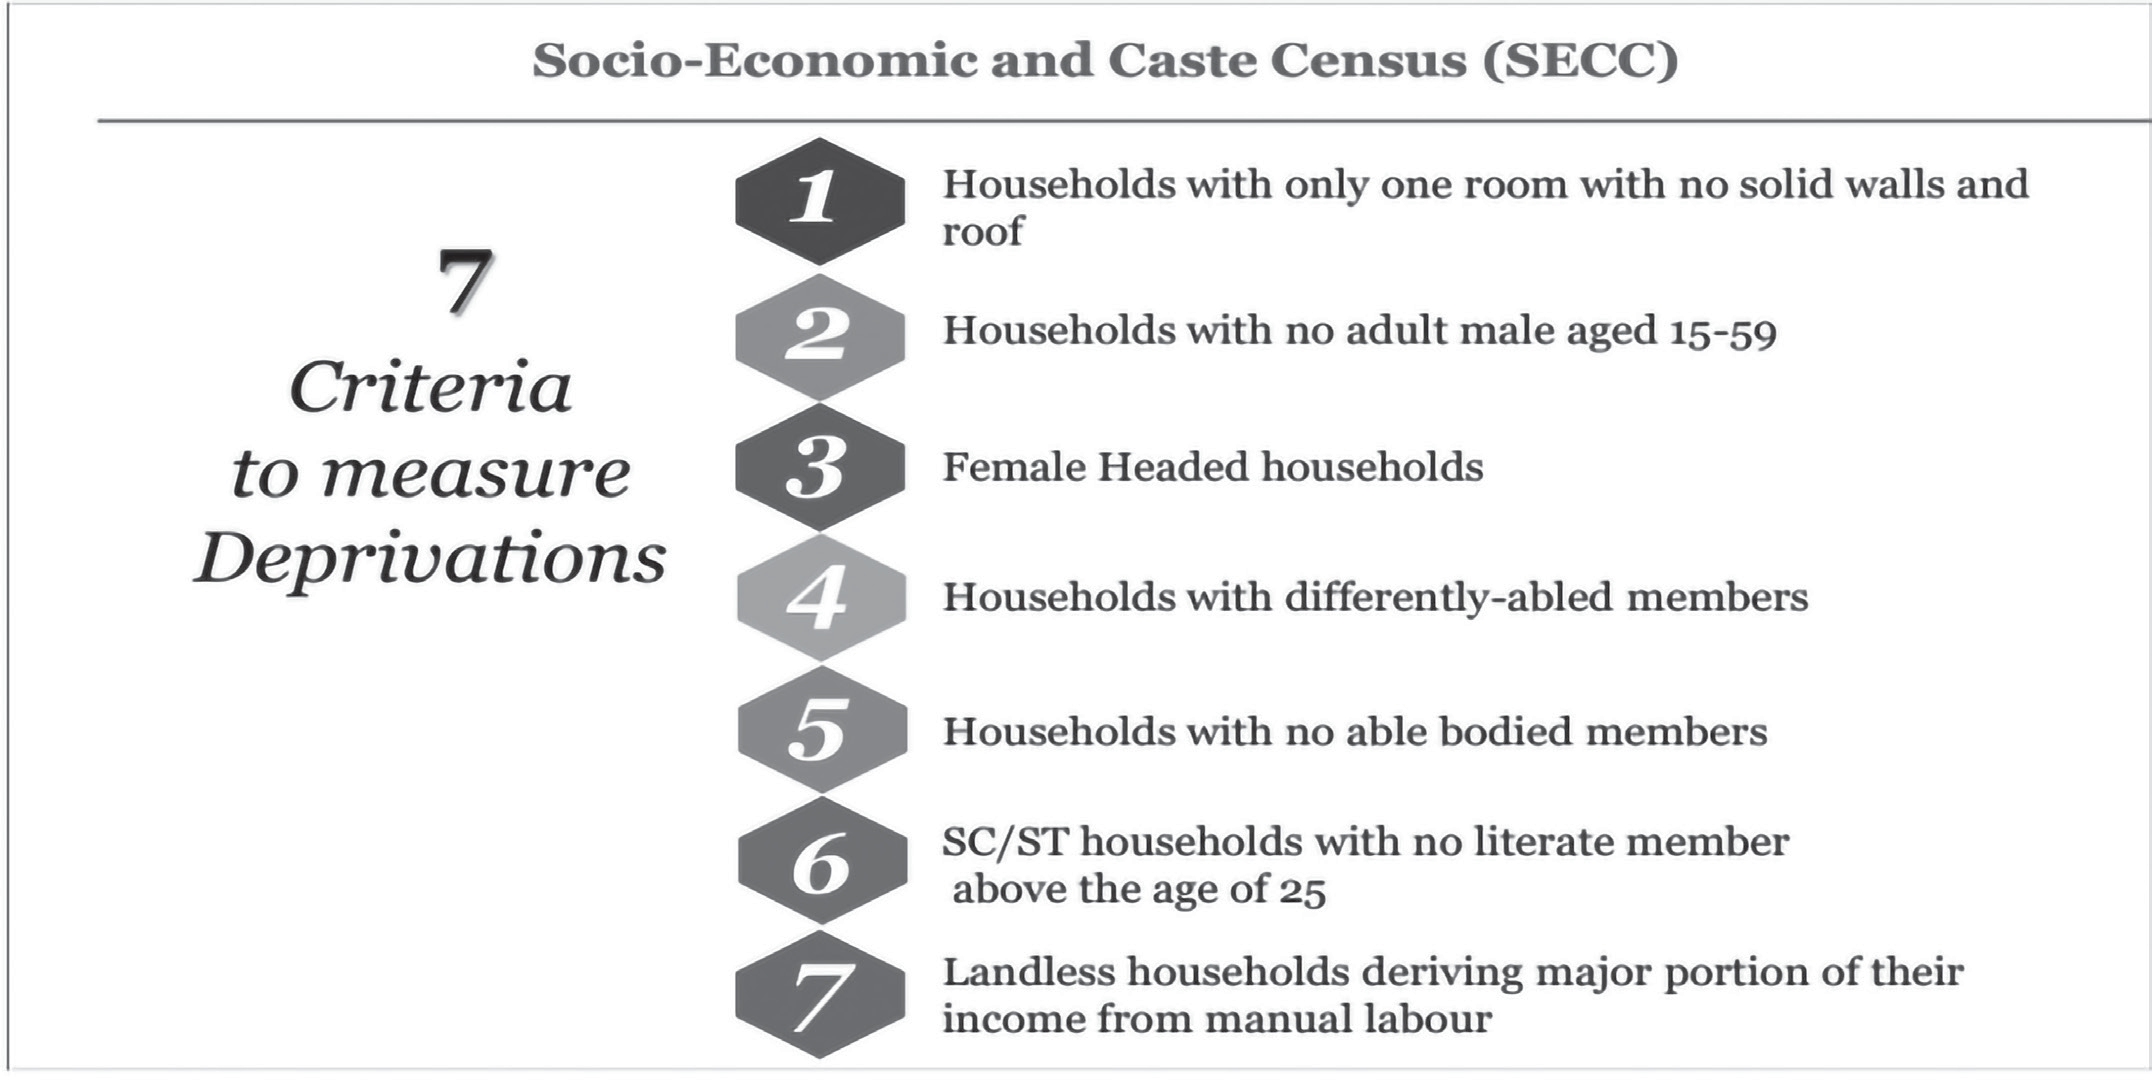
Figure: Criteria under Socio Economic and Caste Census
Deprivation Data of Rural India; SECC; 2011
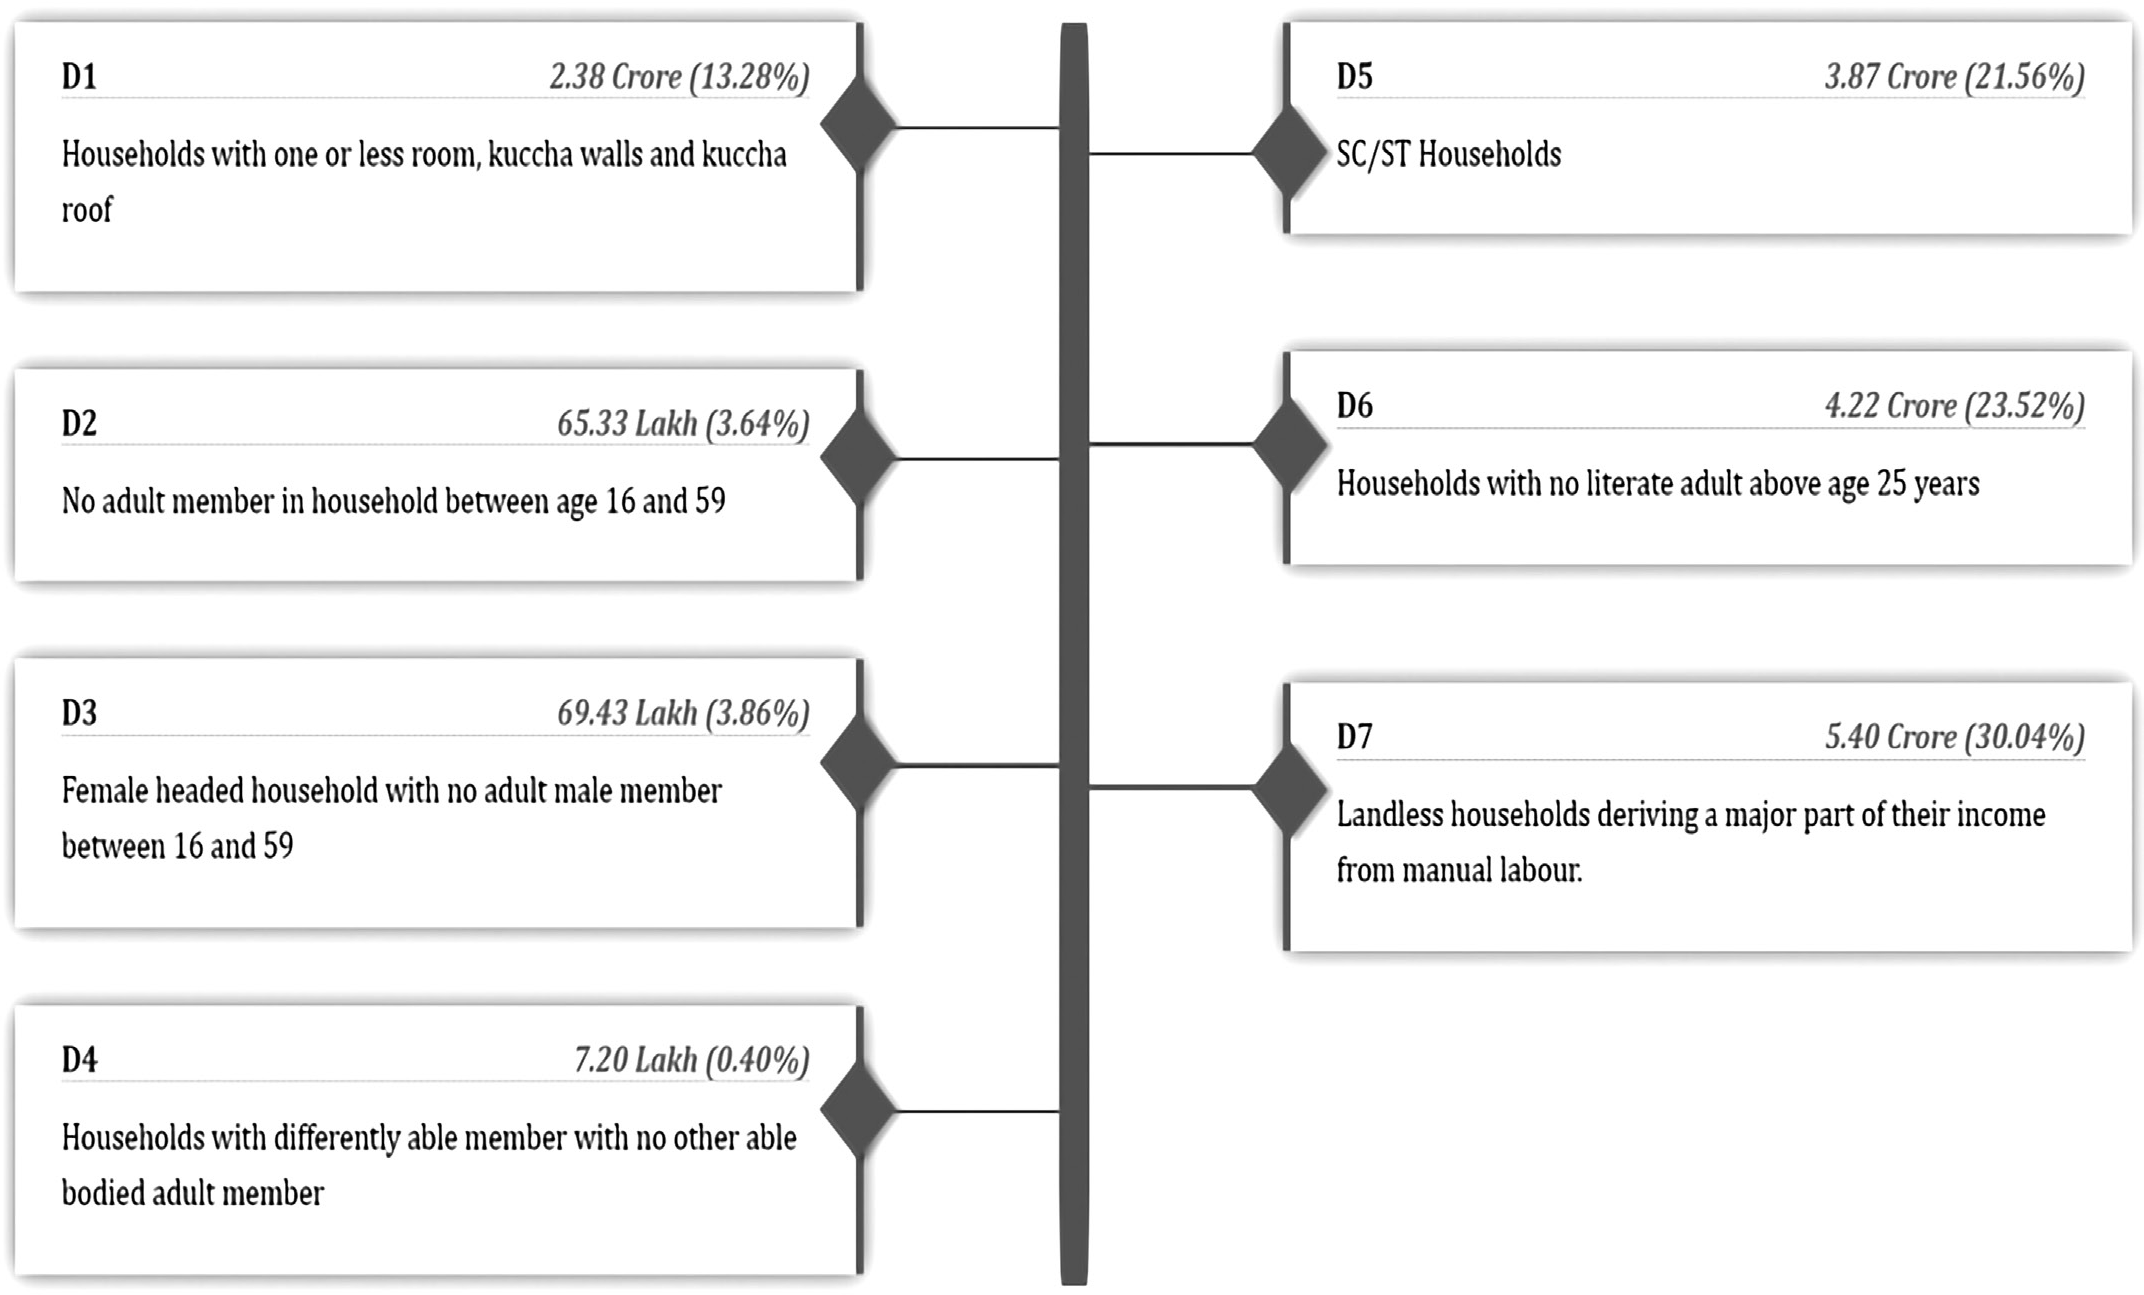
Figure: Deprivation Data of Rural India
Use of SECC data in the implementation of Government programmes allows for evidence based developmental interventions. The selection of beneficiaries gets validated through Gram Sabhas, while identity is established through Aadhaar.
This leads to selection of right beneficiaries and minimizes duplication and fraud. This has substantially enhanced the effectiveness of government's efforts to tackle multi-dimensional poverty, going beyond income or expenditure-based poverty.
Measures to Estimate Hunger
• At the international level:
• The Global Hunger Index (GHI) is a tool for comprehensively measuring and tracking hunger at global, regional, and national levels.
• GHI scores are based on the values of four component indicators:
• Undernourishment: share of the population with insufficient caloric intake.
• Child stunting: share of children under age five
who have low height for their age, reflecting chronic undernutrition.
• Child wasting: share of children under age five who have low weight for their height, reflecting acute undernutrition.
• Child mortality: share of children who die before their fifth birthday, reflecting in part the fatal mix of inadequate nutrition and unhealthy environments.
• The GHI score is calculated on a 100-point scale reflecting the severity of hunger - zero is the best score (implies no hunger) and 100 is the worst.
• The GHI is prepared by European NGOs of
Concern Worldwide and Welthungerhilfe.
• The GHI is an annual report and each set of GHI scores uses data from a 5-year period.
• In India:
• Malnutrition refers to deficiencies or excesses in nutrient intake, imbalance of essential nutrients or impaired nutrient utilization.
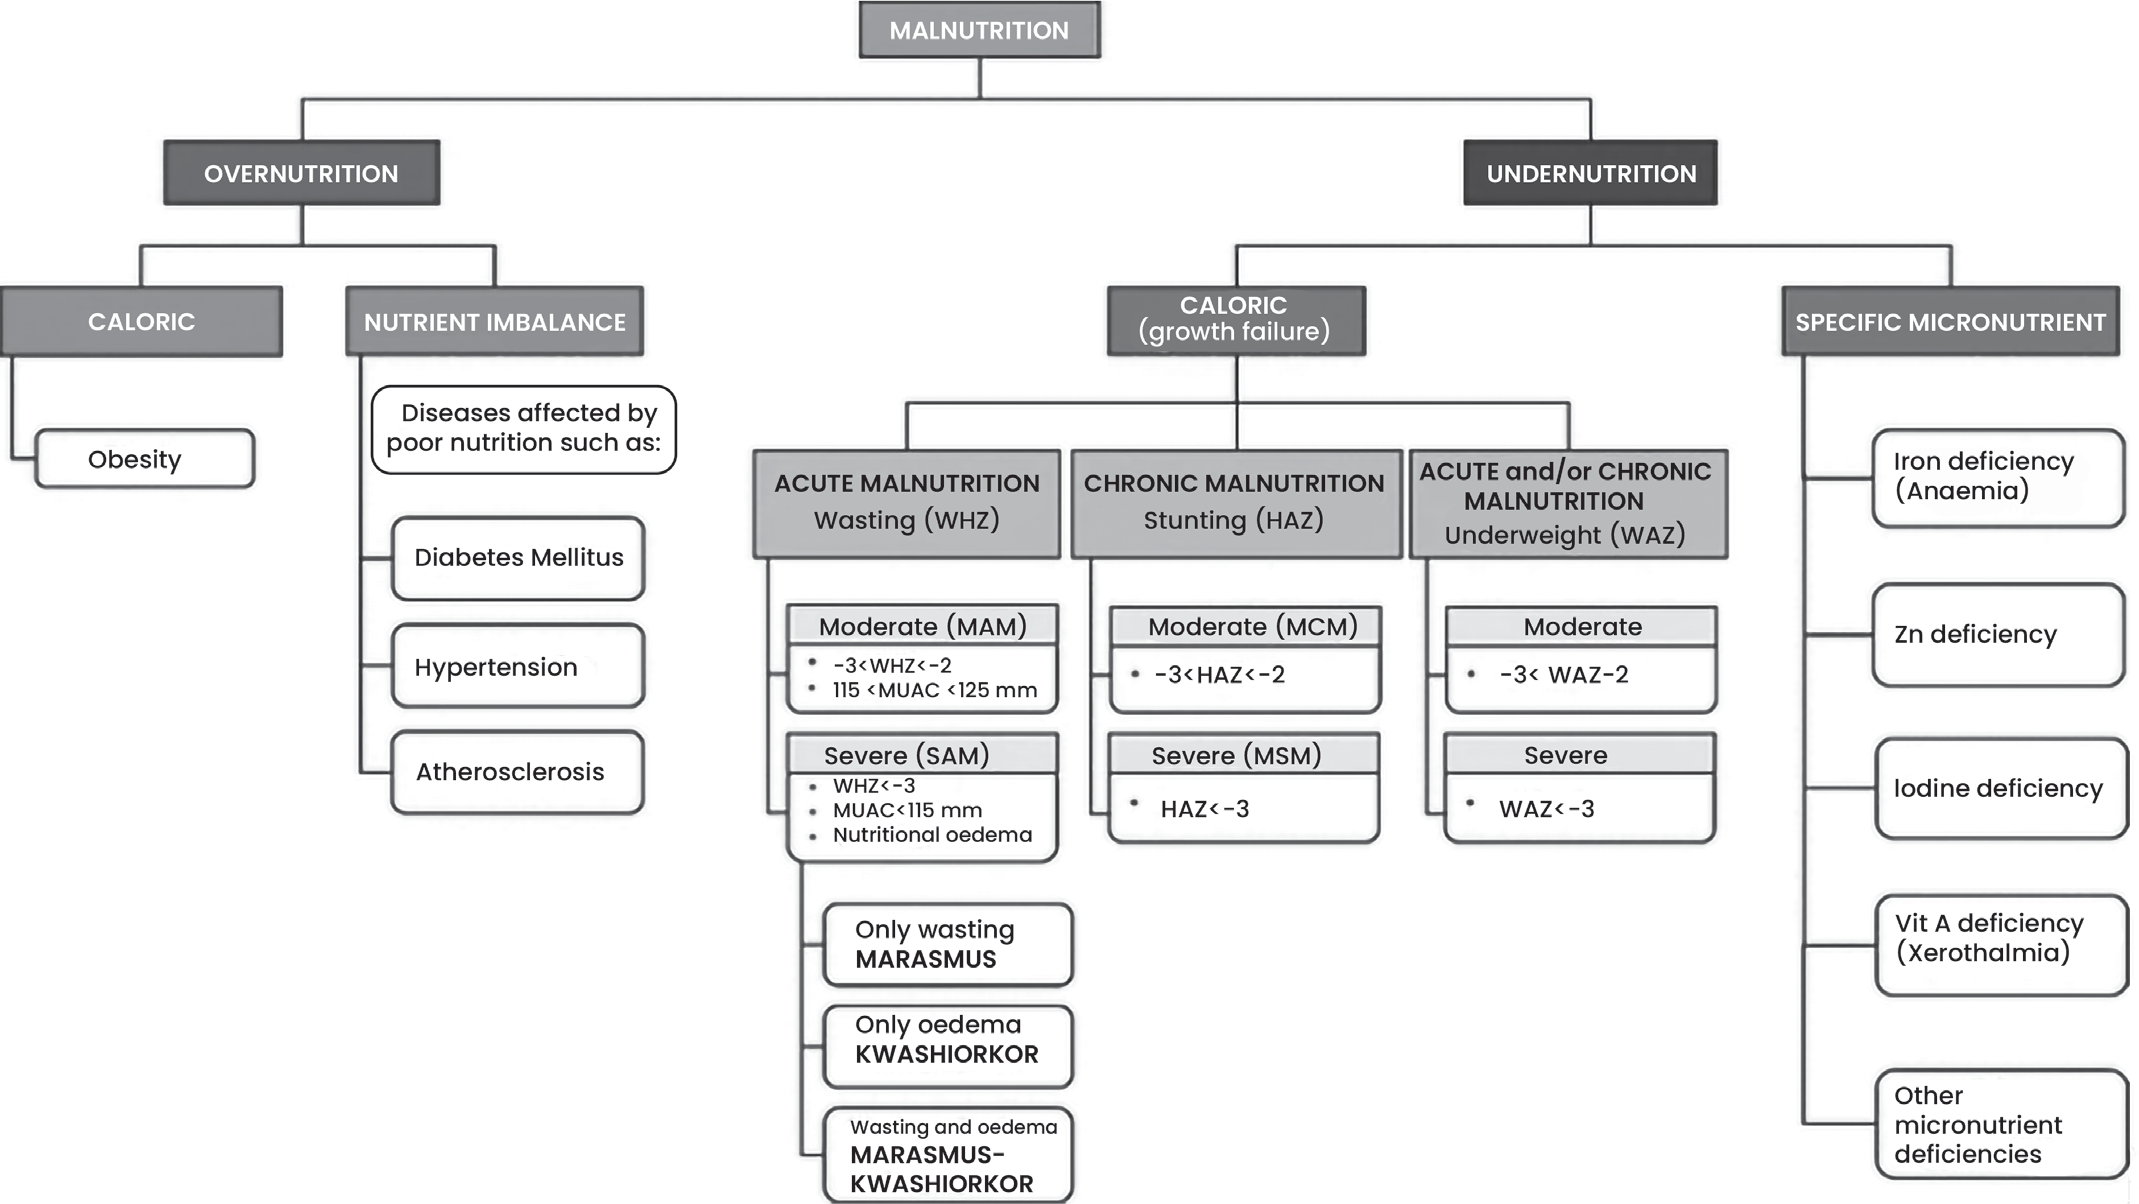
Figure: Classification of Malnutrition
• India faces Triple Burden of Malnutrition – Undernutrition, Hidden Hunger (Micronutrient Deficiency) and Overweight – threatens the survival, growth and development of children and young people, as well as diet-related noncommunicable diseases.
• Undernutrition manifests in four broad forms:
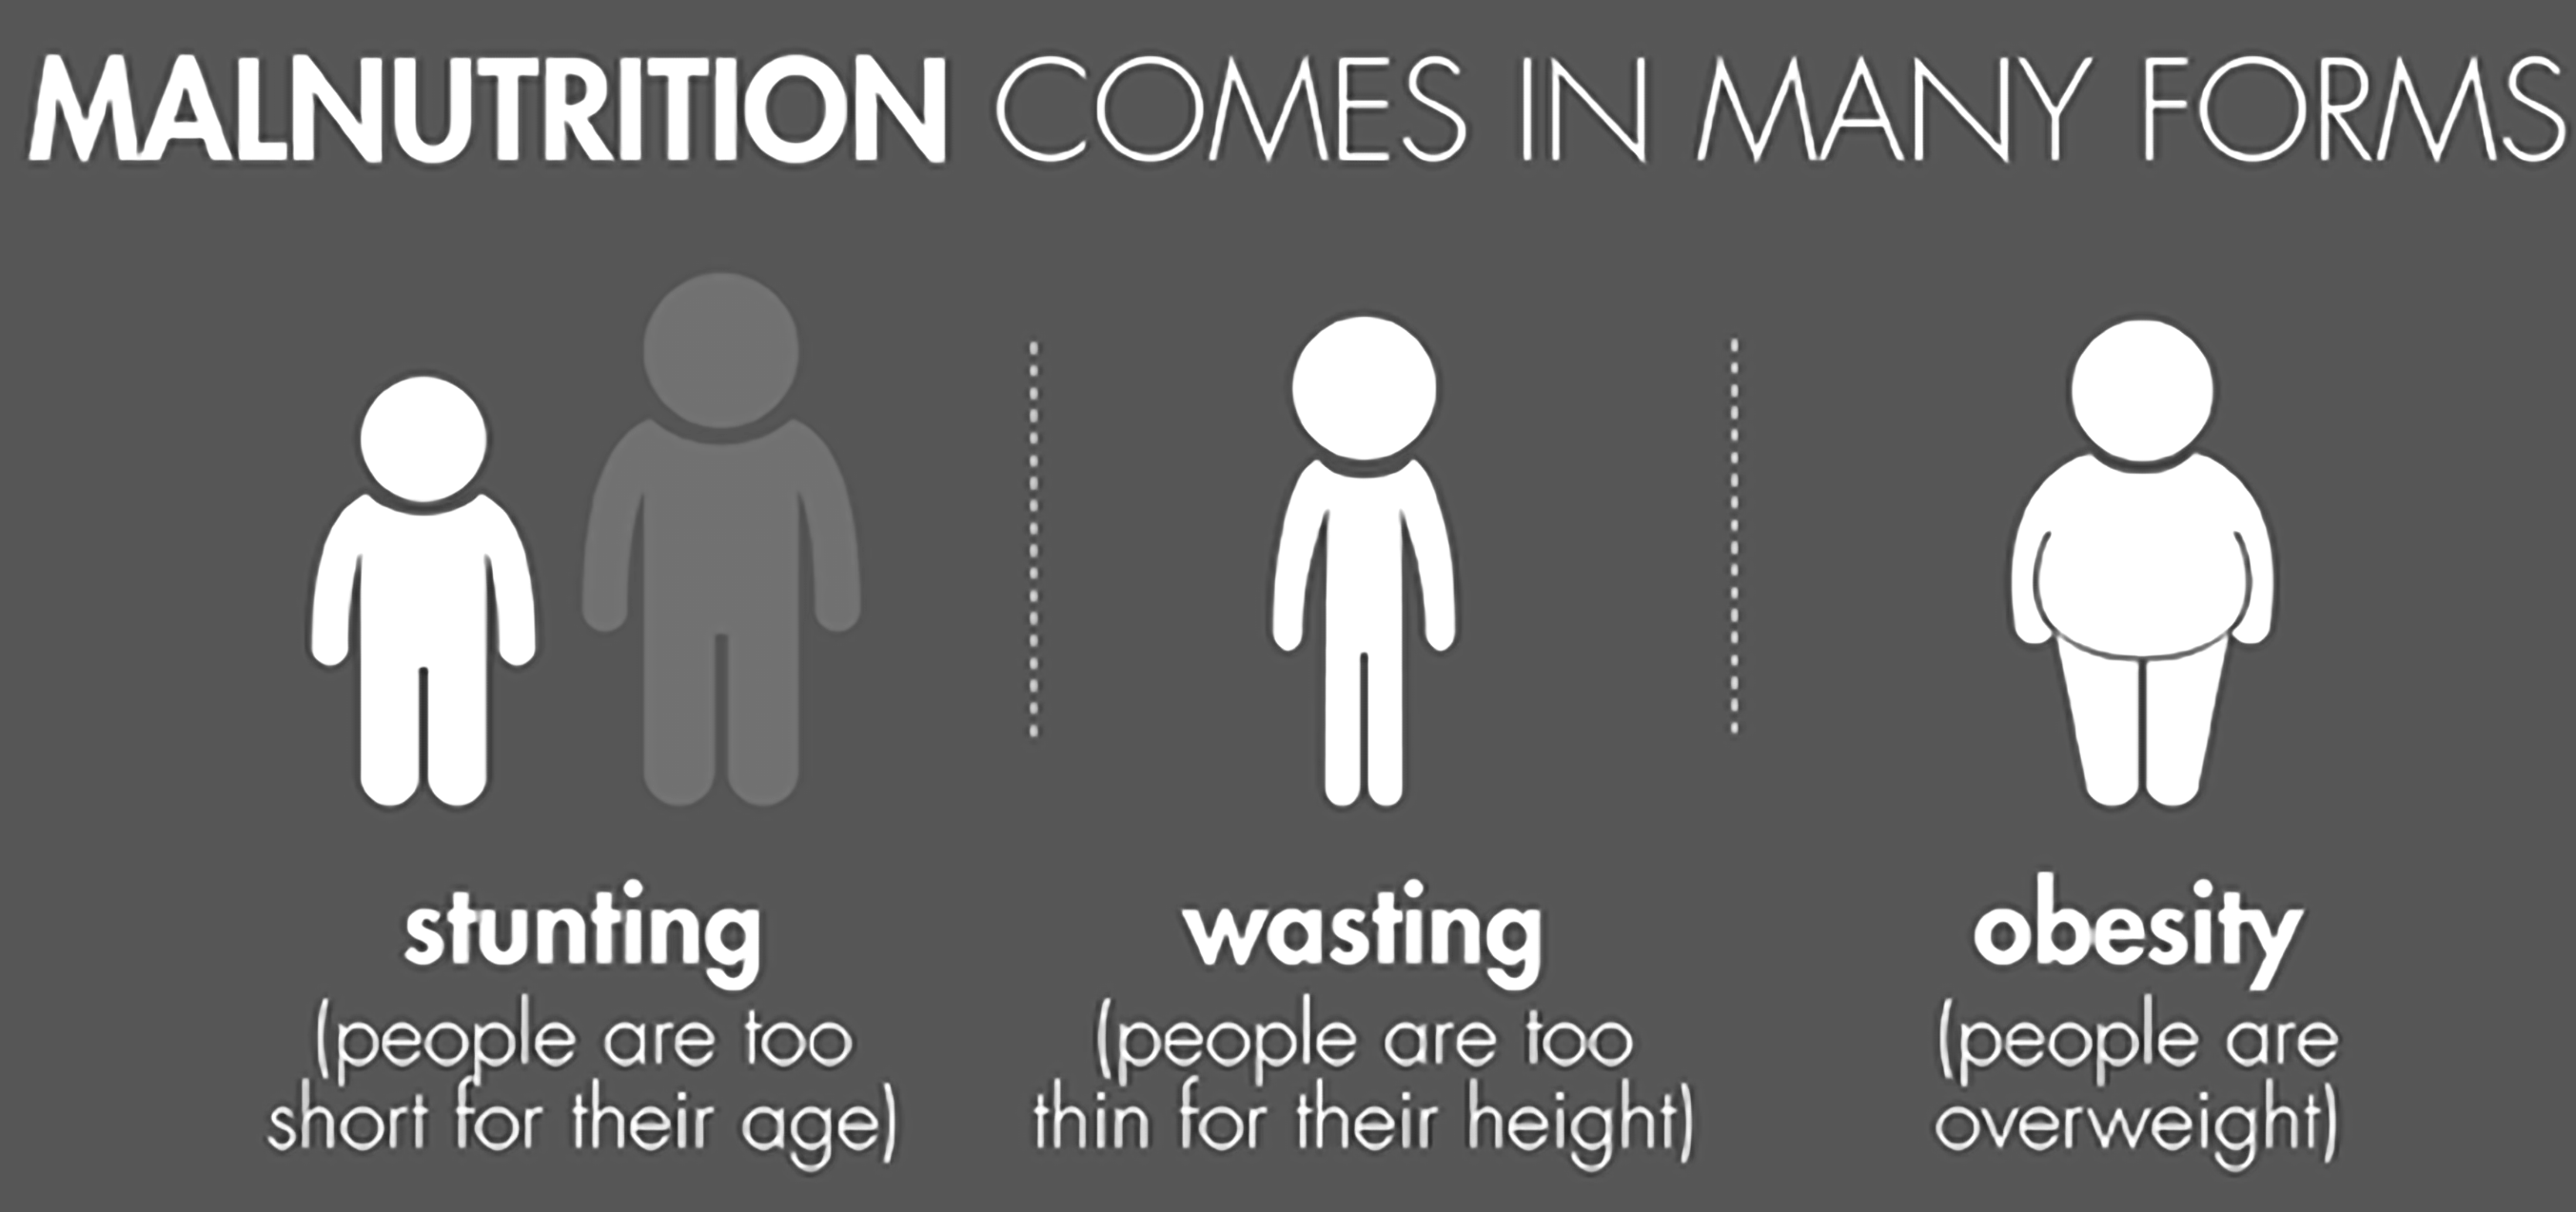
Figure: Forms of Malnutrition
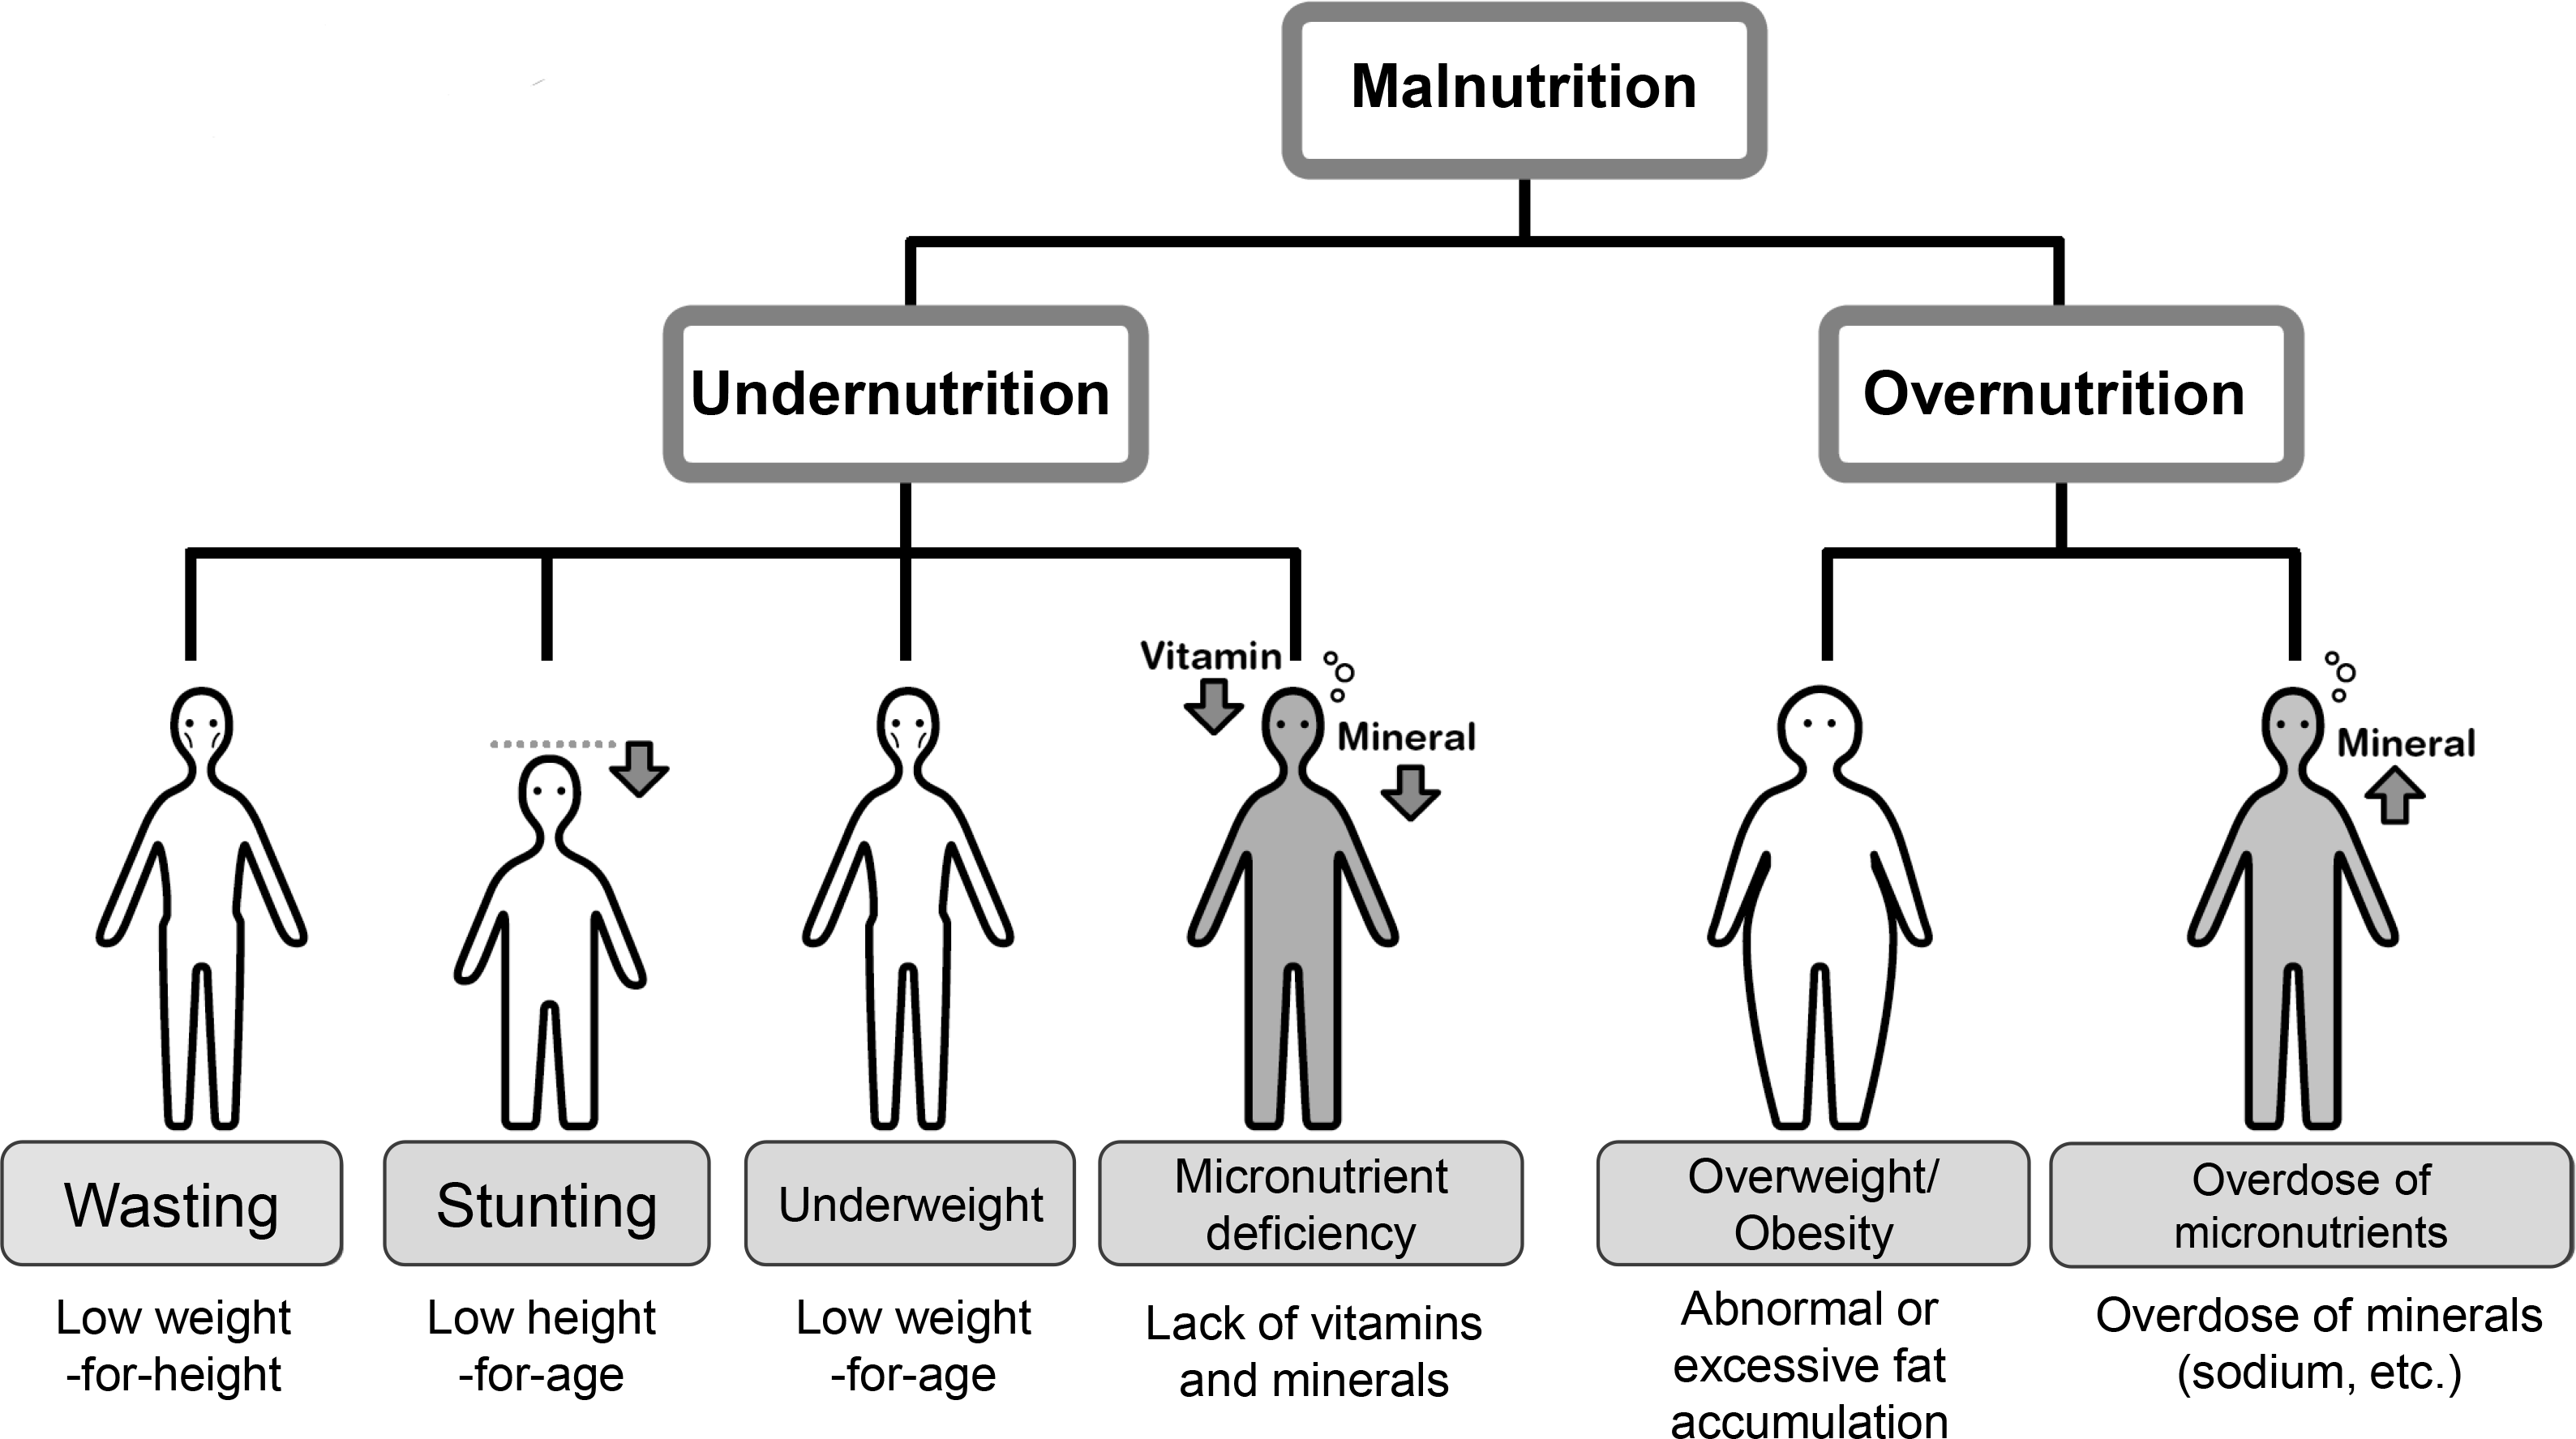
Figure: Indicators of Malnutrition
• Wasting (low weight for height) It often indicates recent and severe weight loss, although it can also persist for a long time.
• Stunting (low height for age) It is the result of chronic or recurrent undernutrition.
• Underweight (low weight for age) A child who is underweight may be stunted, wasted or both.
• Micronutrient deficiencies- lack of vitamins and minerals that are essential for body functions such as producing enzymes, hormones and other substances needed for growth and development. Iron deficiency leads to Anaemia.
• The estimated number of underweight, malnourished and severely malnourished children under 5 years of age is obtained under National Family Health Survey (NFHS) conducted by the Ministry of Health & Family Welfare.