Whatsapp 88106-52225 For Details
Get Free IAS Booklet
Get Free IAS Booklet
National Income
The whole amount of money that an economy has achieved thus far, without any double counting, is its national income. Usually for a year, it is estimated. It is the total net value of all goods and services produced by the members of a national economy in one year.
The National Sample Survey defines national income as “money measures of the net aggregates of all commodities and services accruing to the inhabitants of a community during a specific period.”
According to the National Income Committee of India” A national income estimate measures the volume of commodities and services turned out during a given period, wrong statement correct this - counted without duplication.
According to Froyen; “National income is the sum of all factor earnings from current production of goods and services.
History of National Income in India
Historical Background: Pre-Independence Estimate of National Income
The estimates of India’s pre-independence national revenue were the product of the independent work of renowned economists. The first person to estimate India’s national revenue was Dadabhai Naoroji.
In 1867–1868, the national income was estimated to be Rs. 340 crore, with an average per capita income of Rs. 20.
Post-Independence Estimates of National Income
Only after gaining independence in 1947 did formal national income estimates start to be prepared.
The National Income Committee was established on August 4, 1949, with Prof. P.C. Mahalanobis as its chairman and Profs. D.R. Gadgil and V.K.R.V. Rao as its members. This was the first attempt in this direction.
In addition to providing the conceptual basis for calculating national income, the committee’s initial report included official estimates of national income for 1948–
The National Sample Survey (NSS) was established in 1950 in response to the National Income Committee’s recommendation in order to regularly gather the necessary data for estimating national income.
Central Statistical Organization (CSO)
The Central Statistical Organisation (CSO), an official organisation established by the Indian government in 1954, is responsible for estimating national income.
Since 1956, when it released its first white paper on national income, the CSO has been releasing official national income estimates on a yearly basis under the heading “National Accounts Statistics.”
Central Statistical Office and GDP Estimation
In India, the GDP at factor cost has been the most prominent indicator of national income. The Government of India’s Central Statistics Office (CSO) has been disclosing the GDP at market prices as well as factor cost.
It has upgraded the National Income Accounting standards by introducing some notable changes.
Three types of changes were made by the CSO in the GDP estimation procedure.
Methodological changes
Change in the base year
Giving comprehensive coverage to all sectors.
Of these changes, the most important is the methodological changes in the form of a shift to GDP in market prices from factor costs. Globally there is a consensus that GDP in Market Prices is more powerful and useful than GDP in factor cost.
Gross Value Added (GVA) from different sectors will be calculated at basic prices. Actually, estimation of GVA at basic prices is a step to measure the GDP at market prices.
The country’s base year for estimating national income was shifted from 2004–05 to 2011–12. Typically, a base year adjustment is made on a regular basis to account for fluctuations in the economy.
Factor Cost, Basic Prices and Market Prices
The distinction between factor cost, basic prices and market prices is based on the distinction between net production taxes (production taxes less production
subsidies) and net product taxes (product taxes less product subsidies).
Production taxes and subsidies are paid or received in relation to production and are independent of the volume of production such as land revenues, stamp and registration fee.
Product taxes and subsidies, on the other hand, are paid or received per unit or product, e.g., excise tax, service tax, export and import duties etc.
Factor cost includes only the payment to factors of production, it does not include any tax.
In order to arrive at the market prices, we have to add to the factor cost the total indirect taxes fewer total subsidies.
In the middle are the basic prices, which do not contain product taxes (less product subsidies) but do include production taxes (less production subsidies). Therefore, we must increase the basic pricing by product taxes (reduced product subsidies) in order to reach market prices.
As stated above, now the CSO releases GVA at basic prices. Thus, it includes the net production taxes but not net product taxes.
Net product taxes must be added to GVA at basic prices in order to calculate GDP (at market prices). Thus,
GVA at factor costs + Net production taxes = GVA at basic prices
GVA at basic prices + Net product taxes = GVA at market prices
Depreciation or Consumption of Fixed Capital
Depreciation or Consumption of Fixed Capital is the loss in value of an asset or a class of assets, as they age. An asset’s monetary value declines with usage, wear and tear, or obsolescence. The term “depreciation” refers to this decline. A drop in an asset’s value known as depreciation can also be brought on by a variety of other reasons, such as poor market conditions. A few examples of assets that are prone to depreciation over time are machinery, equipment, and money.
Net Factor Income from Abroad (NFIA)
Net Factor Income from Abroad, or NFIA for short, is a crucial factor in determining the Gross National Product, or GNP. The income received by foreigners in India is deducted from the income received by Indians abroad to determine the NFIA.
Transfer Payments
A transfer payment is a one-way payment to a person or organization which has given or exchanged no goods or services for it.
In other words, it is a payment made for which no current or future goods or services are required in return. Government transfer payments include Social Security benefits, unemployment insurance benefits, and welfare payments. Taxes are considered transfer payments.
Since there is no value addition and no connection to any productive activity, transfer money is not included in the calculation of national income.
However, Transfer payments are included in Personal Income and are taxable.
Methods to Measure National Income
There are three methods to measure national income of an economy. These are:
• Production Method or Value-Added Method.
• Income Method.
• Expenditure Method.
Production Method
Basically, three steps are involved in applying the production method to compute the national income of an economy. These steps are: to identify the producing enterprises and to classify them into industrial sectors according to their activities to estimate net value added at factor cost of each producing enterprise within the domestic territory of an economy and to add up net value added by all the sectors to arrive at net domestic product at factor cost to estimate net factor income from abroad, which has to be added to net domestic product at factor cost to arrive at net national product at factor cost/ national income of an economy.
Estimation of Net Value Added
After the producing sectors of an economy are identified, the next step is to find out net value added of each of these sectors. The term value added refers to addition of value by a producing unit to raw materials and services (known as intermediate inputs) used in production. What a producer produces is termed as the output. Value added is the difference between the value of output and the cost of intermediate inputs.
Example
Assume for the moment that the economy comprises only two types of producers. They are the wheat producers (or the farmers) and the bread makers (the bakers). The wheat producers grow wheat and they do not need any input other than human labour. They sell a part of the wheat to the bakers. The bakers do not need any other raw materials besides wheat to produce bread. Let us suppose that in a year the total value of wheat that the farmers have produced is Rs 100. Out of this they have sold Rs 50 worth of wheat to the bakers. The bakers have used this amount of wheat completely during the year and have produced Rs 200 worth of bread. What is the value of total production in the economy? If we follow the simple way of aggregating the values of production of the sectors, we would add Rs 200 (value of production of the bakers) to Rs 100 (value of production of farmers). The result will be Rs 300.
A little reflection will tell us that the value of aggregate production is not Rs 300. The farmers had produced Rs 100 worth of wheat for which it did not need assistance of any inputs. Therefore, the entire Rs 100 is rightfully the contribution of the farmers. But the same is not true for
the bakers. The bakers had to buy Rs 50 worth of wheat to produce their bread. The Rs 200 worth of bread that they have produced is not entirely their own contribution. To calculate the net contribution of the bakers, we need to subtract the value of the wheat that they have bought from the farmers. If we do not do this, we shall commit the mistake of ‘double counting’. This is because Rs 50 worth of wheat will be counted twice. First it will be counted as part of the output produced by the farmers. Second time, it will be counted as the imputed value of wheat in the bread produced by the bakers.
Therefore, the net contribution made by the bakers is, Rs 200 – Rs 50 = Rs 150. Hence, the aggregate value of goods produced by this simple economy is Rs 100 (net contribution by the farmers) + Rs 150 (net contribution by the bakers) = Rs 250. The term that is used to denote the net contribution made by a firm is called its value added.
If we include depreciation in value added then the measure of value added that we obtain is called Gross Value Added. If we deduct the value of depreciation from gross value added we obtain Net Value Added.
Therefore,
GVA or GDPMP = Value of output of all three sectors- Intermediate consumption of all three sectors
GDP vs. GVA
GDP: The GDP calculates the monetary value of all “final” goods and services those purchased by the end user that are generated in a nation over a specific time frame.
“Engines of GDP Growth”: Four Principal
• Every penny that Indians spend on personal consumption, also known as Private Final Consumption Expenditure (PFCE)
• The total amount of money the government spent on ongoing expenses, like salaries (also known as government final consumption expenditure, or GFCE)
• All of the funds invested in order to increase the economy’s potential for production. This includes corporations purchasing factories or governmental bodies constructing highways and bridges. [Total Fixed Capital Outlay]
• The net result of imports (what Indians spent on foreign goods) and exports (what foreigners spent on our goods) is known as net exports, or NX.
• Therefore,
GDP = Private Consumption + Gross Investment + Government Investment + Government Spending + (Exports-Imports)
GVA: The GVA uses supply-side calculations to determine the same national income. To achieve this, the total value added across all sectors is added
The RBI states that the value of an industry’s output less the value of its intermediary inputs is its gross value added (GVA). The two main production elements, labour and capital, share this “value added.”
Which economic sectors are doing well and which are not can be determined by examining the GVA growth.
How are the two Related?
The GVA data is used to calculate the GDP.
The following equation shows how the GDP and GVA are related: GDP is calculated as GVA + Government Earned Taxes Government Provided Subsidies.
Consequently, the GDP will exceed the GVA if the government’s revenue from taxes exceeds the amount of subsidies it offers.
The GDP statistics is more helpful for examining annual economic growth and for contrasting a nation’s economic growth with that of another or with its prior growth.
Income Method
The main steps involved in estimating national income by the income method are: to identify the producing enterprises, which use services of the factors of production to classify various types of factor payments to estimate various components of factor payments to estimate net factor income from abroad, which has to be added to net domestic product at factor cost to arrive at net national product at factor cost or national income of an economy.
The classification of producing units that is adopted by the production method of estimating national income can be used for the income method also.
The factor payments are generally classified into the following categories:
• Compensation of employees
• Rent
• Interest
• Profits
• Mixed income of the self-employed
Moreover, factor payments can be classified into: (a) compensation of employees, (b) operating surplus, (c) mixed income of the self-employed. There are a few points to be kept in mind while estimating national income by income method.
A distinction has to be made between factor and income transfer income. While factor incomes are earned by factors of production, transfer incomes are enjoyed by various economic agents without supplying factor services. It is only factor incomes that constitute national income. Accordingly, transfer incomes are excluded from national income of an economy.
The services of owner-occupied dwellings are equal to imputed rent of the dwelling. Imputed rent adjusted for maintenance expenditure of dwellings is included in national income by production method.
Income earned by the act of smuggling or gambling as well as windfall gains like lotteries are not included in the estimation of national income.
National Income of an economy includes direct taxes like income tax and corporate tax. It may be useful to remember that compensation of employees includes income tax to be paid by them and are included in national income before deduction of corporate tax. Death duties, gift tax, wealth tax, etc., are supposed to be paid from the wealth or past savings of those persons who pay these taxes and not out of current income. Therefore, such taxes are not included in the estimation of national income.
Sale and purchase of second-hand goods are not included in the national income of an economy. The sale proceeds of second-hand goods received by a person do not relate to any service rendered and, therefore, do not constitute a part of national income.
Therefore,
NDPFC = Compensation of Employees + Operating Surplus + Mixed Income of the Self-Employed
Expenditure Method
The expenditure method is a technique for measuring a country’s Gross Domestic Product (GDP) by incorporating imports, exports, investments, consumption, and government spending. The expenditure method can be regarded as the frequently used method to measure GDP.
Various components of final expenditures constituting gross domestic product at market price are: private final consumption expenditure, government’s final consumption expenditure, gross domestic fixed capital formation, change in stock and net export of goods and services.
Private Final Consumption Expenditure
Private final consumption expenditure is defined as the expenditure on current account of resident and non- resident households in the domestic market and on profit-making bodies serving households.
The expenditure, here, relates to outlays on new durable as well as non-durable goods (except land) and on services net of sales (sales less purchases) of second-hand goods, scrap and wastes.
It is important to keep in mind that it is not possible to take account of the direct purchases made by the resident households from abroad and deduct the purchases of non-resident households in the domestic market to get the final expenditure of resident households only. Therefore, the final private consumption expenditure also includes the purchases of goods from abroad or goods, which have been imported from abroad.
Moreover, the figure of final private consumption expenditure includes the imputed gross rent of owner- occupied dwellings, consumption of own-account production and payment by households of wages and salaries in kind valued at cost, e.g., provision for food, shelter and clothing to the employees, wherever they exist.
Government Final Consumption Expenditure
Government final consumption expenditure is defined as the current expenditure on goods and services used up in providing services of government administrative departments less the sales by them.
Here, we are considering the services rendered by general government which consists of all departments, offices, organizations and other bodies, which are agencies or instruments of the Centre, state or local public authorities, financed by budgets or extra budget funds. Government enterprises, public corporations and departmental enterprises are excluded from it.
The value of government final consumption expenditure is equal to the value of the services produced (such as public health, cultural services, defence, and law and order) by the government for collective use by the public.
Gross Domestic Fixed Capital Formation
Gross fixed capital formation consists of the outlays of industries, producers of government services and producers of private non-profit services to households, in addition of new durable goods to the stocks of fixed assets fewer net sales of similar second-hand and scrapped goods.
The outlays of government services on durable goods for military use are excluded from gross fixed capital formation.
In it, outlays on the improvement of land, on the development and extension of timber tracts, plantations etc., are included, provided they take more than one year to become productive.
Outlays by households on residential constructions are also included in gross fixed capital formation. Gross fixed capital formation is inclusive of the consumption of fixed capital. Net fixed capital formation is defined as gross fixed capital formation less the consumption of fixed capital.
Gross domestic fixed capital formation is the gross fixed capital formation with reference to the domestic territory of the country. It consists of acquisition of fixed assets by resident industries and the producers of government services and of private non-profit services to households.
Change in Stocks
Stocks consist largely of materials and supplies, work- in-progress (except in construction projects) and finished
products in the possession of industries. Standing timber and crops are not included in stocks, but livestock raised for slaughter, logs and harvested crops are. Change in stocks is the difference between markets or book values of the stocks in the beginning and at the end of the year.
Net Export of Goods and Services
Net export of goods and services is the difference between value of export and import of goods and services over a year. Accordingly, net export can be positive or negative, positive when exports are more than imports, and negative when reverse is the case.
In India, export of goods and services is defined as all transfers of the ownership of goods from residents of the country to non-residents and services provided by resident producers of the country to non-residents.
There are a few points to be kept in mind while estimating national income by the expenditure method.
Expenditure on all intermediate goods and services is to be excluded. This is done primarily to avoid double counting.
All government expenditure on transfer payments is excluded from national income. Some examples of such transfer payments are unemployment benefits, old age pensions and scholarships given to students for education purposes. Those who receive these transfers are not expected to render any service in exchange.
All expenditures on second-hand goods are excluded since they are not from the currently produced goods and services. Similarly, expenditure on the purchase of old shares or bonds or debentures from other people or new shares, bonds or debentures from producing units or government are excluded since they are not payments for a good or service currently produced. There is only the transfer of property from one person to another.
Therefore,
GDPMP = Personal Consumption Expenditure (C) + Investments (I) + Government Exp. (G) + Exports(X) – Imports (M)
GDP and Welfare
GDP is the sum total of value of goods and services created within the geographical boundary of a country in a particular year. It gets distributed among the people as incomes (except for retained earnings). So, we may be tempted to treat a higher level of GDP of a country as an index of greater well-being of the people of that country (to account for price changes, we may take the value of real GDP instead of nominal GDP). But there are at least three reasons why this may not be correct.
Distribution of GDP- how uniform is it: If the GDP of the country is rising, the welfare may not rise as a consequence. This is because the rise in GDP may be concentrated in the hands of very few individuals or firms. For the rest, the income may in fact have fallen. In such a case the welfare of the entire country cannot be said to have increased.
Non-monetary exchanges: Many activities in an economy are not evaluated in monetary terms. For example, the domestic services women perform at home are not paid for. In barter exchanges, goods (or services) are directly exchanged against each other. But since money is not being used here, these exchanges are not registered as part of economic activity. This is a case of underestimation of GDP. Hence, GDP calculated in the standard manner may not give us a clear indication of the productive activity and well-being of a country.
Externalities: Externalities refer to the benefits (or harms) a firm or an individual causes to another for which they are not paid (or penalised). Externalities do not have any market in which they can be bought and sold. For example, let us suppose there is an oil refinery which refines crude petroleum and sells it in the market. The output of the refinery is the amount of oil it refines. We can estimate the value added of the refinery by deducting the value of intermediate goods used by the refinery (crude oil in this case) from the value of its output. The value added of the refinery will be counted as part of the GDP of the economy. But in carrying out the production the refinery may also be polluting the nearby river. This may cause harm to the people who use the water of the river. Hence their wellbeing will fall. Such harmful effects that the refinery is inflicting on others, for which it will not bear any cost, are called externalities. In this case, the GDP is not taking into account such negative externalities. Therefore, if we take GDP as a measure of welfare of the economy, we shall be overestimating the actual welfare. This was an example of negative externality. There can be cases of positive externalities as well. In such cases, GDP will underestimate the actual welfare of the economy.
Per Capita Income: The per capita income of a geographical location (say, a country, state, city, or others) measures the amount of money earned by every person in that area. It determines the average income of a person in a country, a state, or a specific region. This helps us evaluate the standard of livelihood and the quality of life of people in the geographical location.
In Latin, the word “Per Capita” means “by head.” Per Capita income is generally used in Statistics, Business, Economics and many other fields.
It is calculated for an average per person and then expressed as a ratio. This ratio helps to determine different information depending on the context it is used.
PCI compares and assesses the economic situations of countries with varying population sizes. The measurement of a country’s per capita income is done by dividing the total national income of a particular country or state by the population in that specific geographical region. When calculating a country’s PCI, every individual is taken into account. The calculation includes men, women, children, and babies. This is mainly because the measurement considers the entire country’s population or specific geographical location.
How is Per Capita Income Calculated?
We use this formula to calculate the per capita income
of a particular area.
PCI = Population’s total income / Population of a specific area
When you calculate the PCI of a country, you’ve to divide a country’s total income by that country’s total population
What are the Uses of Per Capita Income?
PCI calculation is used in various fields of statistics and
economics. The various uses of PCI are:
Gross Domestic Product Per Capita - The GDP Per Capita calculates a country’s economic output by the number of people in that country. You have to divide a nation’s total economic domestic production by that nation’s population. The formula for calculating GDP Per Capita is:
GDP Per Capita = Gross Domestic Product/ Population
Gross National Income Per Capita - To determine the Gross National Income per Capita, you have to take into account Gross Domestic Product Per Capita along with the value generated by the people of a country living abroad.
Other Uses
Per Capita Income is used to find out an area’s wealth or lack thereof. It is also used to find out the affordability of an area regarding data on real estate prices.
Prominent business chains and owners consider an area’s per capita income before opening a store branch or shop in a concerned area. The higher PCI of a place, the higher the chances of making considerable revenue. The chances of profitable revenue fall drastically in those places where PCI is low.
Importance of Measuring National Income
A comprehensive summary of the economic activity: National income estimates provide detailed data on a country’s production, savings, investment, and capital formation, providing a comprehensive picture of its people’s economic activities in a given year.
Assessment of the relative importance and progress of the different sectors: National income data in India reveals the importance of sectors like agriculture, industry, trade, commerce, and services in the country’s economy. From 1995-96, 33% of national income came from the primary sector, 26% from the secondary sector, and 41% from the tertiary sector.
Indispensable to government for framing policies and programmes: Estimates of national income components are crucial for a country’s economic policies and programs, especially in developing countries for future development plans.
The pivot of economic planning: National income estimates are the foundation of economic planning, providing an accurate assessment of existing resources and deficiencies, enabling the government to allocate resources for various development sectors.
Input-output analysis: National Income data are also very useful for studying, as done by Prof. W. W. Leontief, the structure of the economy through the input-output analysis.
Measurement of inflationary and deflationary gaps: Modern economists utilize national income data to gauge inflation or deflationary gaps in a country at any given time.
Social accounting and the framing of the budget: ‘Social Accounting’ is based on national income figures, and the government’s annual budgets are also influenced by these estimates.
Measuring the rate of growth and the per capita income: The annual rate of increase in national income represents a country’s economic growth, while per capita income is calculated by dividing national income by the total population in a given year.
Comparison of living conditions: National income data is crucial for comparing economic conditions, particularly living conditions, across different countries and times.
Limitations of National Income Measurement
The three main limitations to national income accounting are:
Errors in Measurement: Black market and underground activities are not included in GDP calculations which leads to inaccurate measurement. In the US, this percentage is small, but in less developed countries, it can reach 70%. Inflation, adjusted based on base prices, can range from 1% to 15% in some places.
Subcategories being Misinterpreted: The determination of GDP is significantly influenced by interpretations of consumption and government spending, with decisions made to include minor discrepancies.
Welfare is not Measured: GDP measures market activity without considering welfare. Economic activity may rise while welfare may fall, leading to increased spending and GDP. Negative situations can impact people’s spending.
Shapes of Economic Recovery
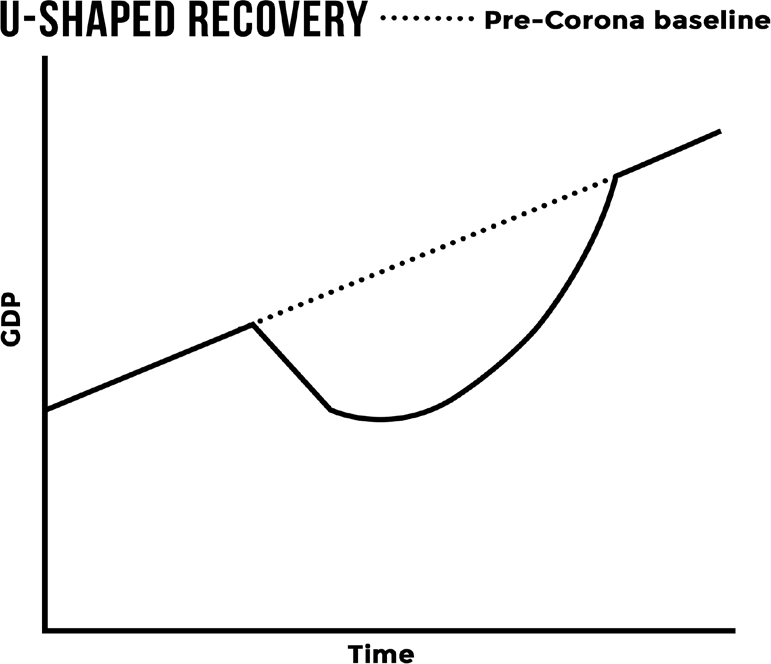
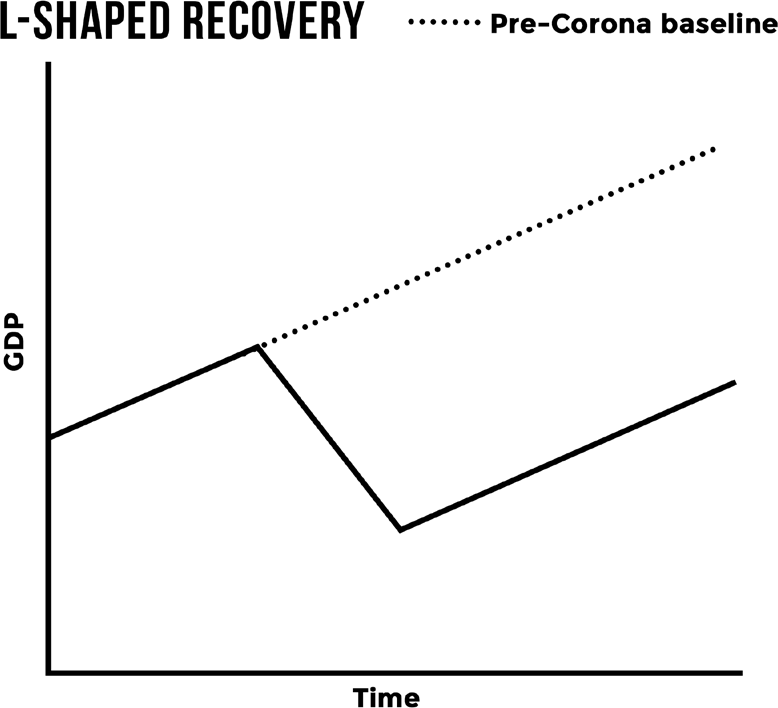
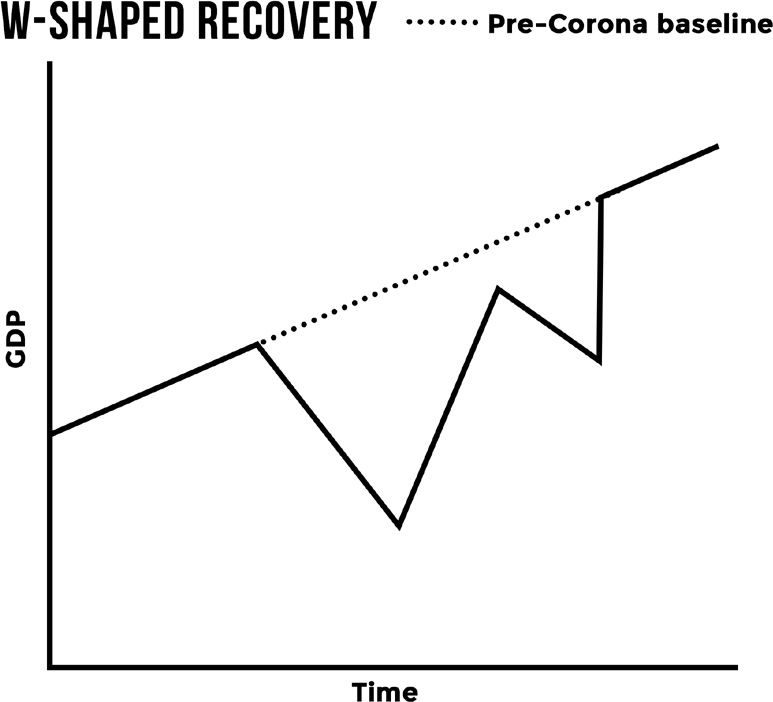
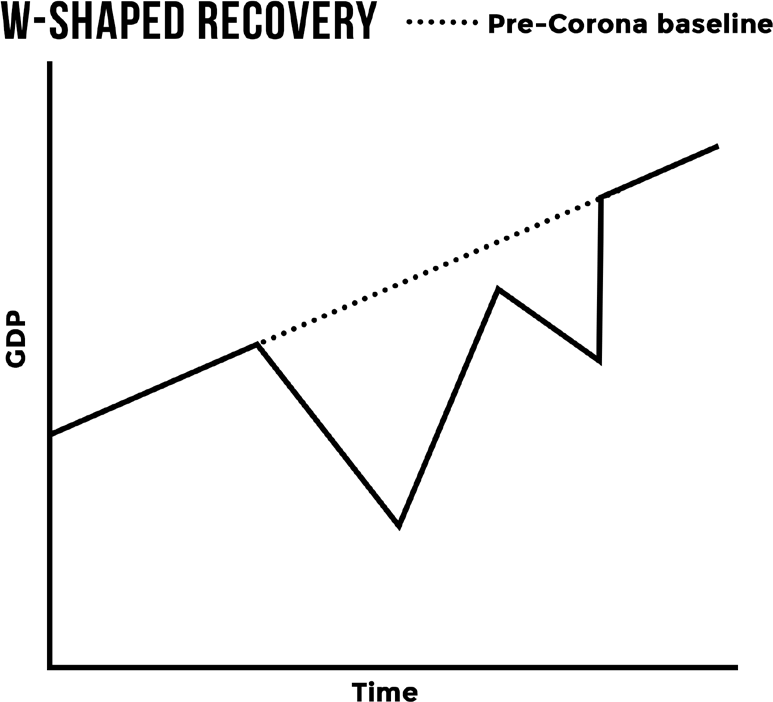
The various shapes that economic recovery can take are shown by the alphabetic notation. Z-shaped, V-shaped, U-shaped, extended U-shaped, W-shaped, L-shaped, and K-shaped recovery are a few examples of recovery shapes.
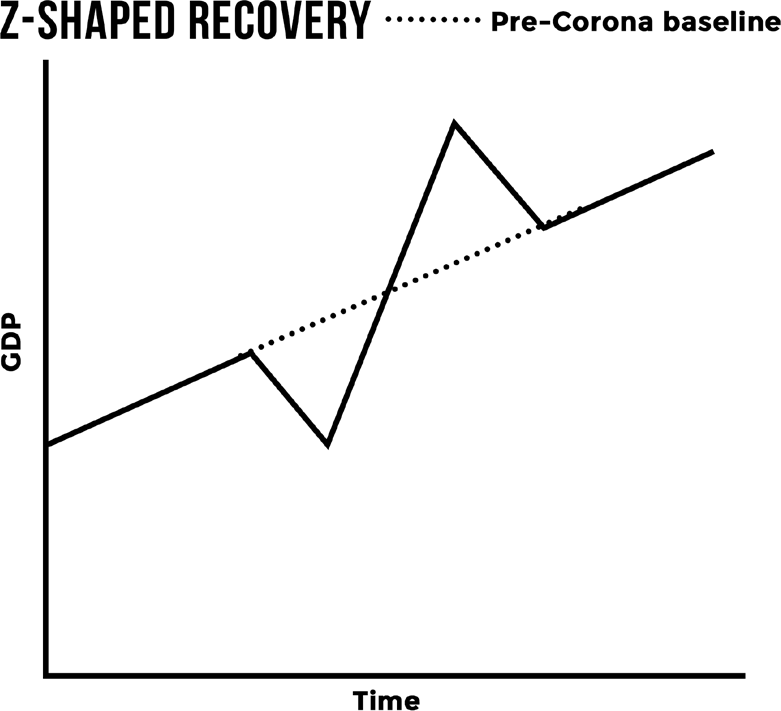
Z-shaped recovery: In the most optimistic case, the economy recovers swiftly from a financial crisis. It creates a Z-shaped chart by making up more ground than it lost before returning to the typical trend-line. For a brief while, there is an economic disruption that limits people’s spending power more so than their salaries.
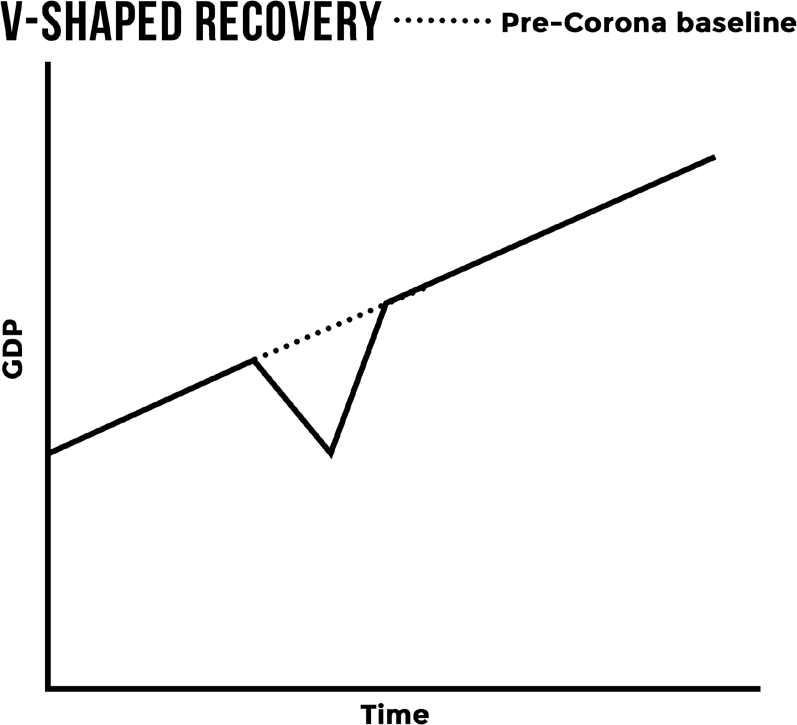
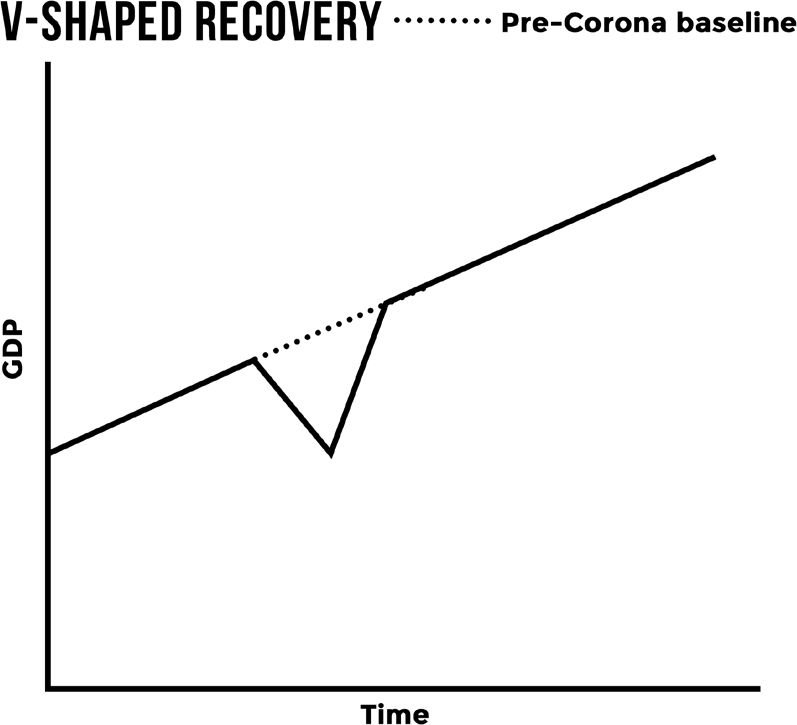
V-shaped recovery: After a Z-shaped recovery, this is the best case scenario in which the economy swiftly regains lost ground and returns to the normal growth trend-line.
In this scenario, economic growth recovers quickly and resumes its pre-disturbance trajectory, preserving wages and employment in the process.
U-shaped recovery: In this scenario, the economy experiences a period of low growth followed by a gradual return to normalcy. This follows a period of decline. In this instance, many lose their employment and are left depending only on their savings. This method produces the “elongated U” shape if it is drawn more slowly.
W-shaped recovery: A recovery that is W-shaped is a scary thing. This creates a W-shaped pattern as growth first declines, then rises, then declines again, then recovers. The second wave of the pandemic may be to blame for the double-dip shown by a W-shaped recovery.
L-shaped recovery: In this case, years pass and the economy is unable to return to its previous GDP level. The form indicates that the economy’s capacity to produce is permanently lost.
K-Shaped Recovery: Following a recession, a K-shaped recovery happens when the economy recovers in diverse ways and at different rates. An even, consistent recovery across sectors, industries, or demographic groupings contrasts with this. Due to the underlying changes in economic outcomes and relationships that occur both before and after the recession, a K-shaped recovery causes changes in the structure of the economy or in society at large.