Whatsapp 88106-52225 For Details
Get Free IAS Booklet
Get Free IAS Booklet
INTRODUCTION
At any level of development, human impact on the environment is a function of per capita consumption and the environmental damage caused by the technology used to produce what is consumed. People in developed countries have the greatest impact on the global environment.
According to World Inequality Report 2022, the global top 10 per cent owns 76 per cent of total household wealth and captures 52 per cent of total income in 2021 compared with the bottom 50 per cent, who account for a mere 5 per cent.
As living standards rise in developing countries, the environmental consequences of population growth will be amplified with ever-increasing numbers of people aspiring, justifiably, to “live better.”
Background on Population
The people are very important component of a country. India is the most populous country surpassing China in the world with its total population of about 1.43 billion (2023), which account for 17.7 per cent of the world’s population. These 1.43 billion people are unevenly distributed over our country’s vast area of 3.28 million square km, which accounts for 2.4 per cent of the world’s area.
India’s population is larger than the total population of North America, South America and Australia put together. More often, it is argued that such a large population invariably puts pressure on its limited resources and is also responsible for many socio-economic problems in the country.
The people are important for development of economy and society. People develop resources and they use resources. People themselves are also resources to various processes. E.g., Coal is a piece of rock but humans are able to utilise it in various forms.
Human beings are at the centre of the concerns for any developmental activities. This is because people are the most important and valuable resource of any nation. Consequently, the right to development must be fulfilled so as to equitably meet the population and development needs of present and future generations.
Sources of Population Data
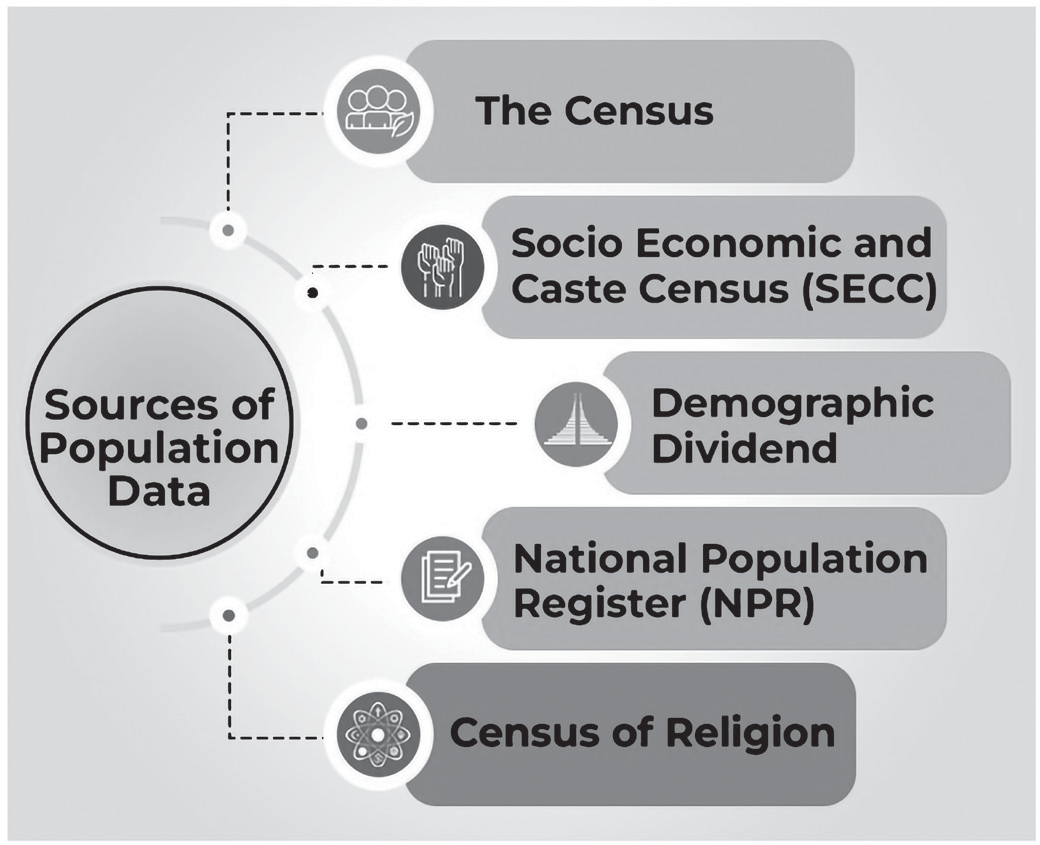
A Census is an official enumeration of population done periodically. Population data are collected through Census operation held every 10 years in our country. The first population Census in India was conducted in 1872 but its first complete Census was conducted only in 1881. Since then, Censuses have been held regularly every tenth year. The Indian Census is the most comprehensive source of demographic, social and economic data.
With a history of more than 130 years, this reliable, time- tested exercise is bringing in a real insight into the data
every 10 years, beginning in the year 1872 when the first Census was conducted non-synchronously in different parts of India. Under Lord Ripon in 1881, it was conducted synchronously. Since then, it has been conducted regularly.
Constitutional-Legal basis: It lies under Entry 69 of the Union List of the Seventh Schedule (Article 246) of the Constitution.
The Census Organization has been established by Census Act 1948.
The law makes it compulsory for every citizen to answer the Census questions truthfully.
The Act provides penalties for giving false answers or not giving answers at all to the Census questionnaire.
One of the most important provisions of law is the guarantee for the maintenance of secrecy of the information collected at the Census of each individual.
The Census records are not open to inspection and also not admissible in evidence.
It also mandates implementation of the Birth and Death Registration Act, 1969 in the country.
Agency: The decennial Census is conducted by the Office of the Registrar General and Census Commissioner, Ministry of Home Affairs.
Method: The Census is conducted in two phases:
Phase I: House Listing and House Numbering
Phase II: Actual Population Enumeration
The Census is carried out by the canvassing method. In this method, each household is visited and the information is collected by specially trained enumerator. They collect data related to households e.g. number of members, water & electricity supply, ownership of land, vehicles, computers and other assets and services. In the second phase, total population is counted and statistics related to individuals are collected and saved into the governments hand.
Difference between Census and SECC
The Census provides a portrait of the Indian population, while the SECC is a tool to identify beneficiaries of state support.
Since the Census falls under the Census Act of 1948, all data are considered confidential, whereas according to the SECC website, “all the personal information given in the SECC is open for use by Government departments to grant and/or restrict benefits to households.”
Other Sources of Population Data for Policy Making
Socio-Economic and Caste Census (SECC) 2011: The SECC aims to survey every Indian household, both in rural and urban areas, gathering information on their economic status and specific caste identities. This will enable the government to assess which caste groups are economically advancing and which are not.
SECC serves as a tool for identifying individuals who are eligible for state support.
The SECC data is accessible to government departments for determining eligibility for benefits or restrictions.
SECC has the potential to provide a broader view of social and economic inequalities.
The data will be valuable in justifying the need for caste-based affirmative action or welfare schemes.
Household Consumption Expenditure Survey: Information collected in the survey is primarily used for preparation of weighting diagram through determination of budget shares of different commodity groups in total consumption for compilation of consumer price indices for rural and urban India.
The National Statistical Office (NSO), under the Ministry of Statistics and Programme Implementation (MoSPI), has been conducting National Sample Surveys since 1950, using scientific sampling methods to collect data on various socio-economic indicators.
The Consumer Expenditure Survey (CES) is conducted every five years. The 2017-18 survey was rejected by the government due to "quality issues" after leaked data indicated a rise in poverty levels. On December 27, 2024, the Ministry of Statistics and Programme Implementation (MoSPI) published a factsheet presenting the summary findings of the second of two consecutive household consumption expenditure surveys planned for 2022-23 and 2023-24.
The revamped CES includes new features, such as three visits by enumerators to households to gather more detailed information about their consumption patterns. The consumption basket has also been expanded in this new round.
In addition, the survey will compile statistical data on living standards, social consumption, well-being, and social inequalities.
• The Average Monthly Per Capita Consumption Expenditure (MPCE) of any sub-population, such as a specific region or population group, provides a single figure that reflects the living standards of that group.
• A more detailed analysis of MPCE distribution helps determine the proportion and absolute number of people living in poverty relative to a specific poverty line. MPCE can also serve as an indicator of a household's purchasing power.
• The survey is designed to collect data on household expenditures for both food and non-food goods and services. The results are also used to rebase GDP and other macroeconomic indicators, such as retail inflation based on the Consumer Price Index (CPI).
Population Distribution and Density
The world’s population is unevenly distributed across the globe. Some regions, such as deserts, dense forests, and mountainous areas, have a low population density, while other areas, including coastal and deltaic plains, regions with moderate climates, fertile land, industrialized zones, and urban centers, are densely populated. This variation in the population spread is referred to as the distribution of population.
If we look at the factors responsible for the distribution of population, then all the factors may be broadly grouped under two categories:
• Geographical factors – latitude, altitude, relief, climate, mineral and energy resources, and
• Socioeconomic factors, like industrialization, urbanization, type of economy, political scenario and public policies.
Population Density is one way of expressing distribution of population. Density of population is expressed as the number of persons per sq. km. This is popularly known as Arithmetic Density.
Population distribution can be analysed by different criteria. In terms of continents, Asia has the largest share of population (about 60 per cent) followed by Africa, Latin America and Europe.
Indian Scenario
India exhibits a highly uneven pattern of population distribution. Uttar Pradesh has the largest population, followed by Maharashtra, Bihar, and West Bengal. Together, Uttar Pradesh, Maharashtra, Bihar, West Bengal, Andhra Pradesh, Tamil Nadu, Madhya Pradesh, Rajasthan, Karnataka, and Gujarat account for around 76 percent of the country’s total population. In contrast, states and Union Territories like Jammu & Kashmir (1.04%), Arunachal Pradesh (0.11%), and Uttarakhand (0.84%) have a very small share of the population, despite having relatively large geographical areas. This uneven distribution reflects a strong connection between population density and various physical, socioeconomic, and historical factors.
• Physical factors: It is evident that climate, along with terrain and water availability, plays a major role in shaping the pattern of population distribution. As a result, regions like the North Indian Plains, deltas, and Coastal Plains have a higher population density compared to the interior districts of southern and central India, the Himalayas, some northeastern states, and certain western states.
• However, the development of irrigation (such as in Rajasthan), access to mineral and energy resources (like in Jharkhand), and improvements
in transportation networks (particularly in Peninsular India) have led to a moderate to high population concentration in areas that were previously sparsely populated.
• Historical factors, such as the development of settled agriculture, agricultural progress, patterns of human settlement, the growth of transport networks, industrialization, and urbanization, have played a significant role in population distribution.
• It is observed that regions in India’s river plains and coastal areas have consistently experienced higher population concentrations.
• Despite signs of resource degradation, such as in land and water usage in these regions, the population density remains high due to the early establishment of human settlements and the
development of transport infrastructure.
• Socio-economic factors: The urban regions of Delhi, Mumbai, Kolkata, Bengaluru, Pune, Ahmedabad, Chennai and Jaipur have high concentration of population due to industrial development and urbanisation drawing a large number of rural-urban migrants.
Population Density
Density of population, is expressed as number of persons per unit land area. It helps in getting a better understanding of the spatial distribution of population in relation to land.
Density of Population in India
The density of population in India (2011) is 382 persons per sq km. There has been a steady increase of more than 200 persons per sq km over the last 50 years.
Spatial variation of population densities ranges from as low as 17 persons per sq km in Arunachal Pradesh to 11,297 persons in the National Capital Territory of Delhi.
Among the northern Indian States, Bihar (1102), West Bengal (1029) and and Uttar Pradesh (828) have higher densities, while Kerala (859) and Tamil Nadu (555) have higher densities among the peninsular Indian states.
States like Assam, Gujarat, Andhra Pradesh, Haryana, Jharkhand, Odisha have moderate densities.
The hill states of the Himalayan region and North eastern states of India (excluding Assam) have relatively low densities while the Union Territories (excluding Andaman and Nicobar Islands) have very high densities of population.
The density of population is a crude measure of human and land relationship. To get a better insight into the human-land ratio in terms of pressure of population on total cultivable land, the physiological and the agricultural densities should be found out which are significant for a country like India having a large agricultural population.
Physiological Density = total population / net cultivated area
Agricultural Density = total agricultural population / net cultivable area
Agricultural population includes cultivators and agricultural labourers and their family members
Population Growth
Growth of population refers to the change in the number of inhabitants of a country/ territory during a specific period of time, say during the last 10 years. Such a change can be expressed in two ways:
• Absolute numbers per year
• Per centage change per year
The absolute numbers added each year or decade is the magnitude of increase. It is obtained by simply subtracting the earlier population (e.g. that of 2001) from the later population (e.g. that of 2011). It is referred to as the Absolute Increase.
On the other hand, the rate of population growth is studied in per cent per annum, e.g. a rate of increase of 2 per cent per annum means that in a given year, there was an increase of two persons for every 100 persons in the base population. This is referred to as the Annual Growth Rate.
Population Doubling Time is the time taken by any population to double itself at its current annual growth rate.
The growth of population is determined by fertility, mortality, and migration. Population growth may be expressed in various ways. Natural growth is the simplest expression which is the difference between birth rate and death rate, whereas actual growth takes migration in to consideration.
World Population Growth
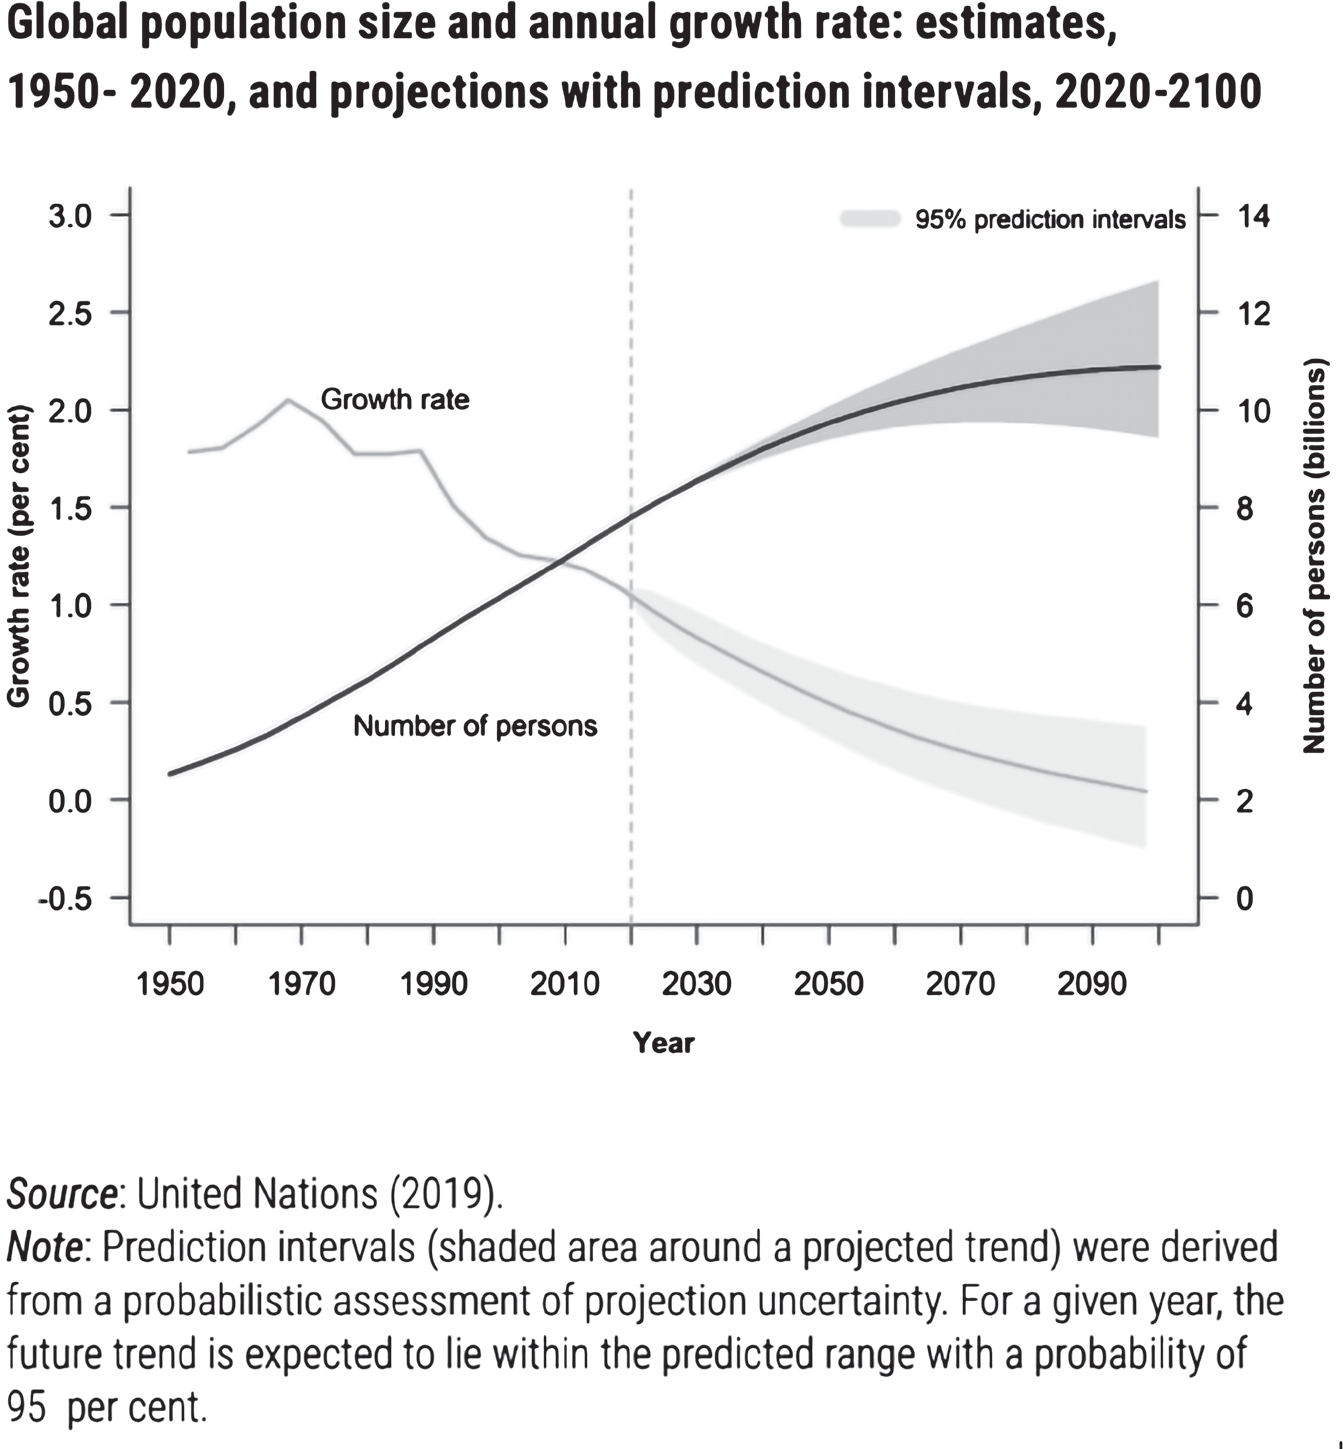
The world’s population has been growing continuously since the end of the Black Death around 1400. There were also short-term falls at other times due to plague, for example in the mid-17th century. The fastest rates of world population growth (above 1.8 per cent) were seen briefly during the 1950s, and then for a longer period during the 1960s and 1970s. According to population projections, world population will continue to grow until around 2050.
• Since births outnumber deaths, the world’s population is expected to reach about 9 billion by the year 2040. The alarming fact is that we have been adding one billion populations in 12 years interval. If we look at the demographic history, it is evident that the world took about 200 years to add three billion populations, whereas next three billion were added in the next forty years.
• We are living in an era of unprecedented population growth. Since the middle of the twentieth century, the world’s population has more than tripled in size, reaching almost 8 billion people in 2022 (figure 1).
• Projections by the United Nations suggest that the size of the global population could grow to almost 11 billion by around 2100. However, the pace of global
growth has slowed considerably since around 1970, and the world’s population is expected to stabilize by the end of the century.
• The unprecedented growth of the global population that has occurred since 1950 is the result of two trends:
• The gradual increase in average human longevity due to widespread improvements in public health, nutrition, personal hygiene and medicine.
• The persistence of high levels of fertility in many countries.
Indian Scenario
India’s population has been steadily increasing from 361 million in 1951 to 1210 million in 2011, which explains the rapid increase in population from 361 million in 1951 to 683 million in 1981.
Since 1981, however, the rate of growth started declining gradually. During this period, birth rates declined rapidly. Still 182 million people were added to the total population in the 1990s alone (an annual addition larger than ever before).
It is essential to realise that India has a vast population. When a low annual rate is applied to a very large population, it yields a large absolute increase. When more than a billion people increase even at a lower rate, the total number being added becomes very large. India’s annual increase in population is large enough to neutralise efforts to conserve the resource endowment and environment.
Fertility and its Indicators
Fertility is one of the major components of demographic situation and is connected with human child bearing or reproduction. Sometimes, the term ‘natality’ is used in place of fertility. Commonly, the term refers to occurrences of births, or, more particularly, live births.
In order to understand the implications of fertility, indicators of fertility such as Growth Rate, Crude Birth Rate, General Fertility Rate, Age Specific Fertility Rate, Total Fertility Rate, Gross Reproduction Rate, and Net Reproduction Rate must be looked at.
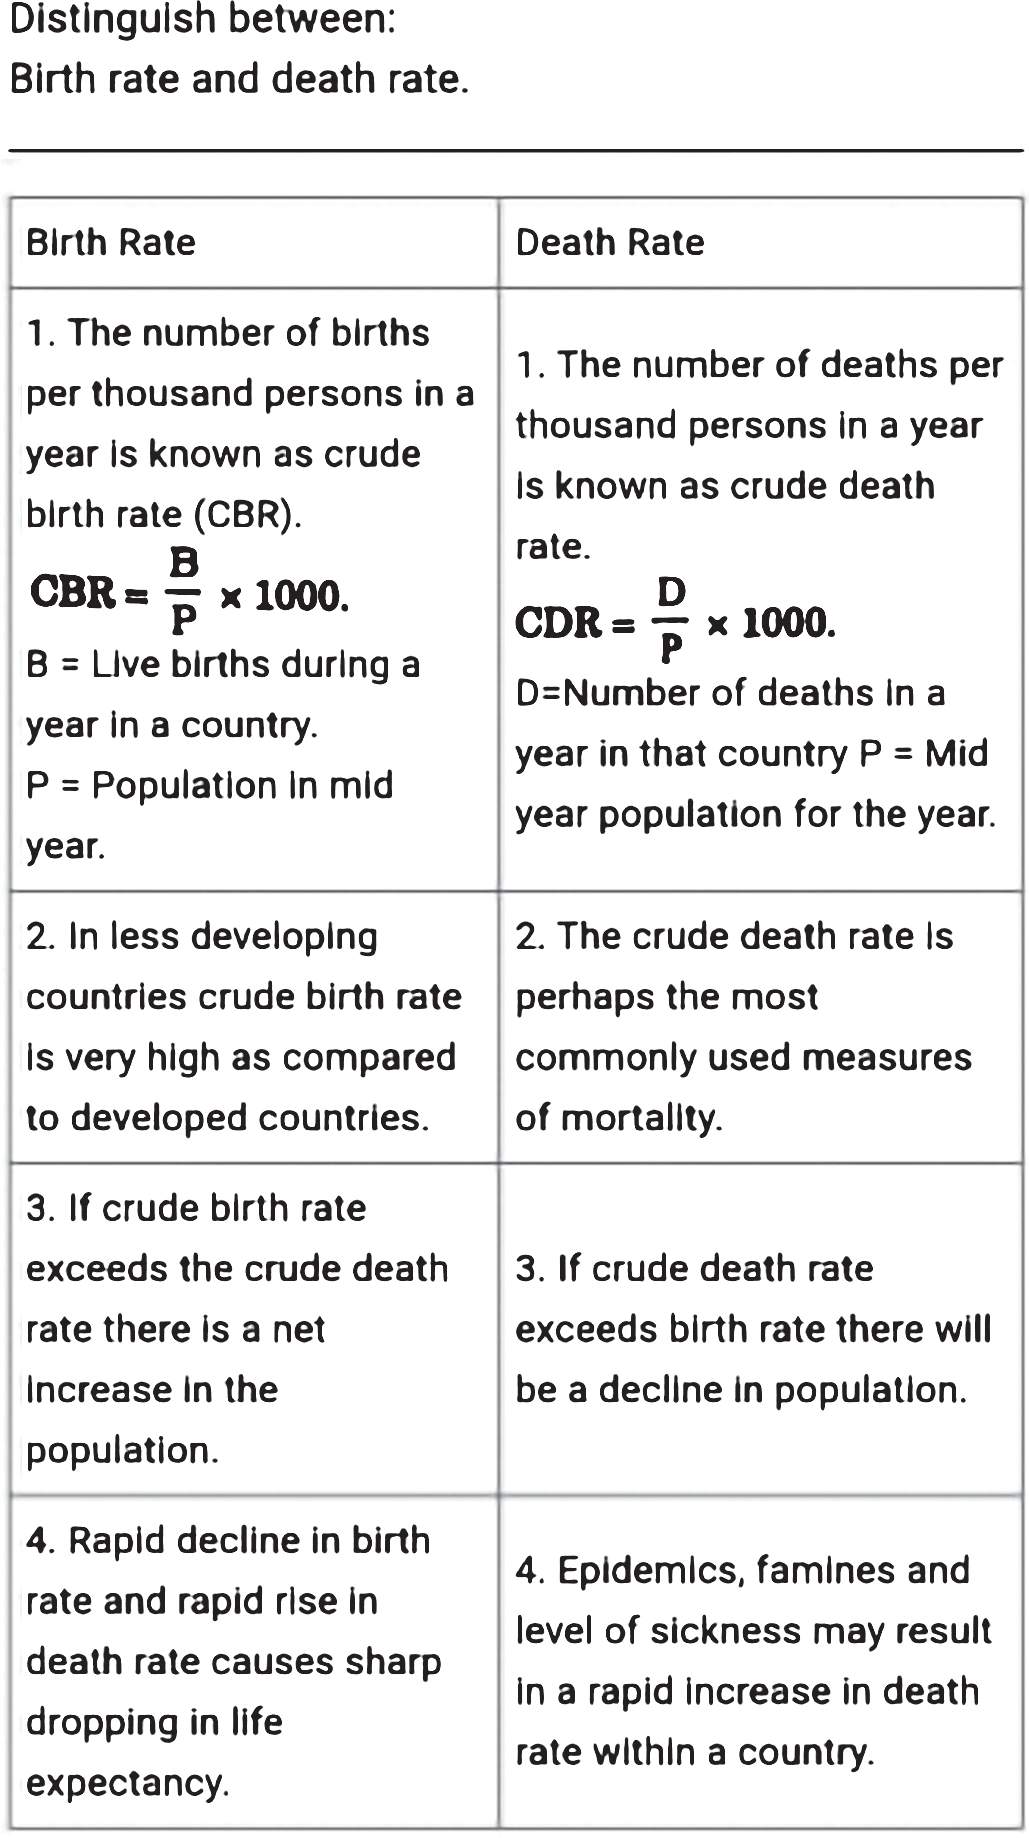
Crude Birth Rate (CBR)
The Crude Birth Rate is the number of live births occurring among the population of a given geographical area during a given year, per 1,000 mid-year total population of the given geographical area during the same year.
Birth in a year CBR = Number of Live Births / Population at mid- year 1000
The reason it is a ‘crude’ rate is because it includes all ages and both sexes in the denominator.
General Fertility Rate
This is the ratio of the total number of live births during a calendar year in a given geographical area to the total number of women (mid-year population) of child bearing ages (15-49 years) in that area. The equation of GFR is given below.
Birth during year GFR = Number of Live Births/ Number of Women of age 15 – 49 years at mid-year 1000
Age Specific Fertility Rate
The Age Specific Fertility Rate (ASFR) is the number of live births per women of a specific age-group (usually 5- year age groups from 15-19 to either 15-44, or 45-49 years) of the population of a given geographical area during a given year.
The equation for GFR estimation:
ASFR = Number of live births to women of a specific age group/ Mid-year women population in the same age group 1000
The ASFR is usually given for five-year age-group. In other words, the magnitude of age is five.
Total Fertility Rate
Total fertility rate (TFR) is defined as the sum of age specific fertility rates of women by single year of age from 15 to 44 years (or 15 to 49 years) and is expressed per woman. It is directly calculated as the sum of age-specific fertility rates (usually referring to women aged 15 to 49 years), or five times the sum if data are given in five-year age groups.
TFR = Sum of Age Specific Fertility Rate / Magnitude of Age Group 1000
The magnitude of age group is usually 5. The TFR also indicates the demographic situation.
Factors Affecting Fertility
Fertility is influenced by a range of factors, including nutrition, sexual behavior, culture, instincts, endocrinology, timing, economics, lifestyle, and emotions. These factors can be broadly categorized as follows:
Biological Factors: Biological factors, such as age and sex, directly impact fertility. The onset of menstruation in girls and menopause in women mark the biological boundaries of fertility. In some regions, dietary habits can lead to early puberty in girls, which increases the likelihood of early motherhood. Early exposure to sex and marriage often contributes to higher fertility rates.
Physiological Factors: Physiological factors like male impotence and female sterility also affect fertility. Conditions such as abortion and stillbirths further influence fertility, with the first pregnancy abortion sometimes leading to infertility. Additionally, drug use among younger generations is increasingly linked to infertility.
Religion: Religion plays a significant role in fertility within many societies. Cultural and social obligations, such as the desire for a son or the marriage of a daughter, often lead to early marriages and an increase in the number of children born. In communities practicing polygamy, like some Muslim populations, fertility rates tend to be higher. This, in turn, can impact women's education and health status in those societies.
Education: Education has a significant effect on fertility rates. In countries with high literacy rates, fertility tends to be lower. For example, Kerala, with its high literacy rate, has a lower fertility rate compared to other Indian states. Similarly, Sri Lanka, with its high literacy rate, experiences lower fertility rates compared to countries like Bangladesh, Pakistan, India, and Nepal.
Status of Women: Fertility is generally lower among educated and employed women compared to their uneducated and unemployed counterparts. Education and employment empower women, leading to decisions that result in fewer children.
Family Planning: Developed countries have been voluntarily adopting family planning measures. There
is a direct relationship between the rate of adoption of family planning services and the rate of fertility. There are also many other factors, such as the caste system, racial groups, customs, urbanization, and economic condition of families affect fertility.
Migration
Migration refers to the movement of people from one settlement to another, resulting in a change in their usual place of residence. Migrations are driven by push and pull factors.
Push factors are conditions that compel people to leave their place of origin.
Pull factors are conditions that attract people to a particular destination.
Major push factors include war, political instability, poverty, natural disasters, and lack of opportunities. On the other hand, pull factors include better opportunities, appealing prospects, fertile land, efficient transport and communication systems, and higher levels of urbanization and industrialization.
There are two types of migration i.e. internal migration and international migration.
Internal Migration
The process of urbanization is intrinsic to economic and social development and, in consequence, both developed and developing countries are in the process of shifting from predominantly rural to mostly urban societies. As per the Census, India had 45.6 crore migrants in 2011 (38% of the population) compared to 31.5 crore migrants in 2001 (31% of the population). Between 2001 and 2011, while population grew by 18%, the number of migrants increased by 45%. In 2011, 99% of total migration was internal and immigrants (international migrants) comprised 1%.
As per the 2011 census, there were 21 crore rural-rural migrants which formed 54% of classifiable internal migration (the Census did not classify 5.3 crore people as originating from either rural or urban areas). Rural-urban and urban-urban movement accounted for around 8 crore migrants each. There were around 3 crore urban-rural migrants (7% of classifiable internal migration).
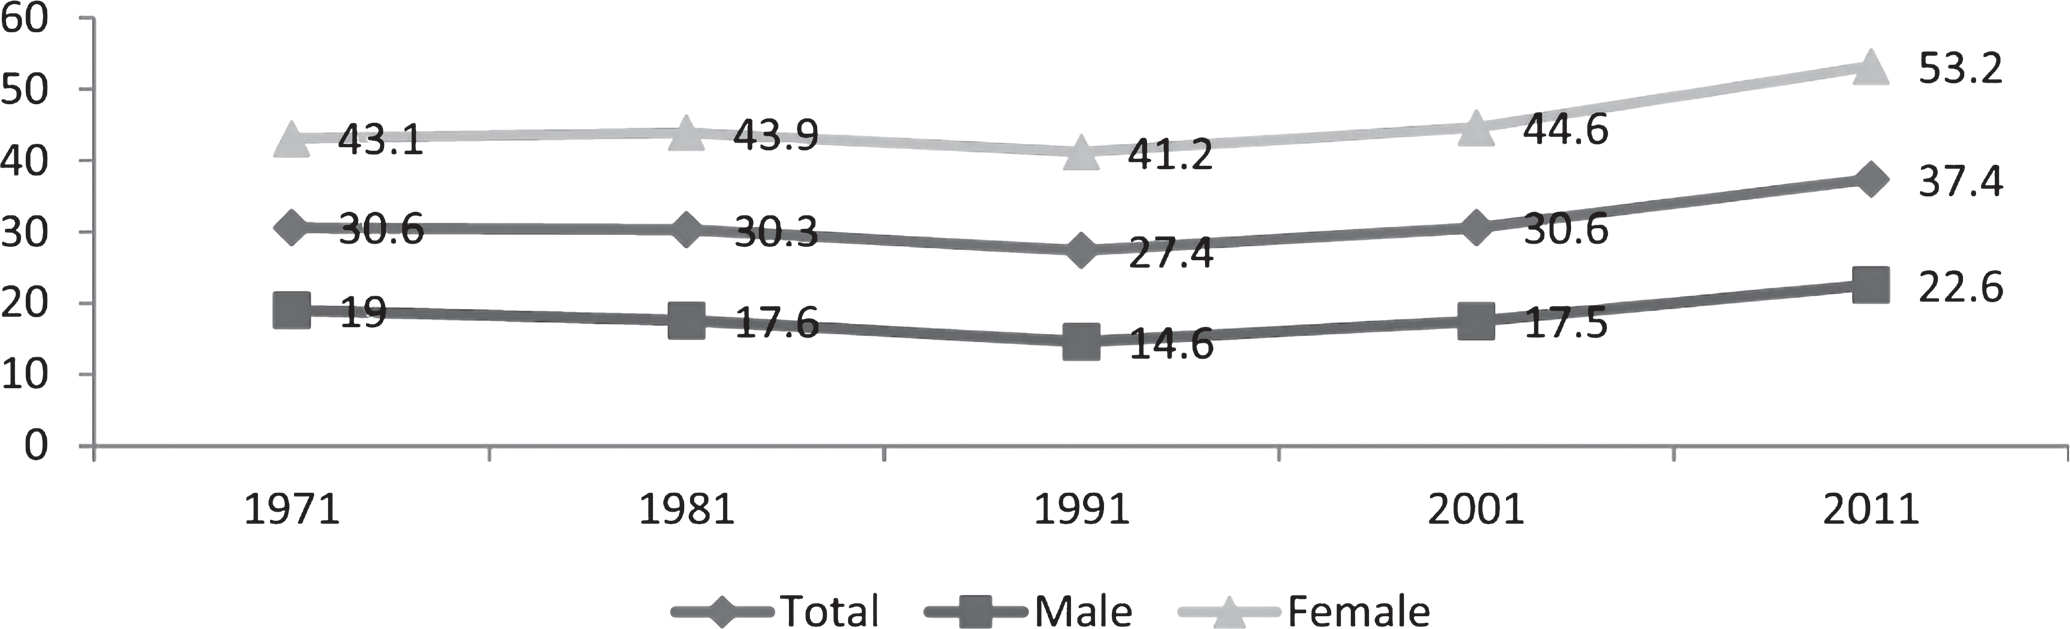
• Rural-Rural Migration
• In developing countries like India, rural-to-rural migration also involves a significant number of people. In short-distance rural-to-rural migration, most females migrate due to marriage.
• In long-distance migration, people often move from economically backward areas such as Bihar and Eastern Uttar Pradesh to economically advanced states like Punjab and Haryana to work as agricultural and allied field workers.
• Some even migrate as far as Jammu & Kashmir for the same reasons. This migration provides seasonal employment for many and full-time employment for some.
•
Rural-Urban Migration
• Urban growth in developing countries is primarily driven by rural poverty rather than urban prosperity.
• The expansion of urban slums is mainly caused by:
• Rapid rural population growth
• Unequal distribution of land
• Limited income opportunities
• Insufficient government investment in agriculture
• High unemployment rates in developing countries make job-seeking a major motivation for migration. As a result, many migrants end up in shanty towns and slums, which are marked by high unemployment, pollution, disease, social unrest, political instability, and, in many cases, violence.
• At least a third of Mumbai lives in slums, and Mexico City is surrounded by shanties and garbage dumps, lacks basic necessities like space, safe water, sanitation, waste collection, lighting, adequate housing, and other essentials.
• This leads to the spread of diseases, alienation and violence, and vulnerability to natural and industrial disaster.
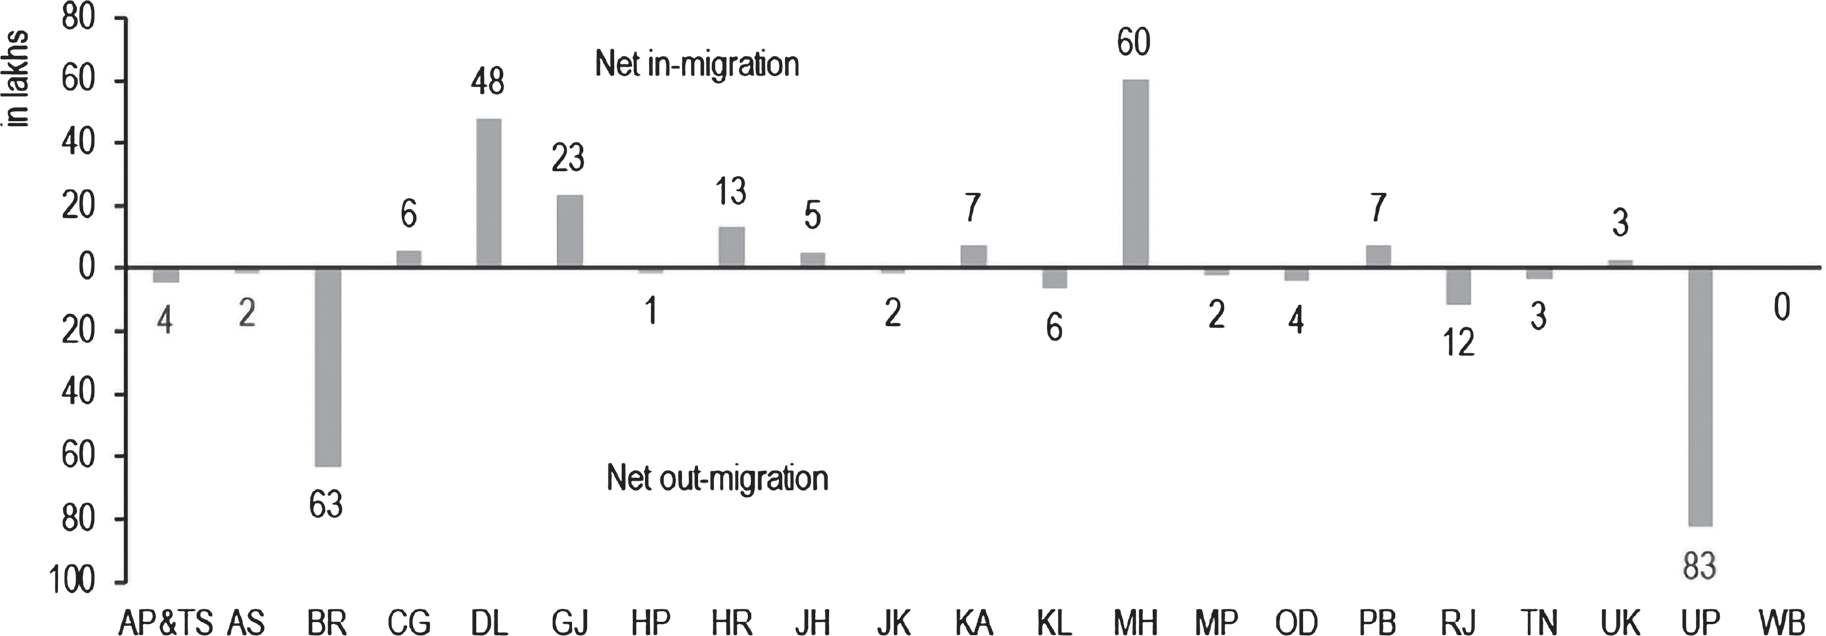
Migration can also be classified into two types: (i) intra-state and (ii) inter-state. In 2011, intra-state migration accounted for nearly 88% of all internal migration, involving 39.6 crore people.
There is variation in inter-state migration flows across different states. According to the 2011 Census, there were 5.4 crore inter-state migrants. As of 2011, Uttar Pradesh and Bihar were the largest sources of inter-state migration, while Maharashtra and Delhi were the primary destination states. Around 83 lakh people from Uttar Pradesh and 63 lakh from Bihar had migrated temporarily or permanently to other states. In total, approximately 60 lakh people from across India had moved to Maharashtra.
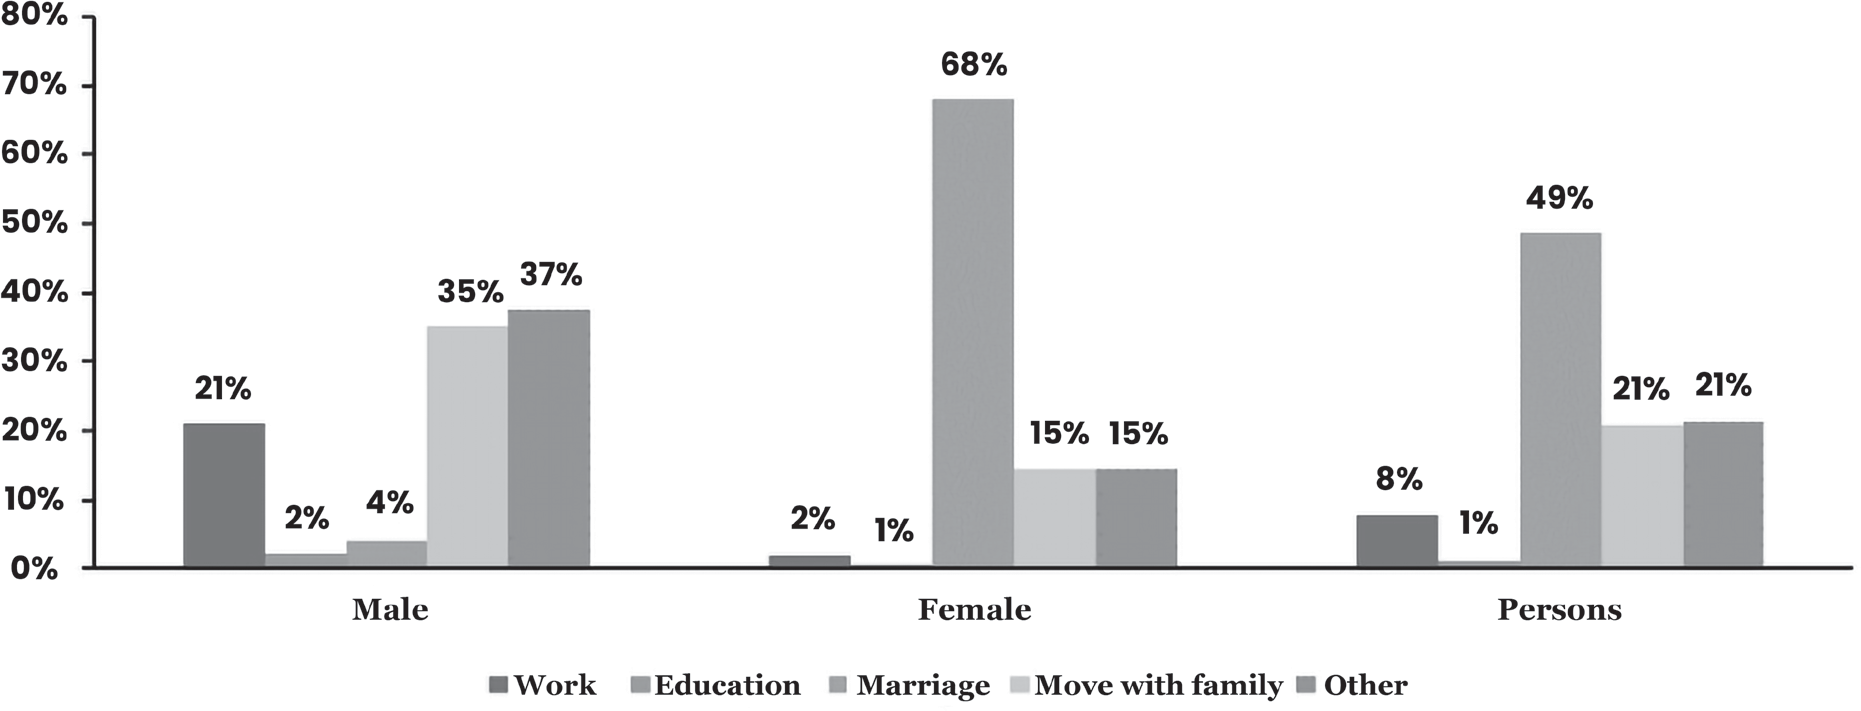
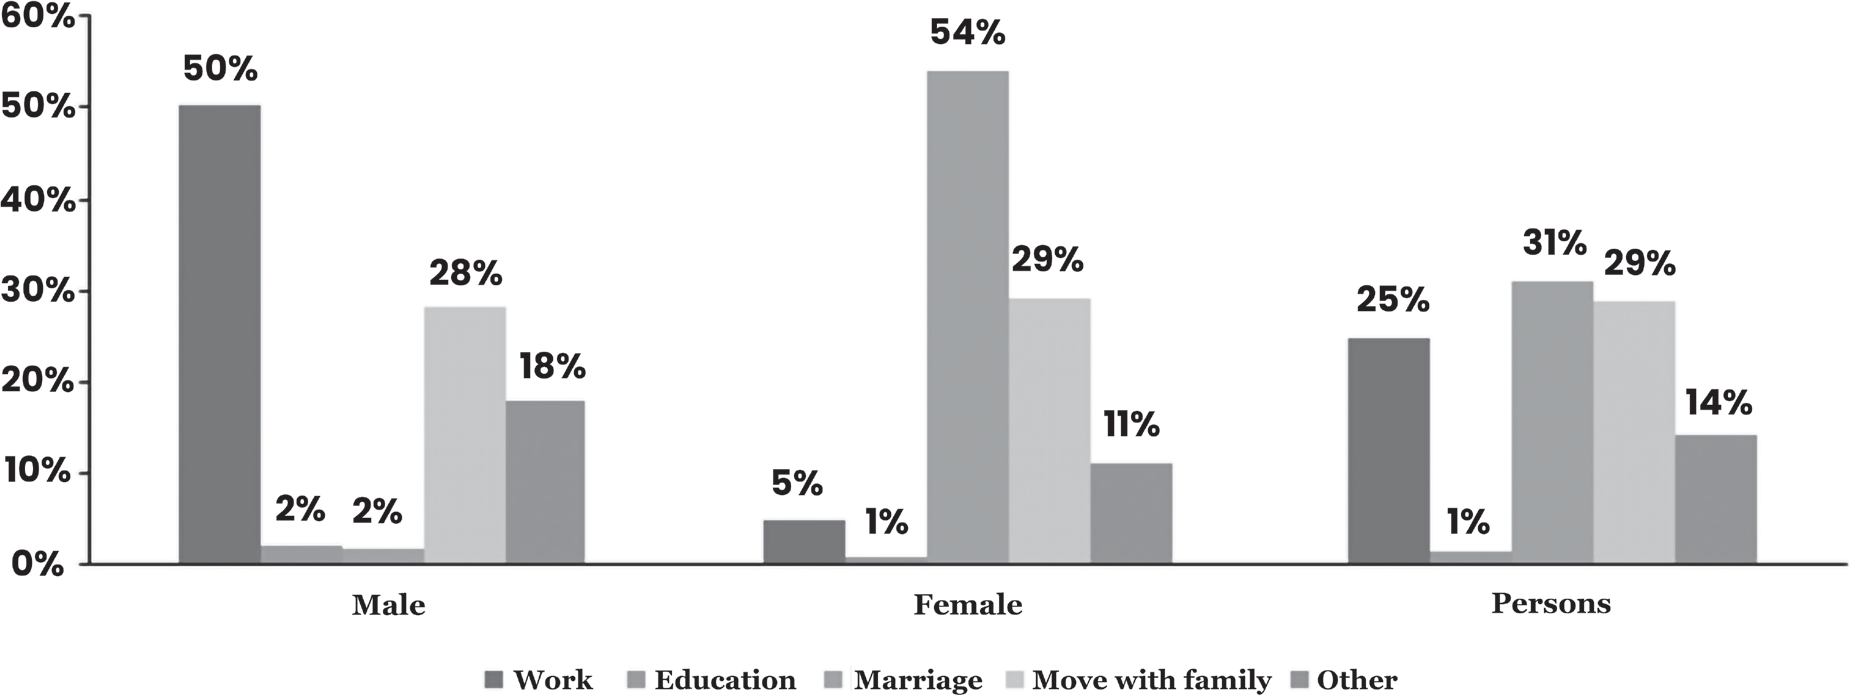
International Migration
International economic, political, and cultural interrelations play an important role in determining the flow of people between countries. In its diverse types, international migration is linked to such interrelations. International migration both affects, and is affected by, the development process. There are broadly two major patterns of international migration, South-South Migration and North-South Migration.
South-South Migration:
This migration typically occurs between newly industrializing countries and less economically developed countries at the periphery.
A defining characteristic of this migration is its circular nature, rather than being permanent.
Labor migration from poorer countries in the Global South to wealthier countries in the South is a key aspect of this pattern, reflecting the global structure influenced by globalization (Gould, 2009).
Most migrants in this category are unskilled or semi-skilled workers, employed in sectors like construction, maintenance, IT, and services.
Remittances in this migration are generally better than what migrants could earn in their home countries, although they may vary.
South- North Migration
In contrast, this migration pattern is mostly permanent, and the associated challenges differ significantly from those in the previous pattern.
Migrants in this scenario play a major role in various sectors of the economy, including transportation, healthcare, tourism, and certain manufacturing and service industries.
Remittances in this type of migration are generally higher compared to South-South migration. However, the host countries bear greater responsibility, as most migrants are permanent residents, often accompanied by their families.
As a result, host governments are required to allocate significant funds for education, family healthcare, pensions, and other social security programs.
One of the most noticeable negative impacts of South-North migration is the brain drain.
Case of COVID-19 Pandemic
In a report titled, “Migration in India 2020-21” of the Periodic Labour Force Survey under the aegis of the National Statistical Office (NSO), gives an account of the state of migration and migrants during the period of July 2020 to July 2021. The report, which surveyed a
total of 1,13,998 migrants, shows that 51.6% of rural migrants migrated from urban areas in the aftermath of the pandemic.
Not surprisingly, out of the total number of urban migrants that migrated after the lockdown, only 11% are women, mirroring a larger trend in the Indian society where it is mostly men who leave their hometowns in search of jobs in urban areas.
Causes of Population Growth
Increased Life Expectancy: While India’s average annual birth rate decreased from 42 per thousand in 1951 to 24.8 per thousand in 2011, the decadal death rate also declined significantly, dropping from 42.6 per thousand between 1901-1911 to 8.5 per thousand between 2001-2011. As of 2023, the average life expectancy (LER) is 70.15 years.
Due to the sharp decline in the death rate, India’s population has grown rapidly.
Lack of Health Services and Family Planning: In 2010- 11, the number of miscarriages (6.20 lakh) combined with the estimated number of births (2.05 crore) reveals that, even in this era of family planning, a woman in the 15-45 age group is, on average, pregnant at any given time.
This situation persists largely due to widespread illiteracy and lack of awareness about the benefits of family planning and the negative effects of overpopulation on society.
Early Marriage: Child marriage remains a significant social issue in our country. Many boys and girls are married at an age when they are unprepared for the responsibilities of family life, both socially, emotionally, physically, and mentally. Early marriage also contributes to higher infant mortality rates.
Lack of Education: The failure of family planning is closely linked to widespread illiteracy, which also drives early marriages, low status for women, and high child mortality rates.
Many are unaware of the various methods to control population growth, including contraceptive use and birth control measures.
Religious Reasons: People who hold conservative and orthodox views often oppose the use of family planning methods. In such families, women are typically discouraged from participating in family planning, as it is believed to go against divine will. Some women even argue that children are born according to God's will, and it is their destiny to bear children.
Muslim households generally have higher birth rates compared to Hindu communities. Surveys conducted among Muslims have shown that, despite awareness of modern family planning methods, most respondents—both men and women—oppose their use due to religious beliefs and a fatalistic outlook.
Compulsions Of Poverty: Poverty is another significant factor contributing to the population growth in our country. Many impoverished parents have more children not due to a lack of knowledge about contraceptives, but because they rely on their children to help support the family financially.
This is evident in the persistent issue of child labor in our country. If poor families were to stop their children from working, their family income would fall far short of covering their basic needs.
• Typically, illiterate and uneducated individuals tend to adopt the patriarchal belief system passed down through generations, leading them to have as many children as needed to support the family's income.
• In many poor families, there is a common practice of continuing to have children until they have a male child, as sons are traditionally seen as the primary breadwinners of the family.
Population Growth Good or Bad?
Sustained, rapid population growth adds to the challenge of achieving sustainable social and economic development and magnifies the scale of the investments and effort required to ensure that no one is left behind. Further, in general, rapid population growth is both a cause and a symptom of slow progress in development.
However, there is a divergence of opinion, about population growth and its implications. There are two broad lines of arguments. One group argues that population growth is not the real problem. The other group argues that it is a real problem. The first one is an optimistic view, whereas the latter is a pessimistic view.
Population Growth is not a Real Problem
Three general lines of argument from the developing countries, who assert that:
• The problem is not population growth, but some other issue;
• Population growth is a deliberately created false issue, and
• For many countries and regions population growth is, in fact, desirable (Todaro & Smith, 2009).
• The Problem is Not Population Growth but ‘Some Other Issue’. These are:
• Underdevelopment: if correct strategies are pursued which lead to higher levels of living, greater esteem, and expanded freedom, then population will take care of itself.
• Like in economically advanced nations, else for the impoverished, uneducated, and physically and psychologically weak, the large family will constitute the only real source of social security.
• World Resource Depletion and Environmental Destruction: The fact is that the developed countries, with less than 25 per cent of the world’s population, consume almost 80 per cent of the world’s resources.
• Thus, the developed nations should curtail their high consumption standards. The developing nations’ high fertility is really due to their low levels of living.
• Population Distribution: It is not numbers but their distribution in space which is the real issue. Many regions of the world (e.g., parts of sub- Saharan Africa, northeast and Amazon regions of Brazil) are, in fact, under populated while others (e.g., central Java, Mumbai, etc.) are too concentrated.
• Thus, need is to reduce rural-urban migration and to bring about a more rational spatial distribution of the population in terms of available land and other productive resources.
• Subordination of women: Population growth is a natural outcome of women’s lack of economic opportunity.
• The argument is that if women’s health, education, and economic wellbeing are improved along with their role and status in the family and the community, these empowered women will inevitably lead to smaller families and lower population growth.
•
A Deliberately Created False Issue
• This line of argument is closely allied to the dependence theory of underdevelopment. Basically, it is argued that the frantic over concern in the rich nations is to maintain the status quo for their own self-interest.
• Rich countries are pressuring poor nations to adopt aggressive population control programmes, even though they themselves went through a period of sizable population increase which accelerated their own development processes.
• Racist or genocidal prejudice against largely non- white populations of the world, who may someday pose a serious threat to the welfare of the rich, predominantly white populations.
• Population Growth is Desirable Phenomena
• A more conventional economic argument is that population is desirable to stimulate economic development.
• Larger populations provide the needed consumer demand to generate favourable economies of scale in production, to lower production costs and to provide a sufficient and low-cost labour supply to achieve higher output levels.
• Moreover, it is argued that many rural regions in the developing countries of tropical Africa and Latin America and even parts of Asia are under populated in the sense that there is much unused but arable land that could yield large increases in agricultural output if only more people were available to cultivate it.
• Three other non-economic arguments include:
• First, many countries claim a need to populate border regions against any expansionist intentions of neighbouring nations.
• Second, there are many ethnic, racial and religious groups within developing countries whose differential attitudes towards family size have to be protected both for moral and political reasons.
• Finally, military and political power is often seen as dependent on a large and youthful population.
Population Growth is a Real Problem
Unrestrained population increase is seen as the major crisis facing mankind today. It is claimed to be the principal cause of poverty, low levels of living, malnutrition and ill-health, environmental degradation, and a wide array of other social
problems. Value-laden and incendiary words, such as the ‘population bomb’ or ‘population explosion’ are tossed around at will. Indeed, dire predictions of world food catastrophes and ecological disaster are attributed almost entirely to the growth in numbers.
Empirical Arguments in support of Negative Consequences of Population Growth:
• Research has established that population growth has a negative impact on economic development by way of hampering various sectors like education, health, environment, food, economic growth (Todaro & Smith, 2009).
• Increasing Poverty: The landless poor suffer the most and first from cuts in government health and education programme, bear the brunt of environmental damage and are the main victims of job cut due to the slower growth of the economy.
• Retarding Economic Growth: Evidence shows that rapid population growth lowers per capita income growth particularly in countries that are
already poor and mostly agrarian based economy.
• Poverty: The growing population is deepening poverty in India as there is a scarcity of resources along with inequality.
• Also, people have to spend a large share of their resources for bringing up their dependents.
• Problems of Food Scarcity and Security: Rapid increase of population poses serious challenges to provide foods (both, in terms of quantity and quality) to billions of people in developing countries.
• New technologies have to be invented because fertile lands have already been cultivated and food production levels have saturation.
• Education: Studies reveal that large family and low income leads to a preference for male children.
• Quality of education is also adversely affected as the government has less funds to address, equally, the need for all learners, and this directly affects the development of human capital.
• Health: High fertility harms health of mothers and children. It also increases the health risk of pregnant mothers.
• It not only affects mothers but also affects newborns, in terms of low birth weight as well as increased infant mortality rate.
Relationship between Population Growth and Economic Growth
• In the 1970s numerous empirical studies, utilising the growing volume of comparable international data, failed to detect a robust relationship between national population growth rates and per capita income growth. Indeed, researchers maintained that long run effects were positive.
• This more sanguine view influenced the policy position of the US government at the World Population Conference in Mexico City in 1984— namely that “population growth is, by itself, a neutral phenomenon [with respect to economic growth]”.
• This view arguably contributed to a major fall in international funding for family planning programs, beginning in the 1990s.
• However, in the 1990s researchers made two significant discoveries that questioned the neutrality of population growth with respect to economic development.
• First, analyses of the remarkable economic trajectory of East Asian countries in the late 20th century suggested a sizeable fraction of their
impressive economic growth was attributable to high levels of savings and investment facilitated by earlier fertility declines.
Second, new research suggested that there was in fact a negative association between population growth and economic performance.
When fertility rates decline over a sustained period of time the proportion of the working age population (i.e., over 15) grows relative to
the economically dependent youth population.
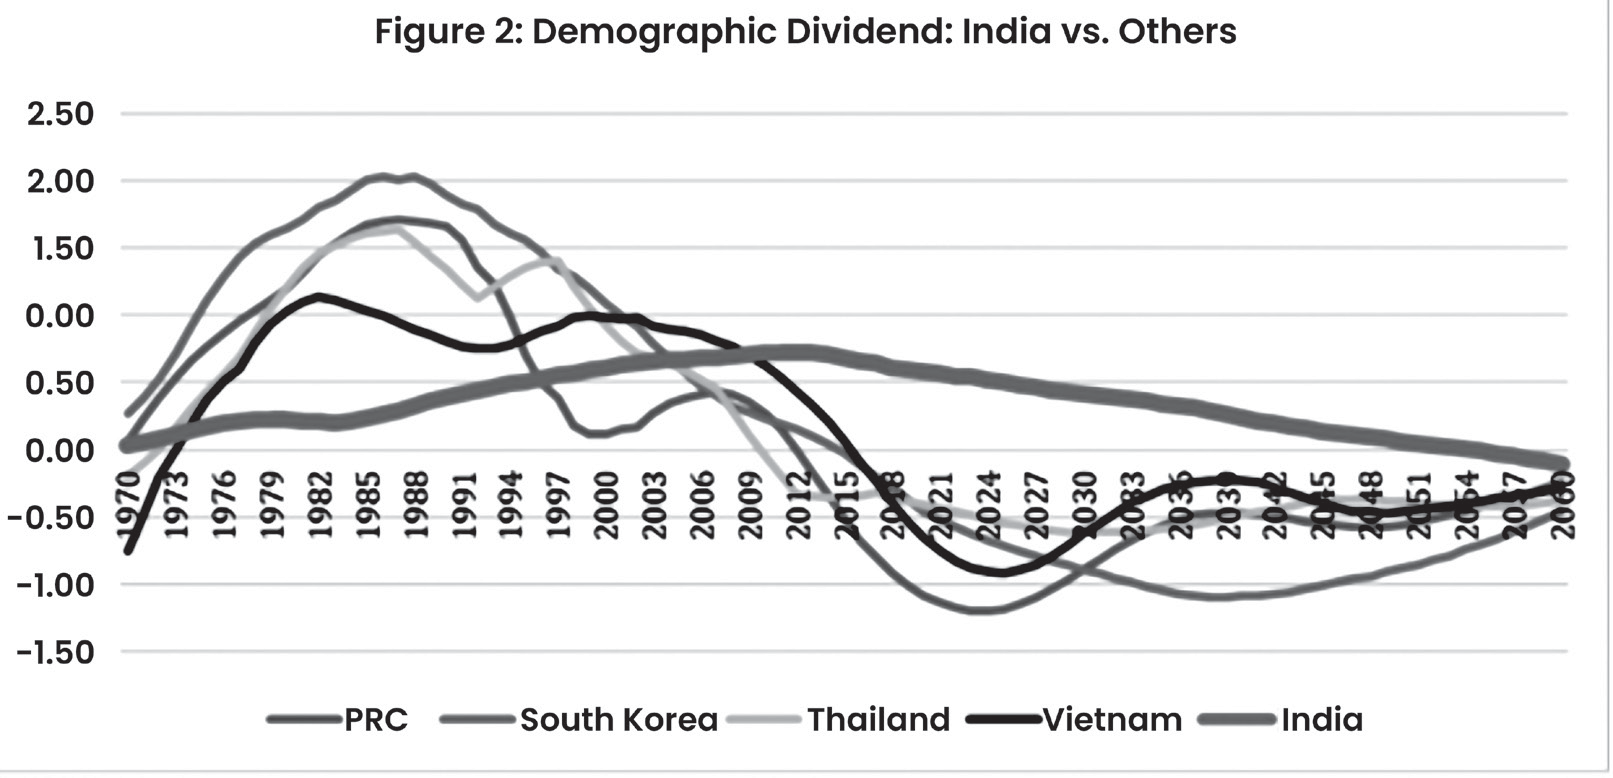
This change in age composition creates a window of opportunity to raise its level of savings and investment—a phenomenon now known as the ‘demographic dividend’.
This finding prompted a subsequent reconsideration of the potential importance of reducing fertility in pursuit of growth.
• Thus, raising demography remains more important than ever in a post-2008 global economy.
Demographic Dividend for India
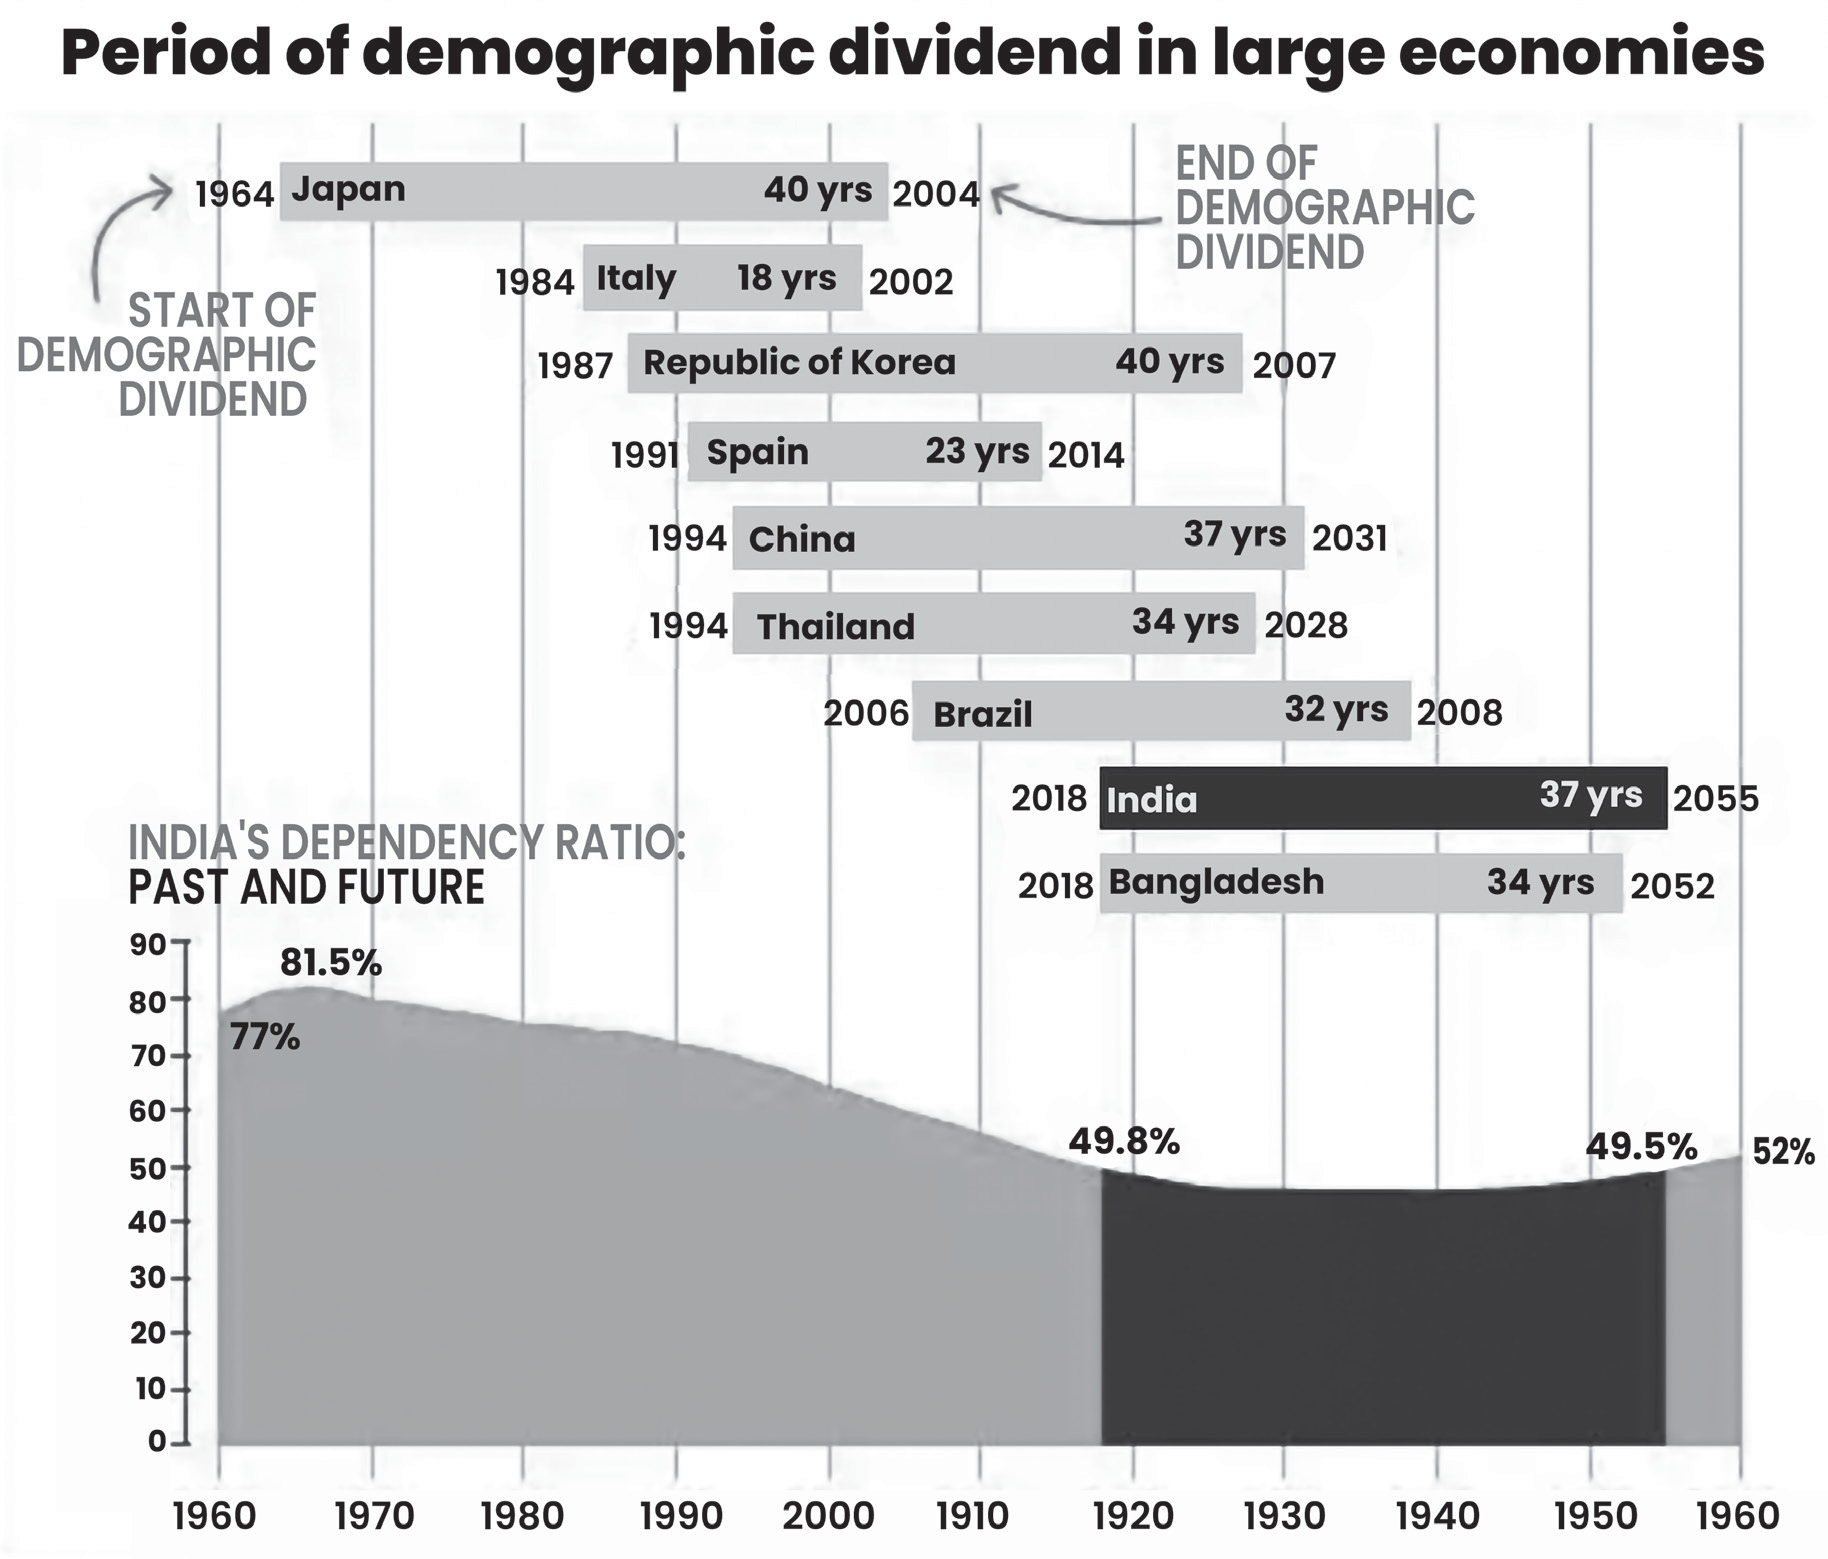
The United Nations Population Fund (UNFPA) defines "Demographic Dividend" as the growth potential arising from changes in a population’s age structure. This shift typically occurs when a decline in fertility rates (the number of births per woman) follows the stabilization of life expectancy. Several Asian economies, including Japan, China, and South Korea, have successfully harnessed this "demographic dividend."
In the late 20th century, the demographic dividend contributed to a seven-fold increase in GDP in countries like Singapore, South Korea, and Hong Kong. However,
in Latin America, the growth was only two-fold. This highlights that while changes in population structure can contribute to growth, they are not enough on their own to drive it.
The UNFPA emphasizes that countries can only fully leverage the economic potential of a youth-heavy population by providing adequate health services, quality education, and decent employment opportunities for all.
Meanwhile, projections have India reaching a peak workforce age population near the year 2050:
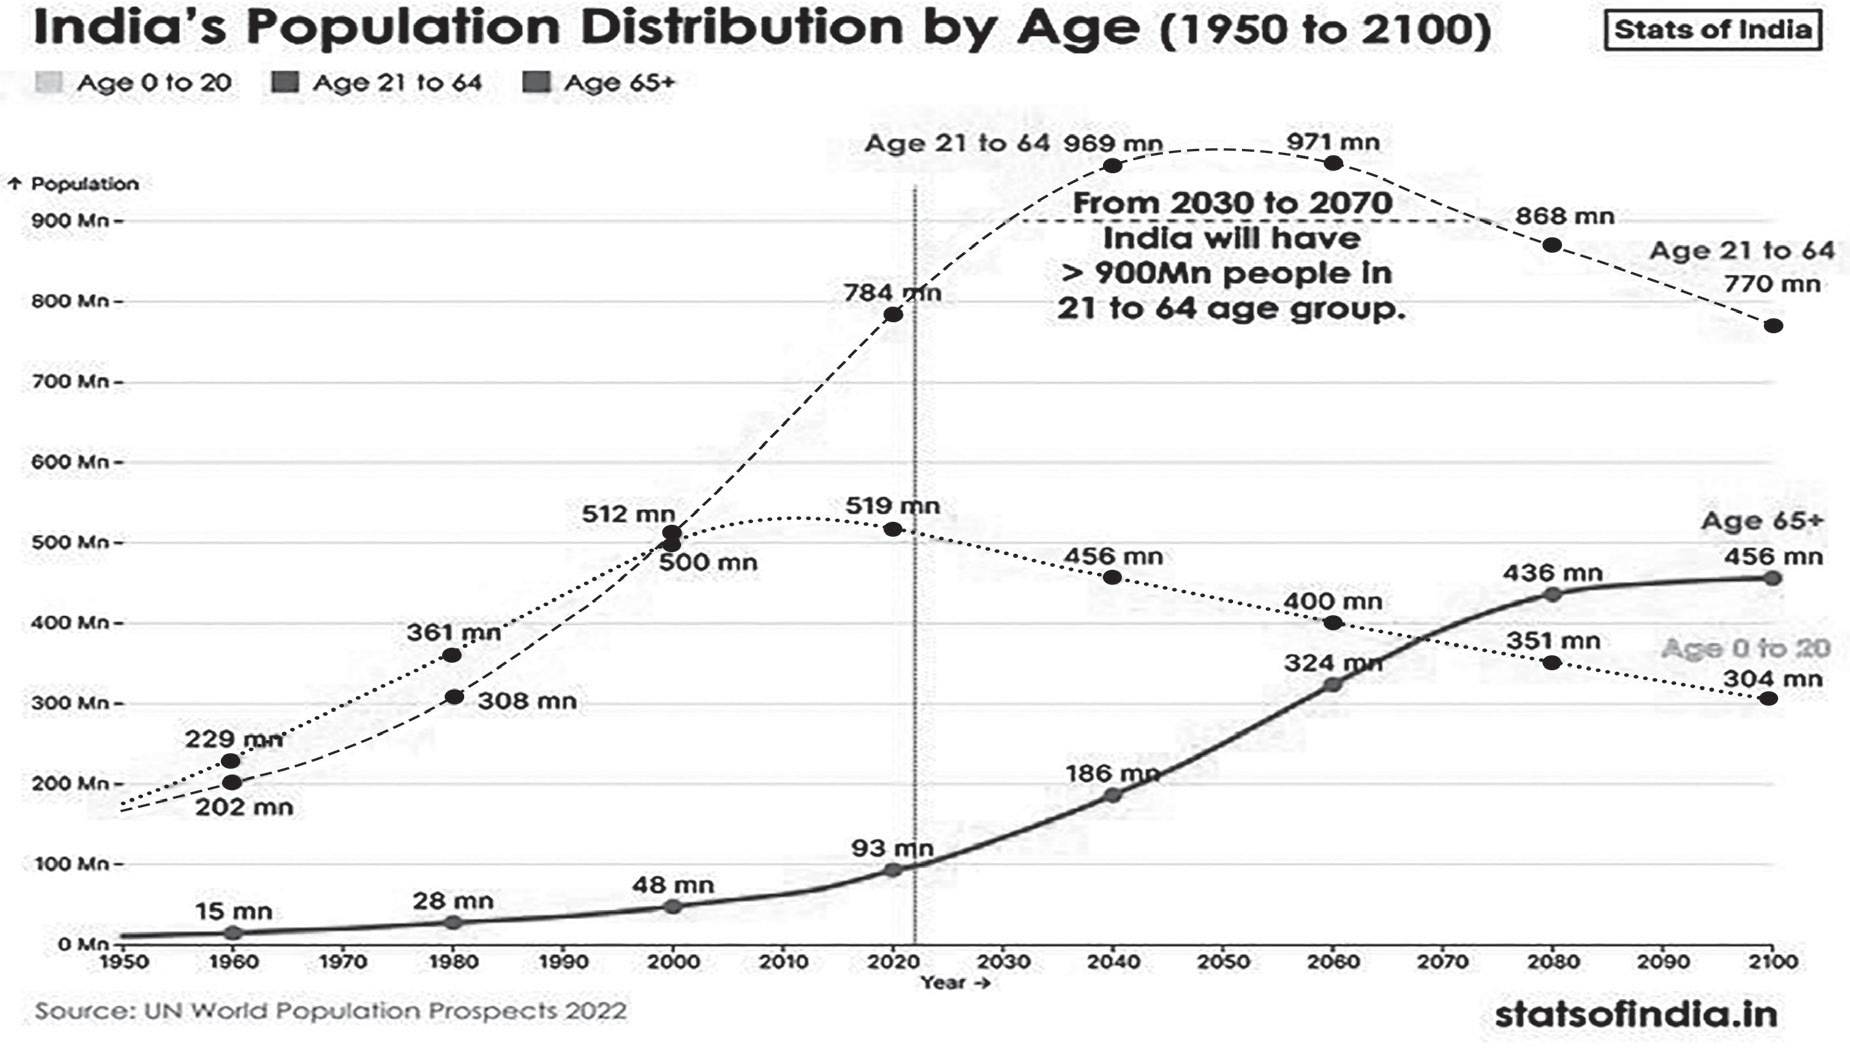
By the year 2050, it’s estimated that India’s workforce age population will be comparable in size to that of China’s today
— over 800 million people strong.
However, given that this is about 25 years in the future, it raises all kinds of questions around the economic relevance of a “working age” population in a landscape potentially dominated by technologies such as artificial intelligence and automation. Further there are varying estimates of the peaking of young population by various agencies.
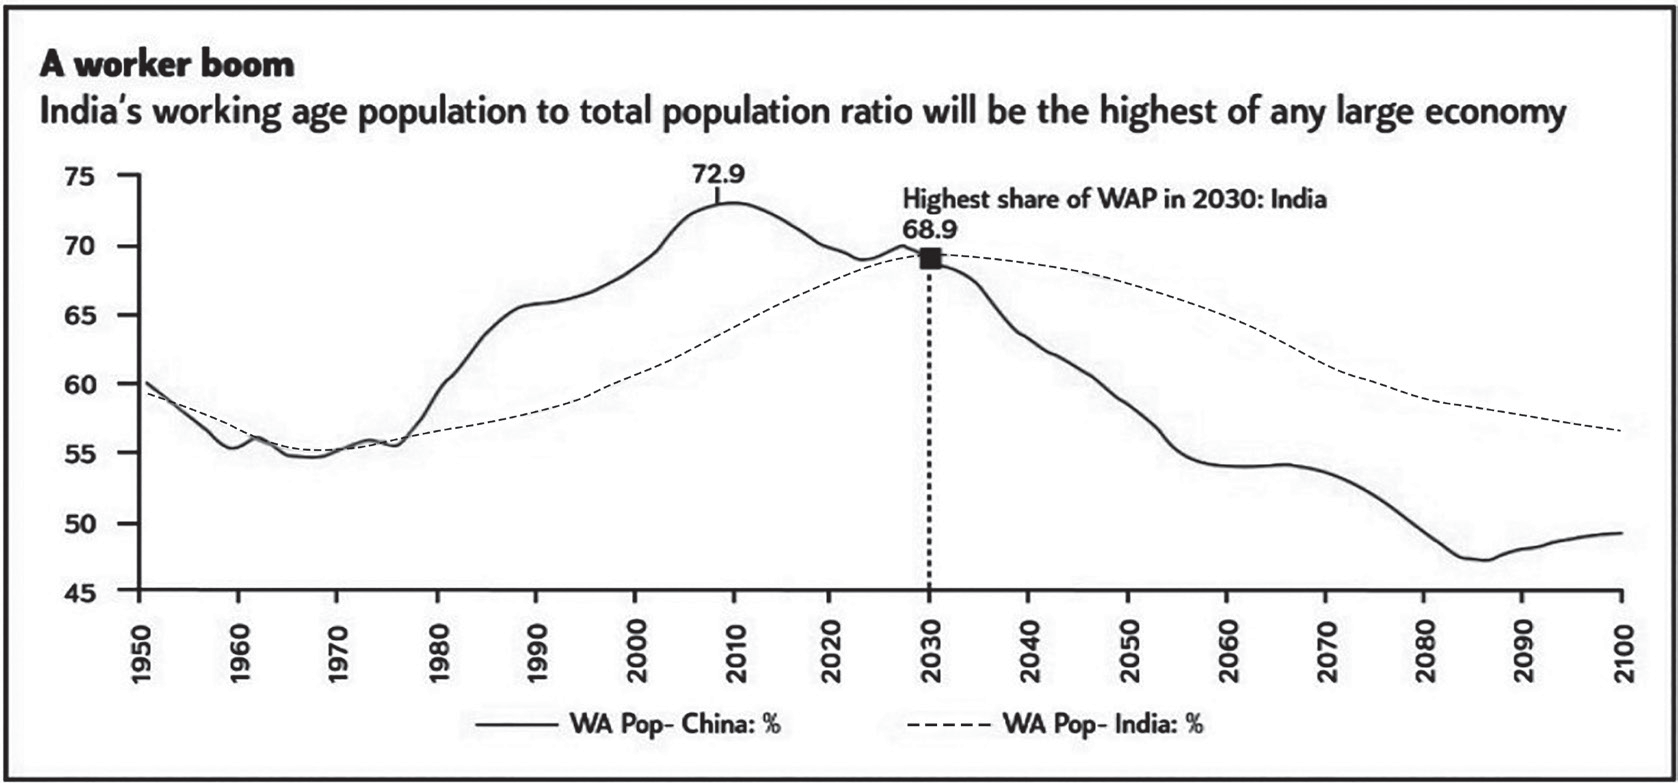
According a 2023 report of Earnst & Young, in absolute numbers, India will have 1.04 billion working age persons by 2030. Share of India’s working age population to total population will reach its highest level at 68.9% by 2030. By the year 2030, India’s dependency ratio is projected to reach its lowest point at 31.2%.
Advantages of Demographic Dividend for India
GDP Growth: The potential impact of India’s growing population on its GDP growth will depend on several factors, including the overall population growth rate, the size of the working-age population, and how
effectively this population can be integrated into productive employment.
Youthful Workforce: With a relatively young population (median age of 28.4 years), India enjoys a competitive global advantage in terms of its workforce, which can drive economic growth.
Higher Consumption and Demand: A young population presents an opportunity to harness increased consumption, particularly in discretionary spending, fueling demand across various sectors of the economy.
With continued macro-economic growth and growing population, consumption expenditure is expected to continue to grow at high rates and an important driver of economic growth.
Indian consumers are gradually opening up to credit driven consumption. The uptake in credit from scheduled commercial banks underscores this trend. From 2016-17 to 2021-22, outstanding personal loans of scheduled commercial banks more than doubled from INR 16.2t to INR 33.85t (~ US$ 423b).
Digital Economy will further fuel the consumption story.
Female Labour Force Participation: Although the Labor Force Participation Rate (LFPR) for females has declined in recent years, it is expected to rise moving forward. Currently, nearly 49% of higher education enrollment consists of female students. With this increasing trend, India can anticipate a significant rise in women’s participation in the workforce in the coming years.
Providing Skilled Professionals: India boasts the largest pool of graduates in Science, Technology, Engineering, and Mathematics (STEM), many of whom are English-speaking. This gives India a distinct advantage compared to other demographics, much like its success in the IT and BPO sectors.
Opportunity for other sectors: Various sectors like construction, public services, labour intensive
manufacturing, services such as trade, transport and tourism, e-commerce, and other utility services in urban centres will be benefited. These are the sectors where unskilled and semiskilled labour can easily be deployed.
The size and age of a country’s workforce plays a huge role in its economic growth, and when complemented by new-present-age skills and a strong entrepreneurial spirit, would define the country’s progress. Alongside, it is also critical to ensure that the working age population in general, is suitably educated and skilled for jobs of the future. Added to this is the ability to support a competitive manufacturing opportunity in India to address the global supply chain and the domestic consumption market.
Challenges for India’s Demographic Dividend
India, now the most populous country in the world, faces numerous challenges, including addressing the ongoing health crisis, creating more job opportunities, managing macroeconomic instability, and tackling climate change. However, India also has a valuable advantage: its youthful demographic. This provides the country with the potential for faster economic growth compared to both China and the US. At the same time, the outbreak of the Covid-19 pandemic, which the World Health Organization (WHO) declared a global emergency, has unintentionally caused economic stagnation.
Major Challenges for the Demographic Dividend include:
• India's challenge lies in fostering faster economic growth and generating productive jobs outside of agriculture, particularly in organized manufacturing and services, all while enhancing agricultural productivity. Whether we
can reap this demographic dividend to the nation’s advantage or let it become a curse depends on two factors-
• Drastic quality improvement in this new workforce by much better education, health and skill development
• Creating better livelihood opportunities
• Low Quality of Human Capital: According to the National Mission for Skill Development (2015), India faces a significant shortage of well-trained and skilled workers. A large portion of the educated workforce lacks job-specific skills, making them largely unemployable. To address this, India must scale up its skill training initiatives to meet the demands of employers and drive economic growth.
• Low Human Development Parameters : India ranks 130th out of 189 countries on the UNDP's Human Development Index, highlighting a concerning gap in development.
• Social Issues like caste discrimination, gender inequality, religious divisions, and rising polarization often hinder the swift realization of the country’s demographic potential.
• Economic issues like widening income gap between the rich and the poor, low expenditure on education and healthcare, etc. It plays a major role in the poor productivity and performance of working population.
• Informal Nature of Economy in India is another hurdle in reaping the benefits of demographic transition in India as it forces the incomes and wages to be low and poor working conditions perpetuating ‘low-income trap’ for the youth.
• Jobless growth- Rising De-industrialization due to excessive rise in Services sector, De-globalization due to emerging conservatism across the globe against free trade and creation of trade blocks like RCEP, the Fourth Industrial Revolution (IR) bringing new technologies of automation and technological progress.
• As per the NSSO Periodic Labour Force Survey 2017-18, India’s labour force participation rate for the age-group 15-59 years is around 53%, that is, around half of the working age population is jobless.
• High compliance burden on new startups, as still more than 50 permits are required to start a new business, along with poor contract enforcement creates hurdles in realising the demographic dividend.
• Governance issues like law-and-order situations, communal and caste incidents, inefficient and slow legal system- contribute to the poor standard of living of the masses. Around 5 crore cases are pending the
judiciary and average time period for resolution of cases is five years. This seriously damages the Ease of Doing Business.
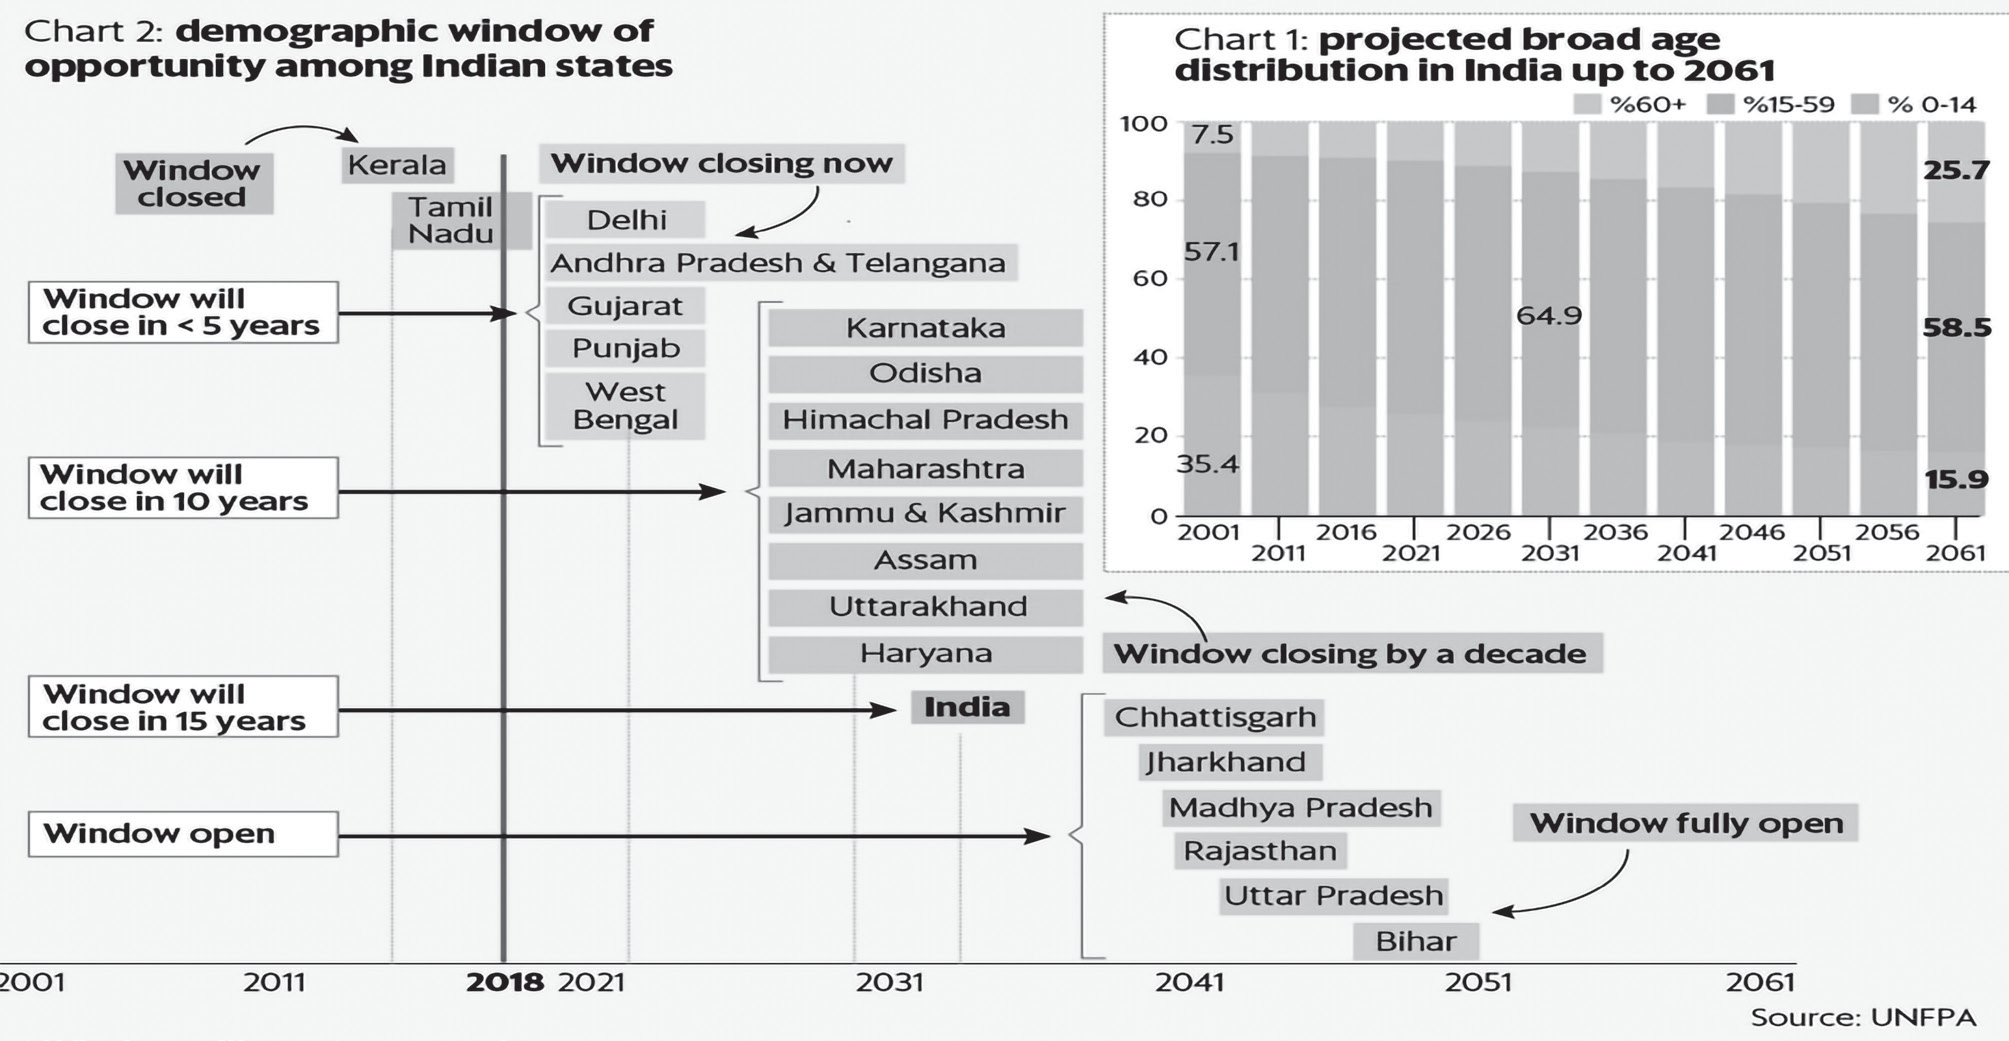
• Asymmetric demography: The growth in the working-age ratio is likely to be concentrated in the poorest states who have low. This creates challenges of unbalanced demography and issues for policy implementation.
Steps Taken by the Government to Reap Demographic Dividend
To harness the benefits of the demographic dividend, the Government has launched several policy initiatives, programs, and systemic reforms. Efforts are being made to equip the youth with the skills required by today’s industries, aiming to bridge the demand and supply gaps, though this remains a challenging task.
• National Skill Development Corporation (NSDC): Established on 31st July 2008, NSDC is a pioneering Public-Private Partnership (PPP) initiative aimed at improving and upgrading the skills of India’s growing workforce through skill development programs.
• A significant portion of the unorganized sector lacks access to training programs and development workshops. To address this, NSDC provides funding for skill training initiatives, conducts research to identify skill gaps in the workforce, and works on developing accreditation standards.
• National Skill Development Agency: Skill development efforts in India are currently being managed by about 20 ministries, 35 state governments and union territories, and the private sector.
• The Office of the Advisor to the Prime Minister on PM’s National Council on Skill Development has been set up with the mandate to:
• Developing strategies for skill development at both the national and state levels.
• Identifying skill gaps and creating solutions to address these shortages.
• Discovering new areas of employment and promoting skill development in those sectors.
• Encouraging the use of Information and Communications Technology (ICT) in skill development.
• Formulating and executing action plans to generate employment opportunities within the country and meet global human resource needs.
• Under the National Skill Certification and Money Reward Scheme encouragement is given for skill development for youth by providing monetary rewards for successful completion of approved training programs.
Impact of COVID-19
• Effect on Migrant Labour: The International Labour Organization in its report describes the coronavirus pandemic as ‘the worst global crisis since World War II’.
• As half of the world is in lockdown, it is going to be a loss of 195 million full-time jobs or 6.7 per cent of working hours globally.
• Rise in Poverty: About 400 million people (76.2% of the total workforce) working in the informal economy in India are at a risk of falling deeper into poverty due to catastrophic consequences of the virus.
• Health, Nutrition and Education: According to a study by UNDP, the global epidemic has led to fears that the child population in developing countries will quickly go hungry and malnourished.
• The lockdown is likely to increase child labour due to the closure of economic activity and the closure of schools.
• Examining the current trends in Covid-19 from an Indian perspective is likely to increase the challenge of demographic dividend
• Impact on Human Development: As per Census 2011, out of the total housing units in India, 40 per cent of household units live in only one room. According to International Labour Organization (ILO), the campaign to stop child labour will go back 2 to 5 years.
The epidemic will weaken India’s demographic dividend process. At present, for states like Bihar, Odisha, Uttar Pradesh and Jharkhand, there are good opportunities for demographic dividend after 2025. If the effects of Covid-19 can be controlled quickly and multifaceted, the potential for demographic dividend is likely to be sustained.
Way Forward to Reap India’s Demographic Dividend
Countries such as Singapore, Taiwan, and South Korea have demonstrated how to effectively leverage the demographic dividend to drive remarkable economic growth. By implementing forward-thinking policies
and programs that focus on empowering youth through education, skills development, and healthcare choices, these nations have set valuable examples. India can draw important lessons from their experiences to capitalize on its own demographic potential.
• Updated Data on Consumption: The first step is to conduct an updated National Transfer Accounts (NTA) assessment. India’s per capita consumption is significantly lower than that of other Asian countries. For example, a child in India consumes about 60% of the consumption of an adult aged 20 to 64, while a child in China consumes roughly 85% of a prime-age adult’s consumption.
• The NTA data for India should be updated to
reflect the progress made on such investments since 2011-12.
• Additionally, state-specific NTAs should be calculated annually, and states should be ranked based on their investments in youth development.
• Focus on Early Childhood: The second is to invest more in children and adolescents. India ranks poorly in Asia in terms of private and public human capital spending. Need is more in nutrition and learning during early childhood.
• Given that India’s workforce starts at a younger age, a greater focus needs to be on transitioning from secondary education to universal skilling and entrepreneurship, as done in South Korea.
• Greater Public Health Spending: The third is to make health investments. Health spending has not kept pace with India’s economic growth. The public spending on health has remained flat at around 1% of GDP.
• Evidence suggests that better health facilitates improved economic production. Hence, it is important to draft policies to promote health during the demographic dividend.
• We need more finance for health as well as better health facilities from the available funding.
• Rights Based Approach: The fourth priority is to ensure that reproductive healthcare services are accessible through a rights-based approach. This includes providing universal access to high-quality primary education and essential healthcare services.
• According to the latest National Family Health Survey-5 (2019-21), India has an unmet need for family planning at 9.4%, which is significantly higher compared to 3.3% in China and 6.6% in South Korea. This gap needs to be addressed
• Gender Equality: Fifth, education plays a crucial role in addressing gender disparities. The gender gap in education remains a significant concern.
• In India, boys are more likely to be enrolled in secondary and tertiary education than girls.
• In contrast, countries like the Philippines, China, and Thailand have the opposite trend.
• In Japan, South Korea, and Indonesia, gender differences in education are minimal. This disparity in India needs to be corrected.
• Female Workforce Participation: Sixth, India must boost female workforce participation. As of 2019, only 20.3% of women were employed or seeking work, a significant drop from 34.1% in 2003-04. To fully leverage its $3 trillion economy, India urgently needs to provide new opportunities and skill development for women and girls.
• For example, a girl who finishes Class 10 should have access to a variety of skill-based learning options to help her secure suitable employment. She will also need safe transportation to commute to work.
• Gaining employment will likely delay her marriage, allowing her to participate more actively
in the economy and make informed choices about her life and rights.
• South Korea’s female workforce participation rate of 50% has been built on
• Legally compulsory gender budgeting to analyse gender disaggregated data and its impact on policies
• Increasing childcare benefits
• Boosting tax incentives for part-time work
• It is predicted that if all women engaged in domestic duties in India who are willing to work had a job, female labour force participation would increase by about 20%.
• State Demography-specific Policy Design and Implementation: Seventh, India must address the demographic disparities across its States. Southern States, which have already made significant progress in demographic transition, are seeing a higher percentage of elderly citizens. In contrast, the north-central region remains a key source of India's workforce. To manage this, promoting cooperative federalism is essential for achieving better outcomes.
• Effective inter-ministerial coordination is crucial for strategic planning, investment, monitoring, and making necessary adjustments to ensure the success of such policy and governance frameworks.
Demographic Path: India vs China
China and India together account for one-third of the world’s population and are home to some of the largest global megacities. In 2019, both countries reported identical real GDP growth rates of 6.1%, according to early IMF estimates. While there are notable similarities between the two most populous nations, their demographic trajectories are currently diverging in significant ways.
| Demographic Path of India By 2050, India will add roughly 270 million more citizens India is following a more traditional natural demographic path where its demographic bulge will expand till 2030 and reach its peak around 2050 and then start to decline. India will have lesser weight of ageing population as India’s dependency ratio would be at 19.6 per cent by 2050. | Demographic Path of China China’s total will actually decrease by 30 million by 2050. China’s population has already plateaued, due to policy interventions and will eventually decline over the remainder of the 21st century. Higher weight of an aging population will create additional social and economic pressures. By 2050, it’s estimated that over one-third of the country will be 60 years or older. |
India's population is expected to peak at around 1.6 to 1.7 billion people before undergoing the demographic transition already seen in more developed regions like North America, Europe, and Japan.
As the country's workforce age group grows to over 800 million, India will face significant challenges, particularly with the global shift toward automation and the evolving role of labour.
Measures to Check Population Growth
Population policy may be defined as deliberately constructed or modified institutional arrangements and/or specific programs through which governments influence, directly or indirectly, demographic change (Demeny, 2002). In simpler terms, population policy is a strategy for achieving a particular pattern of demographic change. The change could be both quantitative as well as qualitative. Policies can broadly group those for developed countries and other for developing countries.
Population Policy Models in Developed Countries
• In developed countries, though birth control measures have been universally adopted for a long time, yet, there are very few countries that have formulated an explicit national policy on population growth.
• On the other hand, there are many European countries that still follow pro-natalist policy due to their concern about declining population. But, indirectly population-related issues are reflected in various other policies enacted for economy, health and welfare measures.
• Some of those laws relate to the availability of contraceptives, sterilizations, abortions, marriage, divorce, income taxes, family allowances, and immigration (Chandna, 2008).
• In developed countries, a quite different demographic phenomenon has begun to attract increasing attention: fertility levels that are inadequate for the long-term maintenance of the population. This fertility trend was detected earlier also, especially in Europe, in
the 1920s and 1930s.
• But, in the decades immediately following World War II, the baby boom seemed to make the issue of low fertility moot. The baby boom was, however, a temporary interruption of the downward trend in fertility.
• By the 1970s, the net reproduction rate was at, or below, unity in most countries in Europe, and also in the United States.
• In the US, fertility stabilized at, or very close to, that rate, but in Europe, fertility continued to decline.
• If continued, in the absence of large compensatory immigration this would not only lead to rapid population decline, but also result in very high proportions of the population at old ages.
• Surprisingly, most governments as well as the general public tend to view below-replacement fertility with equanimity quite unlike the alarmed
reaction that the same phenomenon elicited between the two World Wars. And, explicit pro-natalist policies, common in the 1930s, are conspicuous by their absence.
• Among the factors explaining the low level of fertility despite general material Population affluence, many observers point to the double burden on women of both raising children and working outside the home.
• To the extent that higher birth rates are seen to be socially desirable, the derived policy prescription is to adopt measures that make motherhood and women’s
labour force participation more compatible.
• The higher fertility in countries, notably in Scandinavia, where such measures are strongly applied, compared to countries of Southern Europe, where they are largely absent, suggests that enhanced compatibility (through day care services, flexible work hours,
liberal sick leave allowances, and the like) is an effective pro-natalist policy, even if motivated by other considerations.
• But it is far from clear whether the fertility differential so generated is high enough to bring the total fertility rate back to replacement level.
Population Policy in Developing Countries
Since the 1950's, the population policy in the developing world has become essentially synonymous with family planning programs.
Financial and administrative limitations within developing countries necessitated the heavy involvement of foreign assistance in launching and sustaining family planning programs.
Declared demand for birth control does not necessarily into effective translate willingness to practice it: conflicting desires may interfere.
Weakness of measures of latent demand, or "unmet need", is reflected in the requirements that Rrogrammes are supposed to satisfy if they are to be successful.
These, typically, included such items as
1. Doorstep accessibility of quality
2. Broad choice of contraceptive methods.
3. Forceful IEC [information, education, and communication] programs.
4. Sound financing strategies.
5. Sound management with proper logistics.
6. Evaluation Systems.
7. A continuous process of strategic thinking, planning and management,
8. Staff leadership for program parameters (Mahler 1992:5).
The effectiveness of family planning programs in reducing fertility remains a matter of controversy
According to international guidelines, programs recruit their clients on a strictly voluntary basis. By accepting the service voluntarily, the individual acceptor demonstrates that they value that service.
• But some of the more successful programs, notably in Asia, tended to increase acceptance by often heavy- handed methods of persuasion, and, in the especially
important case of China, by coercion backed by legal
sanctions.
• Where fertility fell in less developed countries with active family planning programs, it is typically found that program-provided free services account for a large per centage of those practicing contraception.
• But what would have happened in the absence of the program is conjectural. Some less developed countries that lacked government programs also experienced major falls in fertility. Brazil is a conspicuous example.
• Similarly, if programs have seemingly only minor success in reducing fertility, this can be taken as evidence that the program is inadequately financed, organized, and managed.
Population Policy of India
• In India, the experience is mixed. India was the first country in the world to introduce a National Family Planning Policy in 1952. It was basically voluntary in nature, except during a short emergency period, and target-based in approach.
• Regional Divide: During the 1991 Census, it was observed that there is a clear-cut regional demographic divide between Northern BIMARU (BI stands for undivided Bihar, MA stands for undivided Madhya Pradesh, R stands for Rajasthan and U stands for undivided Uttar Pradesh) States in comparison to southern states of Kerala and Tamil Nadu.
• Major factors responsible for this are differences in literacy, particularly female literacy, and health care facilities.
• Paradigm Shift: In 1994 International Conference on Population and Development, supported the view that rapid population growth in poor countries under conditions of high fertility is inimical to many development goals” (Cassen,1994). But later, at Cairo conference, it was formally replaced by the argument that the family planning programs satisfy important health needs and help people exercise a fundamental human right.
• Family planning programs were redefined, instead, as reproductive health programs, responding to a broader range of women’s health needs, such as prevention of unsafe abortions and sexually transmitted diseases, including HIV/AIDS.
•
New emphasis was put on women’s empowerment through reduction of infant and maternal mortality and improvement in girls’ education and women’s opportunities for employment and political participation.
• These are conditions that are likely to help reduce the birth rate through stimulating the demand for smaller family size.
• National Population Policy, 2000 (NPP 2000): The policy was formulated based on the recommendations of Dr. MS Swaminathan Expert Group. It affirms the commitment of government towards voluntary and informed choice and consent of citizens while availing of reproductive health care services, and continuation of the target free approach in administering family planning services.
• Medium-term objective of the NPP 2000 was to reduce the Total Fertility Rate (TFR) to replacement levels at 2.1 children per woman by 2010.
• Long-term objective is “to achieve a stable population by 2045, at a level consistent with the requirements of sustainable economic growth, social development, and environmental protection.”
• Other Targets include
• Making school education free and compulsory up to the age of 14 years and also reducing the dropout rates of both boys and girls.
• Decreasing the Infant Mortality Rate (IMR) to under 30 per 1000 live births in the country (to be achieved by 2010 as prescribed when the NPP was brought out).
• Reducing the Maternal Mortality Rate (MMR) to under 100 per 1 lakh live births (to be achieved by 2010 as prescribed when the NPP was brought out).
• Achieving universal immunization for all children against vaccine preventable diseases.
• Encouraging delayed marriage for girls (preferably before 18 years and above 20 years).
• Achieving 80 per cent institutional deliveries
and 100 per cent deliveries by trained persons.
• Attaining 100per cent registration of pregnancies, births, deaths and marriages.
Specific Measures Needed to Check Population Decisions of individuals, families, communities and the nations regarding population matters will have their implications for development at micro and macro levels and overall quality of life of people.
At the national level, decisions related to population change increasing or decreasing it are a matter of population policy. However, the emphases in these policies and programmes vary from nation to nation based on the political, social and cultural, environmental and other aspects
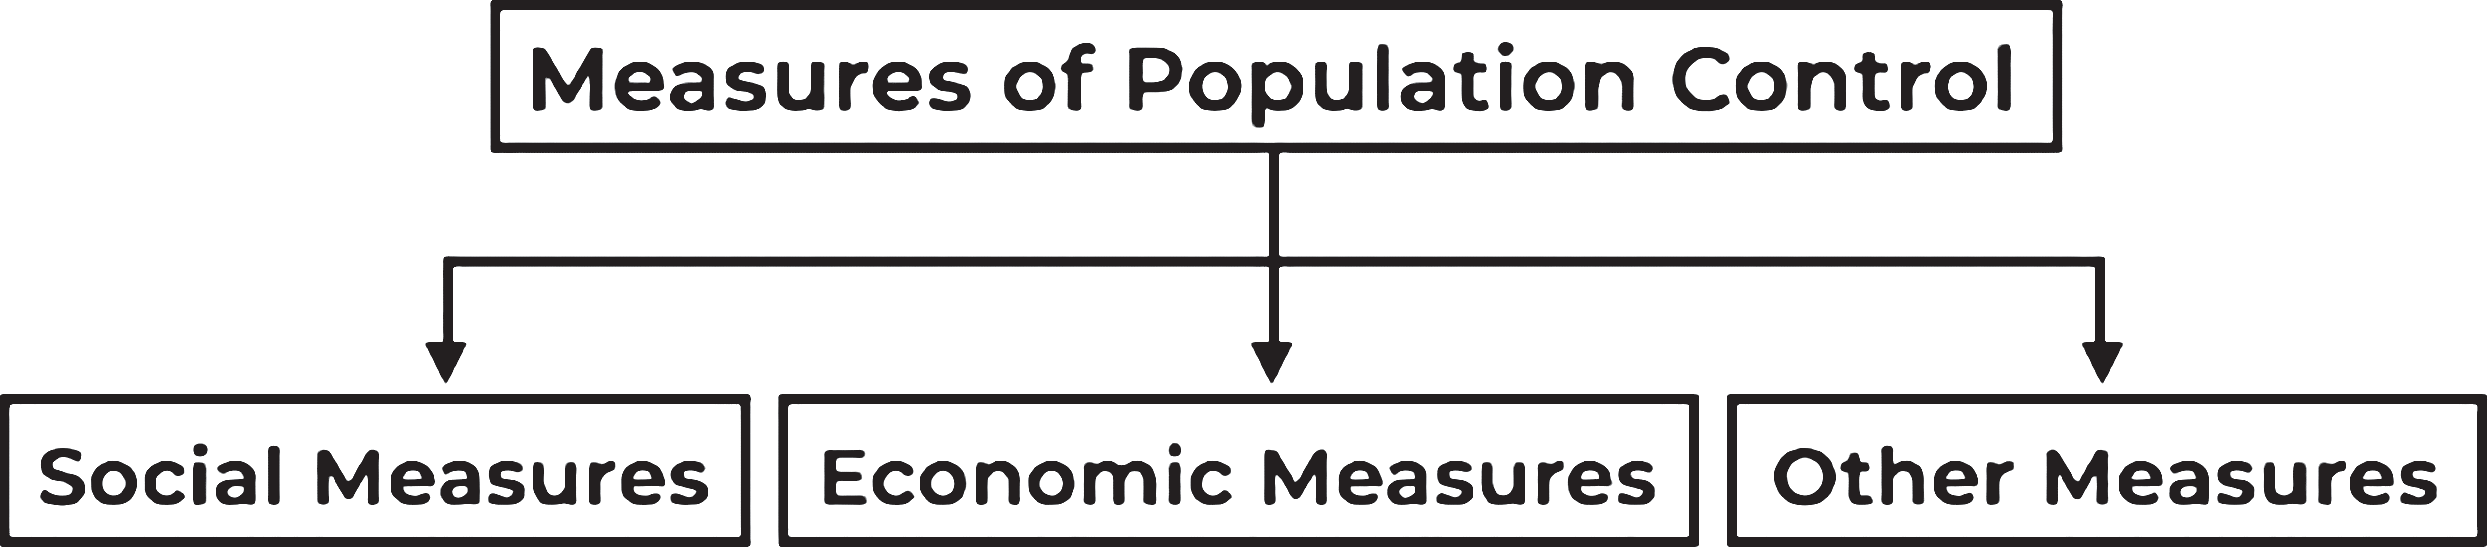
Social Measures:
• Population Education: Educating the youth about the benefits of smaller family sizes can foster positive changes in attitudes, habits, and behaviors, ultimately helping to control population growth.
• Raising the Legal Age of Marriage: Since fertility rates are closely linked to the age of marriage, the legal age for marriage should be increased. In India, the legal marriage age for men is 21, while for women it is 18.
• Early marriage limits individuals’ awareness of family planning and the importance of population control. In 2020, a government task force was set up to review the possibility of raising the marriage age for women from 18 to 21, and they recommended this change.
• Social Security: Expanding coverage of social security schemes can reduce dependency on children during old age, illness, or unemployment. By ensuring that
people have access to such services, the desire for larger families may decrease.
• Healthcare System: Developing nations, including India, face challenges with their healthcare systems. Consequently, a significant urban-rural divide.
• Rural areas often lack adequate healthcare, contributing to high infant mortality rates. This disparity encourages families in rural areas to have more children as a safety net.
• Standard of Women : It is crucial to improve the status of women in our country. By providing them with education, raising awareness about their health, and empowering them beyond traditional roles of childbearing and rearing, we can significantly contribute to slowing down population growth.
• Women need to grow socially and economically for that to happen.
• Literacy: Illiteracy contributes to population growth. Educated individuals tend to have smaller families, are more informed about contraceptive methods, and understand the implications of having larger families.
• Contraceptives: Contraceptive methods should be made more affordable and accessible. The stigma surrounding their use must be eliminated, and people need to be educated on the importance and benefits of family planning.
• Spreading Awareness: The advantages of family planning should be promoted widely through mass media. It is essential to highlight how population growth can contribute to illiteracy, poor health, and malnutrition, and to raise awareness of these issues to foster better understanding.
• Social Outlook: A shift in societal attitudes is needed. Marriage should not be viewed as an obligatory social norm, and women without children should not face stigma or discrimination.
Economic Measures:
• Development of Agriculture and Industry: Proper development of agriculture and industry can generate significant employment opportunities. As people's incomes rise, their standard of living improves, and they are more likely to embrace the norm of smaller families.
• Standard of Living: A higher standard of living often discourages large families. People tend to prefer smaller families in order to maintain their elevated lifestyle. For instance, research by A.K. Das Gupta shows that individuals earning less than Rs. 100 per month typically have an average of 3.4 children, while those earning over Rs. 300 per month have an average of 2.8 children.
• Urbanization: Studies show that urban areas tend to have lower birth rates compared to rural areas. Encouraging urbanization can therefore be an effective strategy for population control.
Other Measures:
• Publicity : Communication channels such as television, radio, and newspapers are effective tools for spreading the benefits of family planning, especially to uneducated and illiterate individuals in rural and underdeveloped areas of the country.
• Incentives: The government can offer various incentives to encourage people to adopt birth control methods. These could include financial rewards, along with other benefits like paid leave or promotions for employees who follow family planning practices.
• Employment to Women: Providing women with more employment opportunities is another key strategy for controlling population growth. Incentives should be
offered to women in various fields, and with increasing participation in competitive exams, more women are entering professions such as teaching, medicine, and banking. In short, implementing these measures can help manage population growth effectively.
Population Education
Population Education in many countries has emerged in response to population problems and issues, and in particular as part of their policies. It is an indirect means to attain national demographic goals by influencing the people’s knowledge, attitudes and practices or behaviour.
One of the formidable challenges in India is our rapidly growing population, which offsets every endeavour for development. From 1960 to 2023 the population of India increased from 450.55 million to 1.43 billion people. This is a growth of 216.5 per cent in 63 years. The current population of India in 2023 is about 1.43 billion, world’s most populous country in 2023, a 0.81per cent increase from 2022. The United Nations expects the population to peak around 2064, and then decline gradually.
Hence, Population Education needs to be given top priority especially at the grassroots level in a country, where 50% of the population is below 18 years, marriage is almost universal, where literacy rate is just about 80%, where the standard of living is low and unemployment is on a higher side. Population Education seems to be most relevant. However, it should be noted that assertions like ‘a small family is a happy family’ are not universally true for there are many instances of bigger families being happy families.
Definition:
According to UNESCO, "Population Education is an educational program that examines the population situation at the family, community, national, and global levels. The goal is to foster rational and responsible attitudes and behaviors among students toward these population issues."
The National Seminar on Population Education, held in Bombay, provides a detailed definition. It states, "Population education is closely linked to human resource development. It goes beyond simply raising population awareness; it also focuses on cultivating values and attitudes that address both the quality and quantity of the population. It helps students understand the cause-and-effect relationships, enabling them to make informed decisions regarding their own behaviors on population-related matters."
In conclusion, population education is about exploring knowledge and shaping attitudes towards population issues, family life, reproductive education, and fundamental values.
The Objectives of Population Education are:
• To develop rational attitudes, values and skills to take responsible and informed decisions regarding family and population for improving quality of life.
• Making Learners aware of the interrelationships
between population and sustainable development.
• Developing in them an understanding of the criticality of essentials conditions of population stabilization for better quality of life of present and future generations.
• Making them understand the crucial aspects of adolescent reproductive health, focusing on the elements of process of growing ups and implications of HIV/AIDS and drug abuse.
• Inculcating in them rational attitude towards sex, drugs and promoting respect for the opposite sex.
• To enable the students to appreciate the fact that for preserving the health and welfare of the members of the family and to ensure good prospects for the younger generation, the Indian families of today and tomorrow should be small and compact.
• To give accurate information to the students about the effect of changes in family size and in national population on the individual.
Features of Population Education:
• It is an Educational Programme designed to make learners understand the inter-relationship among population situation, change, development and aspects of quality of human life.
• Its ultimate goal is to make learners contribute to the improvement of the quality of human life, now and in some future time.
• It is Population Problem-Centred, hence lends itself to discovery and inquiry learning processes. If the population related problems are non-existent then the question of population education does not arise at all.
• It is a Value-laden Subject, hence more open to the use of values-clarification approach to learning,
i.e. to pose realistic alternatives, to examine consequences of each alternative and to enable learners to make sound decisions for action on population issues.
• Population education, thus, is more sensitive and warrants skilful handling of it in multi-lingual, multi-religious, and multi-racial societies or nations.
•
It is multi-Disciplinary and derives its content from demography, population studies, biology, statistics, sociology, psychology, economics and other disciplines.
Measures Needed for Implementation:
• Education has a great motivational force to perform for controlling over population. Suitable educational measures need to adopted to promote desirable changes.
• Population Education be made a part of School Curriculum.
• The success of this programme depends on the teachers. Hence, s/he must be property trained.
• Community forums and voluntary organisations like NGOs, ASHA workers, Anganwadi workers, Self Help Groups, etc. should be involved apart from local gram panchayats should discuss the drawbacks
of large families and the merits of small families.
• Children in the elementary stage should also be taught through their courses of study, the merits of small family and demerits of large family and should develop favourable attitude and appreciation for having a small family when they become adults.
• Boys and girls at the secondary stage should be given the knowledge in a scientific way about the reproductive biology system and the sex-hygiene.
• Parent-teacher associations can also take the responsibility of educating the families.
• Schools should assume the responsibility of educating the community and the families and should collaborate with other agencies for the education of the masses for having small families.
• Incentives like tax benefits, educational credit, insurance benefits, etc to promote small family norm.
• Female Literacy is among the most crucial aspects of Population Education as female education and health have been proved to be an effective check on family size.
• Programmes:
• Population Education programme is a scheme in the central sector of Ministry of Education in collaboration with the United Nations Funds for Population Activities (UNFPA) and with the active involvement of the Ministry of Health and Family Welfare.
• The activities of the programme may be divided in the following heads.
• Curriculum and instructional development.
• Training programmes.
• Evaluation and research.
CONCLUSION
In working to achieve sustainable patterns of consumption and production and to reduce the impacts of human activity on the environment, it is important to recognize that plausible future trajectories of world population lie within a relatively narrow range, especially in the short or medium term.
Over the next 30 or 40 years, a slowdown in global population growth that is substantially faster than anticipated in the United Nations projections seems highly unlikely. Even though the pace of global population growth will continue to decline in the coming decades, world population is likely to be between 20 and 30 per cent larger in 2050 than in 2020.
According to the United Nations Department of Economic and Social Affairs (UNDESA) report 2022, achieving sustainability, therefore, will depend critically
on humanity’s capacity and willingness to increase
resource efficiency in consumption and production and to decoupling economic growth from damage to the environment, with high-income and upper-middle- income countries taking responsibility and leading by example