Whatsapp 88106-52225 For Details
Get Free IAS Booklet
Get Free IAS Booklet
INTRODUCTION
Poverty is a state or situation in which a person or a group of people don’t have enough money or resources to meet their basic needs. People and families who are poor may not have access to shelter, clean water, healthy food, education or medical care.
According to World Bank, about 10 per cent of the world’s population, was living in extreme poverty in 2021. The World Bank describes poverty as:
‘Poverty is hunger. Poverty is lack of shelter. Poverty is being sick and not being able to see a doctor. Poverty is not having access to school and not knowing how to read. Poverty is not having a job, is fear for the future, living one day at a time’
Poverty is also characterized by a lack of participation in decision-making and in civil and sociocultural life. Besides, Poverty is inseparably linked to lack of access to or loss of control over resources, including land, skills, knowledge, capital and social connections.
Poverty can have various manifestations like hunger and malnutrition; ill health; limited or lack of access to education and other basic services; increased morbidity and mortality from illness; homelessness and inadequate housing; unsafe environments; and social discrimination and exclusion.
Without resources, people have limited access to institutions, markets, employment and public services. Therefore, specific measures are needed to address the juvenilization and feminization of poverty.
Definition of Poverty
According to United Nations, poverty is defined as income of less than US $2 per day and today, nearly half of the world’s population currently lives in poverty including one billion children. Of those living in poverty, over 800 million people live in extreme poverty, surviving on less than US $1.90 a day.
Therefore, it is also important to differentiate between chronic poverty and sporadic poverty: the former, a result of generations of deprivation and the latter, a consequence of a sudden crises or short-term shock like current Corona pandemic.
The impact of poverty in multiple manifestations and includes poor nutritional status, food insecurity, vulnerability to disease, reduced productivity levels, and compromised physical and intellectual development.
Absolute Poverty and Relative Poverty:
Two concepts are used to measure the extent of poverty – absolute poverty and relative poverty.
Absolute Poverty is defined in terms of incomes below the minimum standard of nutrition and consumption.
The emphasis, here, is on a minimum level of living rather than on a reasonable level of living (food, shelter, housing).
In 1990, the “dollar a day” poverty line measured absolute poverty by the standards of the world’s poorest countries. In 2015, the World Bank reset it to $1.90 a day.
Relative Poverty, on the other hand, refers to the large inequalities in the distribution of income. It is a state when the standard of living of people is lower as compared to the economic standards of population living in surroundings.
Usually, relative poverty is measured as the percentage of the population with income less than some fixed proportion of median income.
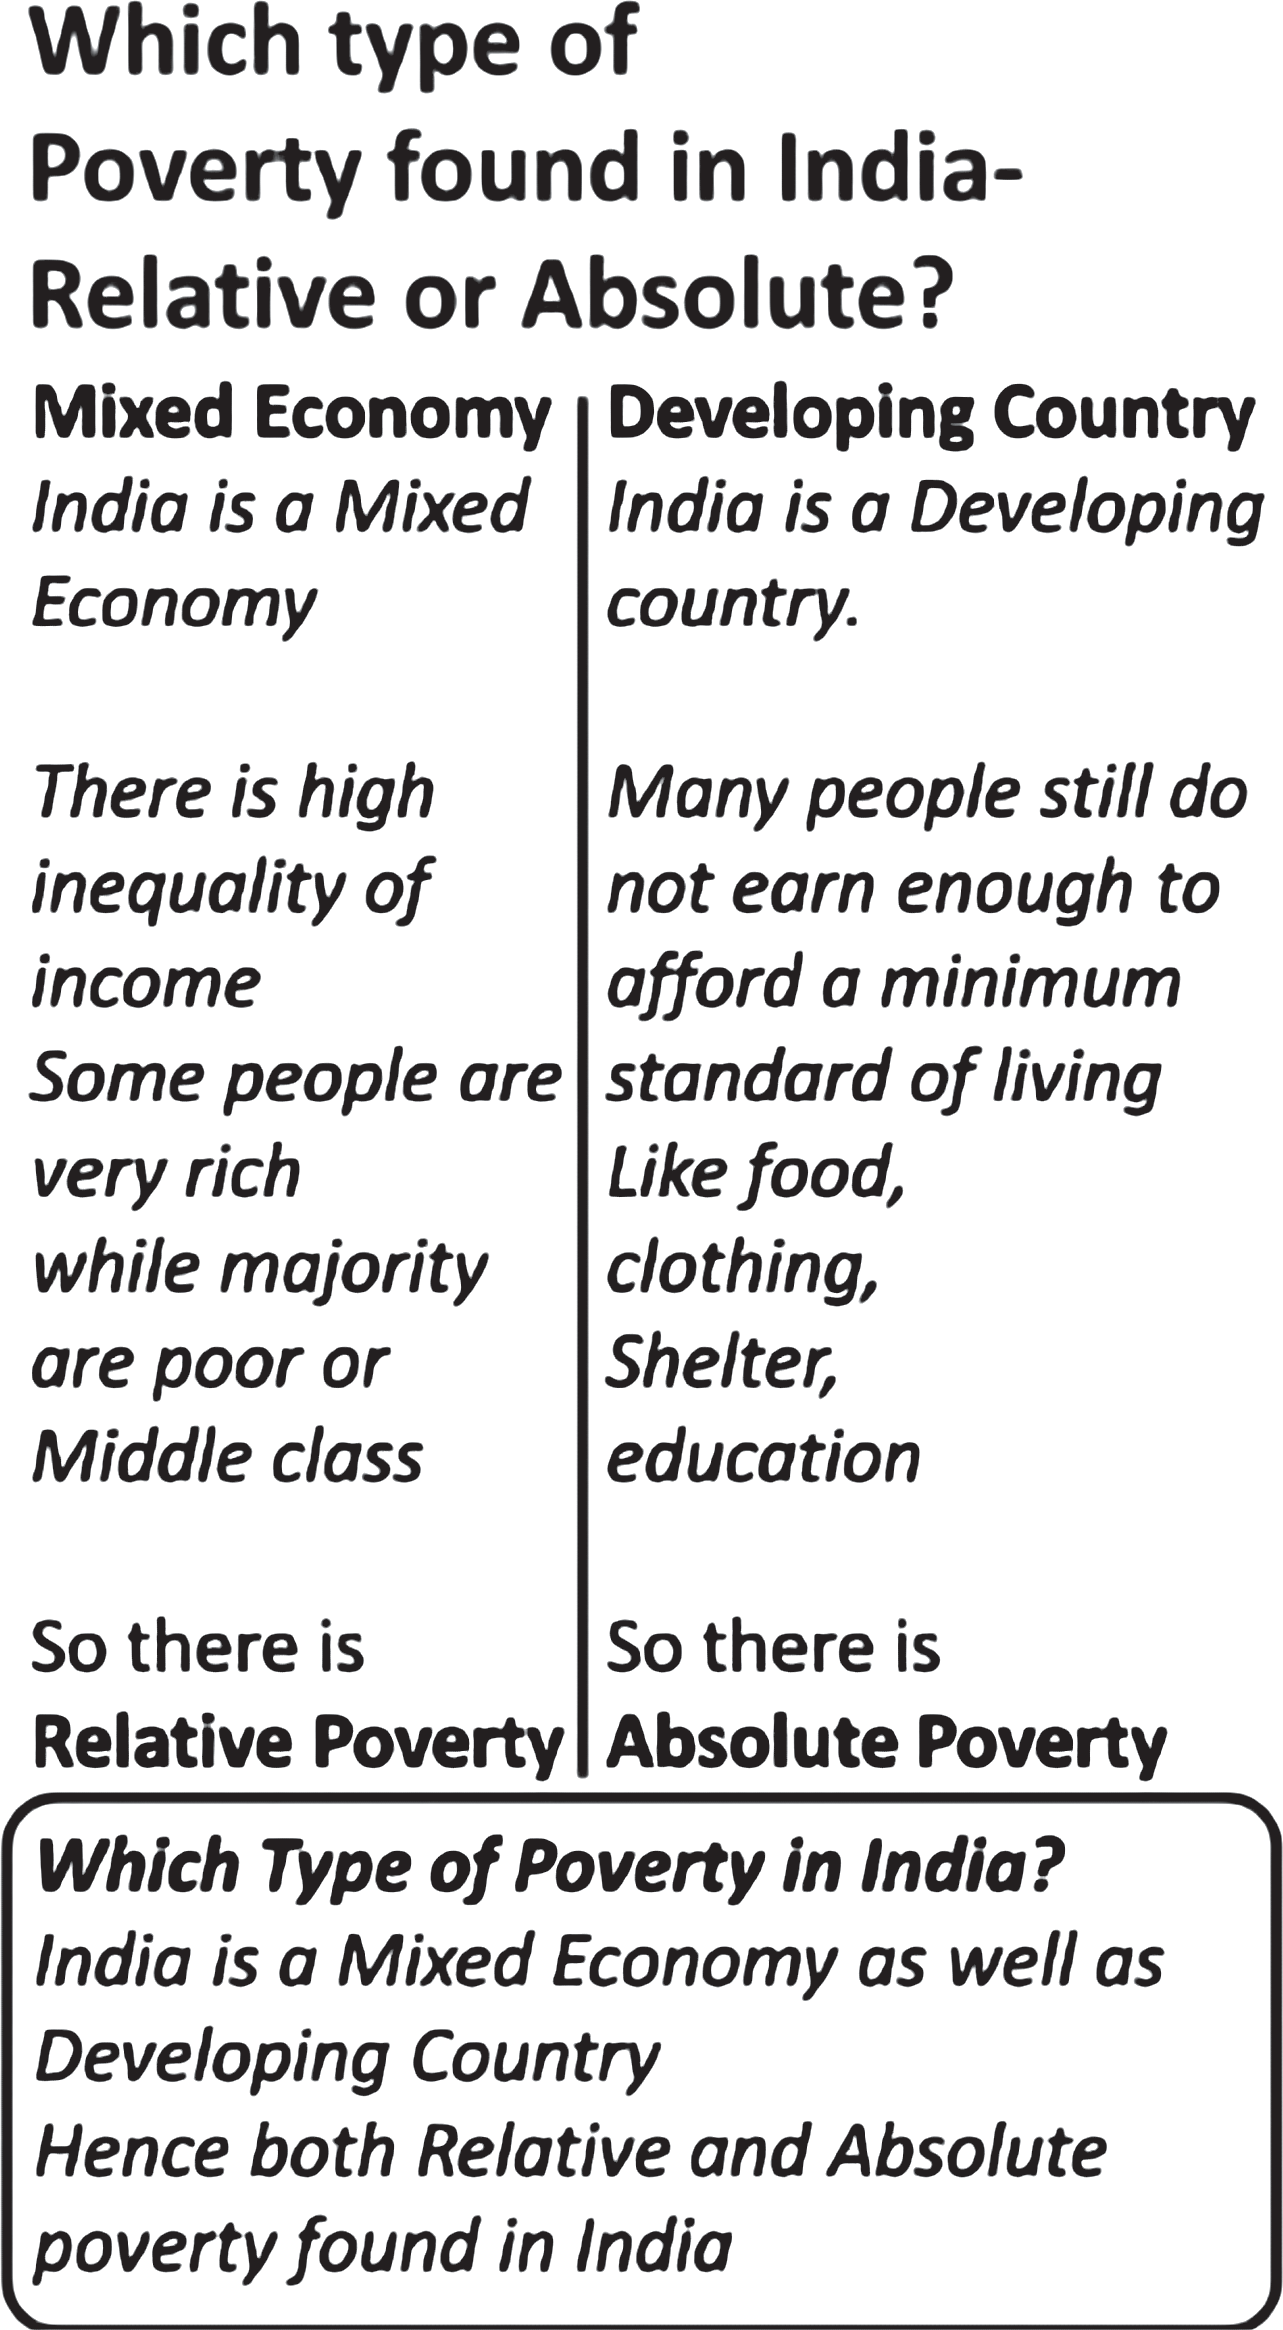
There are people in low-income groups and high-income groups. The former is relatively poor than the latter. In this sense, relative poverty is found even in the developed countries. The cause of relative poverty is unequal distribution of income in a society.
Views on Poverty
There are two broad views on poverty: one is of a sociologist and other is of an economist.
A sociologist views poverty as a multi-dimensional concept, considering various aspects of human well- being. For example, individuals who lack social connections are seen as socially isolated and thus deficient in this aspect.
Similarly, those living in substandard housing are categorized as "housing poor," while people facing health challenges are considered "health poor." Poverty is defined as the inability to achieve "minimally acceptable" levels of essential monetary and non-monetary factors required for a basic standard of living.
Economists often define hardship in terms of "economic position" or "economic resources," but there are differing views on which economic factors best identify individuals whose financial situation falls below an acceptable threshold.
Some economists use family income and compare it to a minimum income standard or "poverty line."
Others focus on consumption levels as a measure of living standards.
Additionally, some economists rely on families' self-assessment of their economic well-being, using this evaluation to determine who is considered poor and how many people fall into this category.
• Another approach (within the economists’ purview) recently brought out by Amartya Sen is concerning human capabilities. This concept rests on individual “capabilities”.
• This measure, similar to other poverty indicators, aims to identify individuals who face the most severe forms of hardship and deprivation.
• It focuses on those at the lowest end of the distribution in terms of their ability to generate the minimum necessary income. These individuals are considered the most needy. This concept is referred to as "self-reliant poverty," which suggests that those who fall into this category are unable to achieve economic independence. The income they can generate is insufficient to meet a socially-defined minimum standard of living.
• In essence, being unable to independently earn enough to fulfill basic needs often represents a more profound and vulnerable condition than simply lacking sufficient income for a year, living in poor housing, or temporarily experiencing consumption levels below an acceptable standard.
• The ‘capability’ approach and Human Development Index is explained by Amartya Sen: "Poverty fundamentally reflects a failure to possess the necessary capabilities for a minimum standard of living. Thus, 'poverty' should be viewed as a lack of essential capabilities rather than merely the inability to fulfill basic needs for certain goods and services."
• Morris D. Morris (1982) prefaced his presentation of the Physical Quality of Life Index with an explicit critique of the aggregated gross national product (GNP) or money-metric approach;
• Robert Chambers (1997) argued for a participatory approach to poverty.
History of Poverty in India
It is said that ‘India has an Island of Prosperity in the Ocean of Poverty’. But history testifies that India has been historically a prosperous economy with well-established foreign trade.
Historically India had been a prosperous and self- sufficient economy with high production rate and a wide range of economic activities.
Immediately before the advent of Europeans, India was one of the richest countries in the world with one of the largest shares in the global trade. During 16th century, India accounted for 24 percent of the global wealth.
However, centuries of colonialism totally altered the economic structure of Indian society. The British government introduced an economic model that was based on systematic loot, plunder and sub-ordination. It is said that money for industrial revolution in Britain was supplied by economic exploitation of India.
The colonial rule destroyed the agrarian sector by implementing distorted revenue policies, which made agriculture an unprofitable enterprise in India. Besides it ruined the local handicraft industry which pushed millions of people into abject poverty.
By the time India became independent, long history of colonial rule had completely ruined Indian economy and converted it into one of the poorest nations with extreme poverty and deprivation.
At the time of independence, the incidence of poverty in India was about 80 per cent or about 250 million. In 1947, agriculture accounted for 54 percent of India’s GDP and 60 percent of the population depended on agriculture for a living.
Vicious Circle of Poverty and Process of Deprivation: Poverty Trap
Poverty is a complex, multi-dimensional issue that goes beyond just economic hardship. It also includes lack of opportunities and inadequate access to basic needs like health, education, and housing. The "Vicious Circle of Poverty" highlights the cycle where various factors are interconnected, perpetuating poverty. People remain poor due to overpopulation, and overpopulation occurs because of poverty, creating a cycle that is difficult to break.
Cycle of Poverty or Poverty Trap is caused by self-re- inforcing mechanisms that cause poverty, once it exists, to persist unless there is outside intervention. It can persist across generations, and when applied to devel- oping countries, is also known as a Development Trap.
It is a spiralling mechanism which forces people to remain poor. It is so binding in itself that it doesn’t allow the poor people to escape it. Poverty trap generally happens in developing and under-developed countries, and is caused by a lack of capital and credit to people
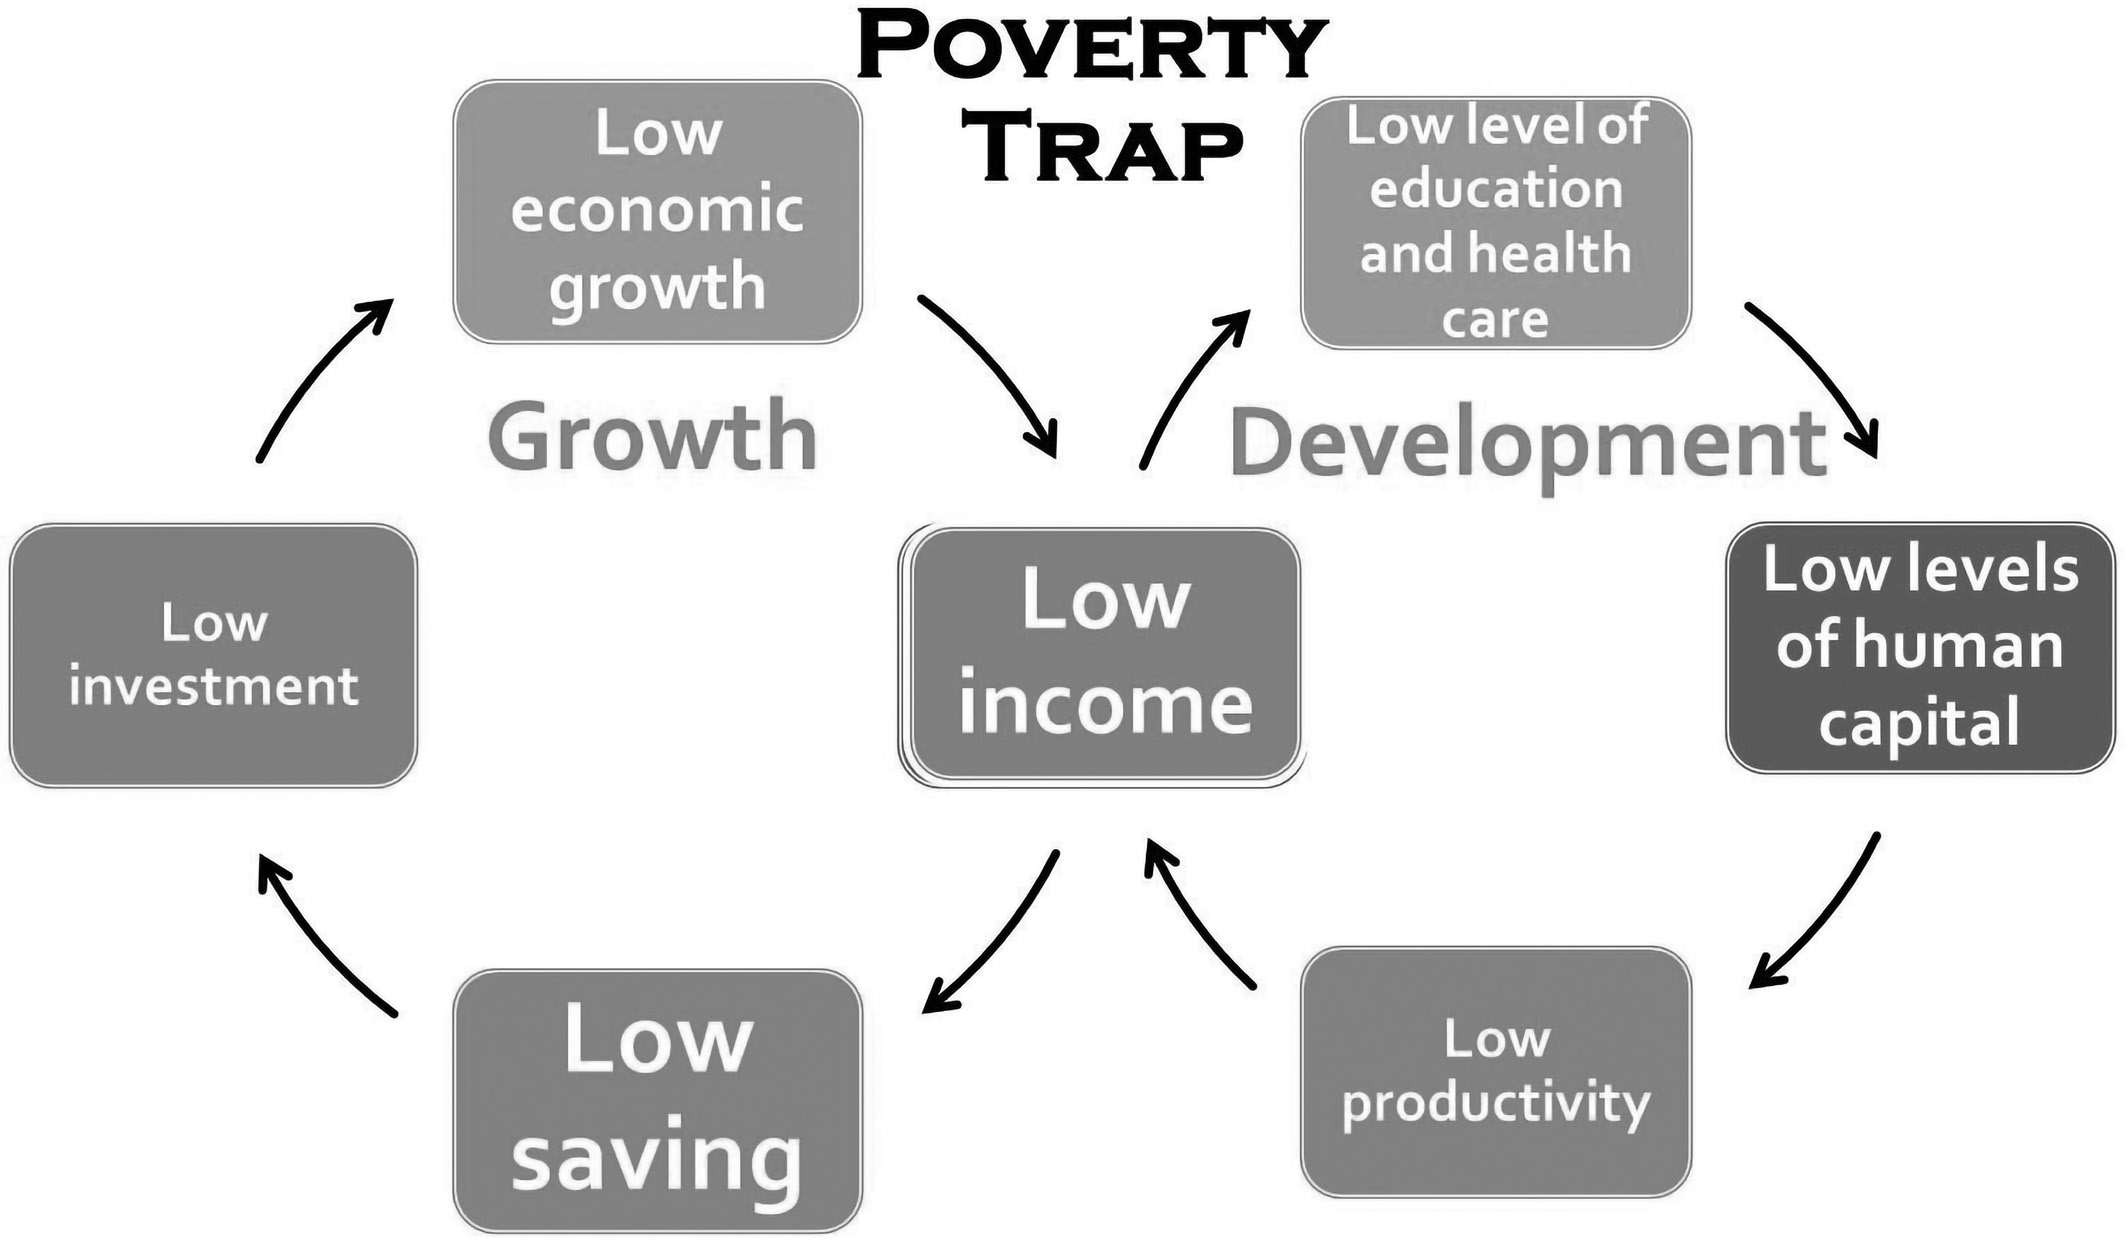
According to Nurkse and Kindleberger, the reasons for this vicious circle of poverty can be classified into three groups.
a) Supply side factors b) Demand side factors c) Market imperfection
Supply Side Factors
The supply side of the vicious circle reveals that in underdeveloped countries, productivity is so low that it does not generate sufficient resources for capital formation.
Samuelson explains that "backward nations cannot lift themselves out of poverty because their production is too low to allocate anything towards capital formation, which could improve their standard of living."
Nurkse argues that the supply side is characterized by a limited capacity to save, which stems from a low national income. This low real income results from poor productivity, which is primarily caused by a lack of capital. In turn, the lack of capital prevents the ability to save, creating a self-perpetuating cycle of poverty.
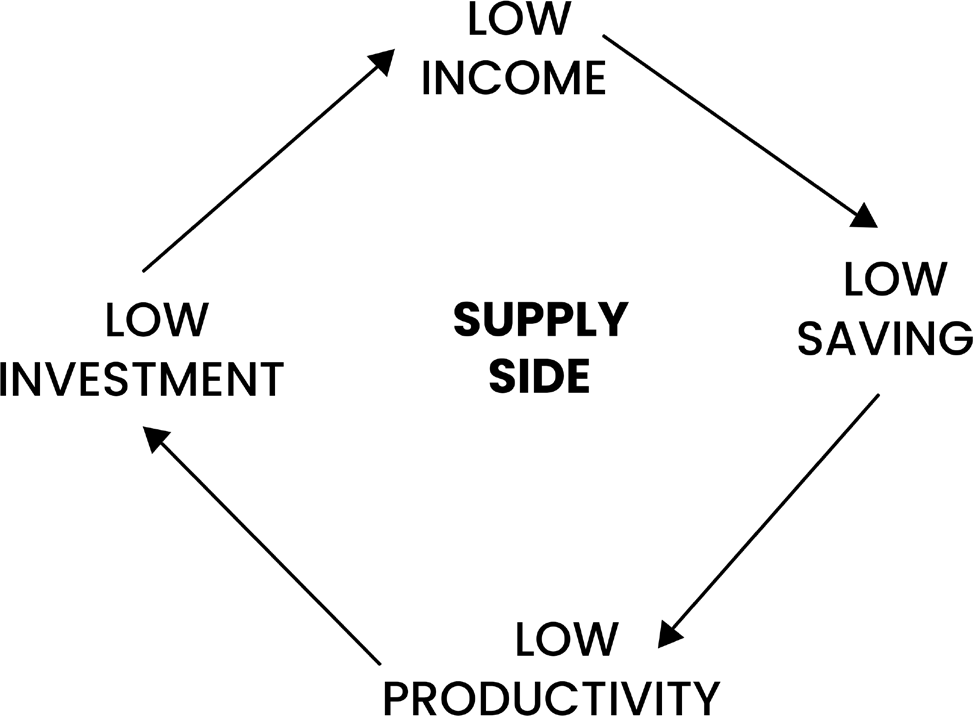
The diagram above clearly illustrates that the root cause of poverty is the low level of savings. As a result, investment in productive sectors becomes unfeasible. A significant portion of GDP is allocated to consumption, and the population is unable to save. This leads to a lack of investment and capital formation.
While wealthier individuals may have the ability to save, they tend to spend their surplus on luxury goods rather than on savings. They prioritize expensive, often foreign- made items, which does not contribute to expanding the domestic market. Consequently, developing countries struggle with limited investment opportunities and capital growth.
Demand Side Factors
According to Nurkse, poverty is caused by several factors in the demand side. In underdeveloped countries the inducement to invest is low because of the low purchasing power of the people, which is due to their small real income. It is illustrated in the following diagram
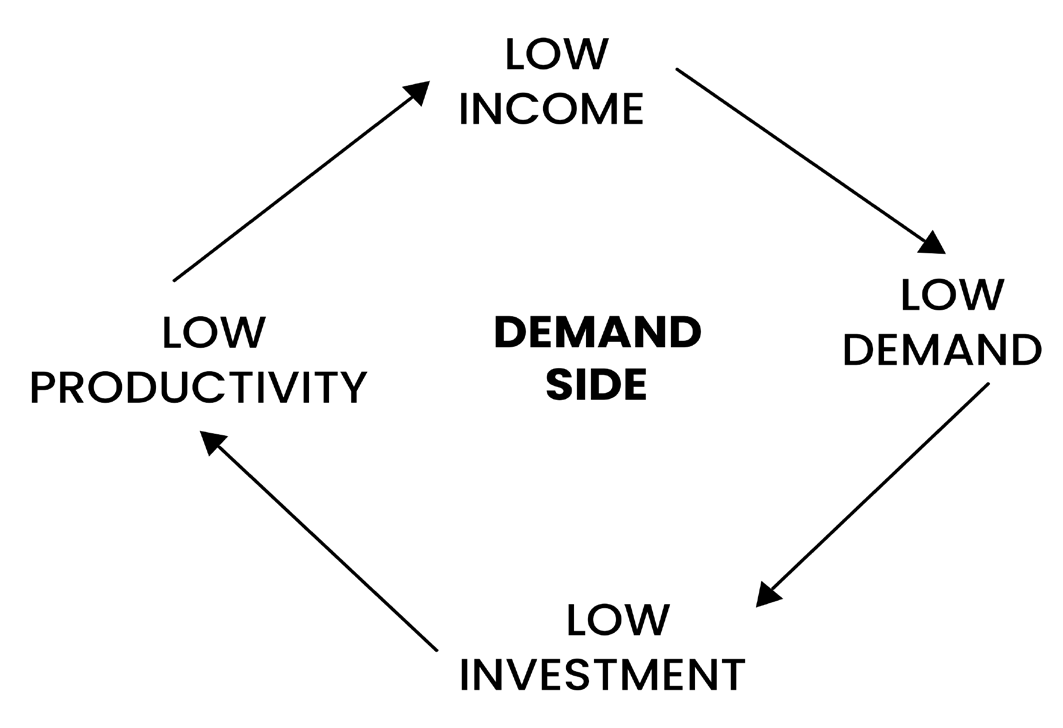
The primary cause of poverty in these countries is the limited demand. As a result, market sizes remain small, and this reduced market size becomes a barrier to encouraging investment.
Market Imperfections
According to Meier and Baldwin, the existence of market imperfections prevents optimum allocation and utilization of natural resources, and the result is underdevelopment, and this, in turn, leads to poverty.
The development of natural resources depends upon the character of human resources. But due to lack of skill and low level of knowledge, natural resources remain unutilized, underutilised and misused.
Goal 1 of the 17 Sustainable Development Goals is “Ending poverty in all forms, everywhere”. However, this is not a standalone goal, since poverty is a result of deprivation, and can be eradicated only by removing that deprivation
General Factors of Poverty
Poverty is the outcome of the interaction of range of factors. The factors may be historical, social, cultural, economic, political and geographical and host of other factors. These apply to poverty, both in rural and urban areas.
• Historical factors: Historical factors could be one of the prime reasons for poverty. For example, most of the African countries have been subjugated and exploited by the imperial powers for centuries that explains the backwardness of the region.
• India is one of the best examples of historical legacy of exploitation. When the imperial powers entered India, it was the second largest economy of the world after China, but at the eve of independence it was one of the poorest nations.
• Social factor: In India poverty and hunger is not uniformly distributed across the country rather it is concentrated in few pockets.
• The caste dimension of poverty had historically remained unchanged, where majority of the poor and vulnerable belongs to SC/ST community that to from the rural areas. The tribal communities predominantly constitute the disadvantaged and deprived social groups in India.
• Besides caste, gender discrimination and racial discrimination are certain other social factors responsible for poverty. Also factors like marriage at early age, divorce, dowry, laws of inheritance, old age and social restriction etc. could also lead to poverty.
• Economic factors: Money is the primary driving force that pushes someone into poverty. Food insecurity, Unemployment, poor infrastructure, physical disability, lack of food and water, high cost of living, lack of investment or resources, Unequal distribution of assets etc. are some of the economic factors. High out of pocket
expenditure on health, low productivity at work, high prevalence of various diseases, lack of sanitation and chronic nutritional insecurity have cyclical impact on poverty.
• Political factor: Political factors behind poverty includes conflict, war, corruption, injustice, discrimination, lack of proper implementation of public policies etc.
• Geographical factor: The geographical factors that could lead to poverty includes extreme climate, natural calamities, depletion of resources, climate change, regional disparities, migration from rural to urban areas, overpopulation etc.
• Population: Rapid increase in population leads to poverty in India due to the scarcity of resources. Much developed medical and healthcare facilities in India have reduced the overall death rate, but the birth rate is not under control with much effectiveness in rural areas.
• Shocks and adversities: The chaos amidst Covid-19 has re-added to the already surviving issues of rural poverty in India.
• Personal factors: Major factors like sickness, lack of nutrition from food, un-hygienic lifestyle have resulted in no work and no gain. This ultimately leads to poverty in India.
Poverty and Inequality
An Indian earning a monthly wage of Rs 25,000 is among the top 10 per cent of earners in the country. This is what the recently released State of Inequality in India report by the Institute for Competitiveness found, using available government data. The Economic Advisory Council to the Prime Minister commissioned this study. This demonstrates the wide chasm between the top and bottom earners. And this is getting wider.
Incomes of the top 1 per cent earners grew 15 per cent during 2017-18 to 2019-2020 while that of the bottom 10 per cent declined 1 per cent — a “failure of the trickle-down approach to economic growth”, the report concluded.
World Inequality Report 2022 termed India as the most unequal country: India stands out as a poor and very unequal country, with an affluent elite and over 50 per cent of India’s population are without any significant wealth at all.
The global effort to eradicate extreme poverty has taken a significant setback, falling short of expectations well before the 2030 target year set by Sustainable Development Goal (SDG) 1. As of now, it remains uncertain when the world will reach the goal of reducing extreme poverty to just three percent of the total population.
This is a situation that the Bank forecasts as worrying.
“The policymakers now confront a tougher environment: Extreme poverty is concentrated in parts of the world where it will be hardest to eradicate — in sub-Saharan Africa, in conflict-affected areas, and in rural areas,” it says.
For instance, sub-Saharan Africa has the world’s highest poverty rate at 35 per cent and it accounts for 60 per cent of the world’s extreme poor population. To reach the SDG1 level by 2030, each country here needs an annual economic growth of nine per cent for the next eight years.
This sounds impossible currently given that most of the countries in the region recorded below two per cent growth even before the pandemic.
Inequality was alarmingly high and destabilizing social and political order in much of the world even before the pandemic struck. According to Oxfam report 2019, In India the top 1% hold 51.53% of the national wealth, while the remaining 99% make do with almost 48%.
Growth, Poverty and Inequality
It is mostly presumed that (economic) growth reduces poverty and inequality. However, the empirical studies carried over a period of time in developed, developing and the least developed countries give a different picture.
Undoubtedly growth can impact poverty and inequality; but one cannot determine the course of its impact.
Growth can reduce poverty and inequality;
Growth can reduce poverty and increase inequality;
Growth can increase both poverty and inequality.
These diverse patterns are possible because growth is not a uniform numerical addition. It is a process of change that affects not only the volume of output, but the composition of that output, amount of production, the relative values
of particular goods, the participation of different sections of the population in productive activities, the purchasing power of different sections and so on.
Again, empirical results of one country cannot be applied to other countries, nevertheless certain inferences can be drawn from such studies which can be tested in different situations.
For instance, if cereal production rises through labor- replacing methods and much of the increased output is exported, this could result in higher poverty and greater inequality.
Conversely, if the increase in output leads to a decrease in cereal prices, it could contribute to a reduction in poverty.
Empirical studies conducted in the United States during the 1990s reveal that, between the 1970s and 1980s, the income gap between the rich and poor widened, despite the economy experiencing rapid growth and significant expansion.
One notable study found that between 1977 and 1990, the average income of the poorest 20% of Americans declined by 5%, while the wealthiest 20% saw an increase of approximately 9%. By 1990, the poorest fifth of the population earned just 3.7% of the nation’s total income, a decrease from 5.5% in the 1950s and 1960s. Meanwhile, the richest fifth held just over half of the national income.
In US the top 5 per cent command 26 per cent of the nation’s total income.
These changes in inequality had a similar effect on the livelihood of many ordinary Americans. Many were employed but their emoluments were insufficient to provide them minimum living standards. This led to rise in poverty. Such findings establish the relationship between inequality and poverty.
Relationship between Poverty and Population
Studies depict that growth with equity (ethics) connotes progress and as such growth trajectory gets influenced by poverty and population growth.
| Development | Progress |
| Development is a process that procreates growth as well as progress and positive change. The concept is closely associated with physical, socio- economic, environmental and demographic factors. | Progress is associated with a movement, especially towards an objective. It has manifestations like technological progress, scientific progress and socio-economic progress. |
As Amartya Sen aptly puts it, “no nation has transitioned from poverty to prosperity without addressing the basic needs of its people.” Poverty not only hampers growth but also stunts national progress and development, with the struggles of the impoverished affecting key growth factors such as per capita income.
A rapidly growing population can turn an expanding economy into one plagued by mass unemployment, low job opportunities, and other related issues like inadequate housing, poor living conditions and food insecurity. As individual incomes decrease and resources dwindle, especially for vulnerable groups with limited access to financial support, the problem worsens.
Poverty and rapid population growth are closely interconnected, forming a vicious cycle. The increase in population exacerbates the number of people living in poverty, while poverty itself affects population dynamics, including growth rates, age distribution, and rural-urban migration. For example, in Cambodia, the average family size was six children in 1994, but by 2015, this number had dropped nearly 40% due to the country's rise in per capita income.
| Counter Evidence on relationship between population and poverty | ||
| Higher poverty can exist despite low population growth countries like Venezuela. This has occurred due to faulty policies of the government. A 2021 study found that three in four Venezuelans are living in extreme poverty. With the rise in inflation along with the political climate of the country, many Venezuelans had to flee the country. Inadequate living conditions and the authoritarian style of government have exacerbated poverty in Venezuela. Latin American Nations like Guatemala face poverty despite low population growth. Reasons include low educational and occupational | mobility along with inability to undergo a process of structural change towards innovation and more knowledge-intensive production. U.N. Population Fund, as far back as 1992, pointed out, “Research has not established a strong causal link running from high fertility to poverty.” High population growth can also exist with low proportion of poverty like in China This is because large number of educated youth population was employed into mass manufacturing factory lines. This raised the prosperity of large number of people reducing poverty to below 10 percent of the population. |
• Investments In Better Health, including reproductive health, are essential for individual security and for reducing mortality and morbidity, which in turn improve a country’s productivity and development prospects.
• Access to Sexual and Reproductive Health, including family planning, can affect population dynamics through voluntary fertility reduction and reductions in infant and maternal mortality. Improved reproductive health also helps individuals, particularly young women, break out of intergenerational cycles of poverty.
• Studies show that meeting the reproductive health and contraceptive needs of all women in the developing world more than pays for itself. For every dollar invested in contraception, the cost of pregnancy-related care is reduced by $1.43.
• Women Empowerment: When women and couples are empowered to plan whether and when to have children, women are better enabled to complete their education; women’s autonomy within their households is increased; and their earning power is improved. This strengthens their economic security and well-being and that of their families. Cumulatively, this contributes to development progress and poverty reduction.
• Delayed Pregnancy: The lifetime opportunity cost related to adolescent pregnancy – a measure of the annual income a young mother misses out on over her lifetime – ranges from 1 per cent of annual gross domestic product in a large country such as China to 30 per cent of annual gross domestic product in a small economy such as Uganda.
• If adolescent girls in Brazil and India were able to wait until their early twenties to have children, the increased economic productivity would equal more than $3.5 billion and $7.7 billion, respectively.
Human capital critically depends on investment in education beyond the primary level, but even more fundamentally it begins with investment in health, including sexual and reproductive health. This is particularly true when considering entry points to unleash the economic potential of women and girls
Poverty and Human Development
There is a definite pattern in relationship between poverty and human development. For moving upward in the achievement of human development, poverty reduction is an imperative condition.
The countries with no poor people such as OECD enjoy better human well-being whereas developing and the least developed countries continue to suffer and are deprived of even basic services and public goods like safe drinking water, electricity, sanitary amenities, health facilities, primary education, etc.
The worst sufferers are women and girls as there exists gender discrimination in providing these goods and services. The economic dependency of women makes them vulnerable to social evils and even within the households, particularly in rural areas, they are discriminated. The key to improve human development lies with the empowerment of women and the ‘poorest of poor’ in the society.
Globalisation, Poverty and Human Development
Since the beginning of the 1980s the wave of globalisation is sweeping the world and the developing countries and the least developed countries are often advised by the international institutions such as the World Bank, International Monetary Finance (IMF) and WTO to minimise the role of state/government in economic activities and ensure greater role of market forces.
Although these countries are adjusting their economies to accommodate this thinking mostly under the Structural Adjustment Programmes (SAPs), however there are resentments and doubts about the success of it.
The suspicion is mainly because the withdrawal of state intervention from developmental activities adversely affects the welfare of the poor as market forces largely engage in profit earning activities and neglect social development.
The assessment of the implementation of SAPs in the African and South Asian countries is not encouraging.
Rather, the SAPs have deteriorated the employment generation and prospects of poverty alleviation have been hampered.
It has indirectly affected the human development too.
• On the sidelines of globalisation, developing and least developed countries have been undergoing the process of privatisation and disinvestment in public sector.
• There is an ongoing argument that privatizing essential services like education, healthcare, electricity, water supply, and other basic services could improve their quality and contribute to human development.
• However, evidence suggests that privatization often benefits those who can afford to pay higher prices for these services,
• On the other hand, those who cannot are left excluded from access. The promotion of market forces has, so far, proven harmful to the poor, as government involvement in poverty alleviation
programs has been diminishing.
• Additionally, there has been a noticeable reduction in public expenditure by the government.
• There are efforts to evolve a paradigm which will amalgamate the interests of poor and profit motive of market forces. The role of NGOs to fill this vacuum is often suggested and one finds large number of NGO’s cropping up world over in recent period.
• However, given the functioning of the NGOs and financial support to them by influential organisations and governments, raises the question of their independent work.
• Can they fill up the gap of state/government in providing social and public goods? They can reach to a limited number of poor and needy people and that too mostly in urban and semi-urban areas. What about the majority of poor living in rural and remote areas? Who would look after poor people on the withdrawal of government?
• These questions remain unanswered, and the poor continue to bear the brunt of globalization and privatization. This is why we often hear calls for "globalization with a human face," emphasizing the need for human-centered economic development.
Incidence and Intensity of Poverty in India
The incidence and intensity of poverty are more important in determining poverty based on income alone according to the latest United Nations Multidimensional Poverty Index Report.
The Incidence of Poverty is measured by the Poverty Ratio, which is the ratio of the number of poor to the total population expressed as a percentage. It is also known as Head-Count Ratio or Poverty Head-Count.
The Intensity of Poverty is measured by Poverty Gap, which is the relative gap between the median standard of living of the poor population and the poverty line. The higher this indicator is, the more intense the poverty is said to be, in the sense that the standard of living of the poorest is far below the poverty line. Formally, it is calculated as follows:
Intensity of Poverty = (Poverty Line - Median Standard of Living of the poor population) / Poverty Line
The last official estimate of Poverty in 2011-12 was released by Planning Commission at 21.92 percent, which was estimated using Tendulkar Committee approach. The SDG India 2019 Report by Niti Ayog also mentions Tendulkar Poverty Line for 2011-12, for rural areas the national poverty line using the Tendulkar methodology is estimated at Rs. 816 per capita per month (Rs. 27 per person per day) and Rs. 1,000 per capita per month (Rs 33 per person per day) in urban areas.
The World Bank has classified India as a lower middle- income country and the corresponding poverty line would be PPP $3.2 (2011 prices), which translates into roughly a consumption level of Rs 75 per person per day.
However, global evidence indicates that India is on track for the fastest pace of poverty reduction and meeting its poverty elimination goals by 2030.
State of Rural and Urban Poverty in India
There is general consensus that greater part of India’s poverty is rural but urban and rural poverty are intimately connected. With growth of Indian economy and fast paced urbanization, the urban growth is a result of population shift from poverty-stricken hinterland to the cities, especially urban slums. Studies show that urban areas, by all accounts, have skimmed off the fruits of development at least during 2015-16, leading to significant rural poverty.
While 25.01 per cent of the population was multidimensionally poor in the country, the poverty ratio was as high as 32.75 per cent in rural areas during that year. This was against 8.81 per cent of the population in urban areas.
In the semi-urban areas, poverty is associated with the process of conversion of agrarian land for commercial projects. This affects patterns of labour force participation, social change, waste generation, pollution and pressure on natural resource systems.
The cost of living in urban areas is comparatively high, therefore the migrant labourers and other informal employees find themselves trapped in the vicious cycle of urban poverty.
Rural Poverty
India is predominantly a rural country. As per Census 2011, 68.8 per cent of country’s population and 72.4 per cent of workforce resided in rural areas. Rural economy constitutes 46 per cent of national income. Despite the rise of urbanisation, more than half of India’s population is projected to be rural by 2050. Thus, growth and development of rural economy and population are a key to overall growth and inclusive development of the country.
Recent estimates (2011-12) indicate that 216.5 million people in rural areas are living in poverty. Nearly one- third of India's total population continues to live below the poverty line, with the majority residing in rural areas. Chhattisgarh, India's poorest state, has 40% of its population living below the poverty line. In fact, 61% of India's poor population is concentrated in seven states: Chhattisgarh, Bihar, Jharkhand, Madhya Pradesh, Odisha, Rajasthan, and Uttar Pradesh.
Though 30% of rural population lives in a chronic poverty but in the last three decades some improvement in the number has been seen because of anti-poverty schemes and migration from rural to urban areas. Scheduled castes and tribes are the worst sufferers of rural poverty.
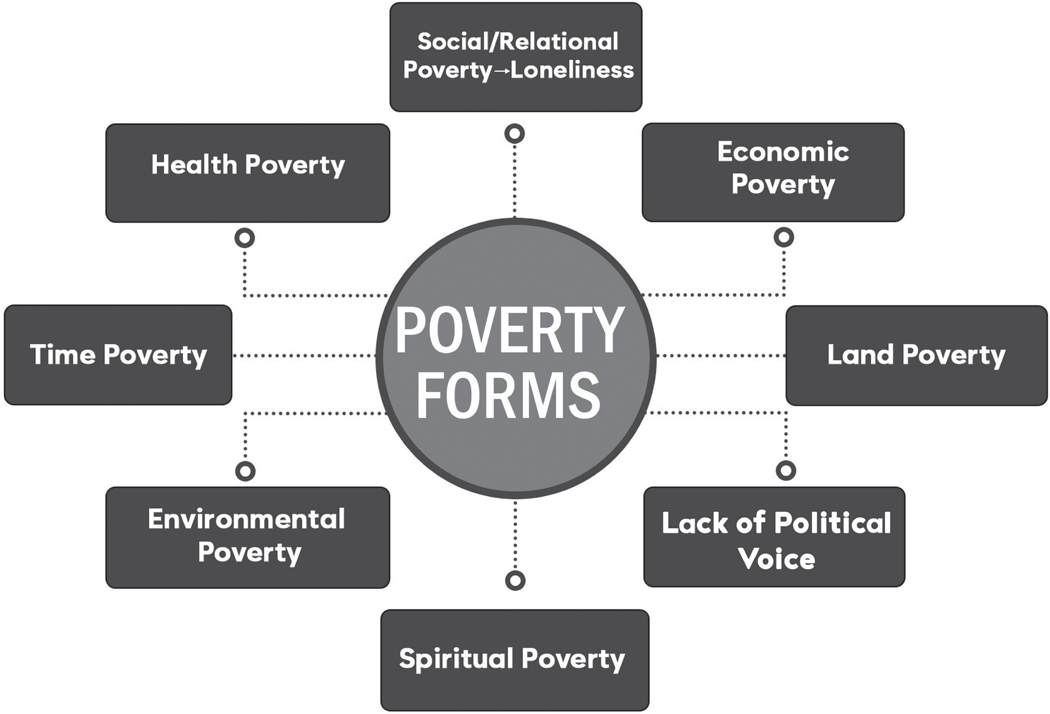
Specific Causes of Rural Poverty in India:
India has an overall population of 1.3 million, with 900 million people living in rural areas of the country. While the poverty rate has been significantly reduced due to governmental support, yet the causes of rural poverty are complex and multidimensional. They involve, among other things, culture, climate, gender, markets, and public
policy. Factors such as natural disasters, heavy dependence on agriculture and high birth rates have contributed to the continued poverty in rural India that affects around 300 million people.
Historical Causes:
• The colonial rule ruthlessly destroyed our small scale and handicraft industries for mercantile purposes. There was a lot of economic drain, whereby, the foreigners took the savings of the country away in return for a small compensation. The poorly managed economy failed to provide effective financing for economic development.
Social Issues:
• Limited Availability of Social Services : Factors such as a weak educational system, limited healthcare access, lack of sex education, and inadequate availability of birth control methods further exacerbate rural poverty in India.
• Custom of Child Marriage : Although the legal age of marriage in India has been set at 21 for men and 18 for women since 1978, around one-third of global child marriages still occur in India. In rural areas, one- fifth of girls are married before 16 and give birth before 18, contributing to higher fertility rates and increased demand for resources like food and energy, which deepens poverty.
• Large Size of Family : Large families place significant financial strain on the household head, contributing to poverty as they struggle to provide for more members.
• Gender Discrimination: Gender inequality severely impacts the physical and psychological well-being of women, limiting their access to education and healthcare opportunities.
• Problem of Alcoholism and Drug Addiction : In rural areas, particularly in states like Punjab and the North-East, alcoholism and drug addiction contribute significantly to the cycle of poverty.
• Expensive Marriages and Evils like Dowry : The burdens of expensive weddings and dowry demands often result in deep debt, trapping families in financial instability for generations.
Economic Causes:
• Skewed Land Distribution and Smaller Land Parcels: Although the "Green Revolution" focused on promoting private land ownership and aiming for fair land distribution, much of the land in remote areas of India remains concentrated in the hands of a small group, predominantly upper-class and higher-caste individuals.
•
Large portions of cultivated land belong to rich farmers and landlords, and result in a severely uneven distribution of land.
• In other words, the majority of farmers are ‘small and marginal’ who own very little land and may have to maintain a feudal relationship with rich landlords.
• Others struggle with a low annual income and often with debt, since the harvests from their lands seldom bring a profit.
• Low agriculture productivity is due to fragmented and subdivided land holdings, lack of capital, illiteracy about new technologies in farming, the use of traditional methods of cultivation, wastage during storage, etc.
• Other issues such as crop patterns, neglect of crop rotation and poor-quality materials and technology also influence poverty in rural India.
• Problem of Usury and Debt Trap: Due to widespread poverty, many rural areas in India are compelled to take loans with high interest rates, often falling into the category of usury. Although these loans offer short- term relief by addressing immediate financial needs, they create long-term challenges. The resulting debt burdens these areas further, making it harder to repay loans and increasing the need for more funds in the future.
• High unemployment and underemployment: According to Ram Ahuja, the high rate of unemployment in the country leads to a drop in the demand for labour. Non-availability of proper employment leads to lowering the standards of living of people. There is Underemployment (employed in less than full-time or regular jobs or insufficient jobs for their training) and Disguised Unemployment (employing more workers than required) in the country, particularly in the farming sector. This has resulted in low agricultural output and also led to a dip in the standard of living.
Environmental Causes:
• Dependence on Monsoon: Farming in India relies heavily on monsoons that bring rainfall and irrigate the land. This means that erratic weather, cyclones, water shortages and droughts all have a huge impact on agriculture and can cause damage to crops. Even today half of the rural farming population depends on monsoon for irrigation. These factors have a massive impact on the crop products and their yields that result in rural poverty in India.
• Natural calamities such as floods, earthquakes, volcanoes, cause serious damage to the life and property of the people, who lose everything in such
calamities and could not recover from such losses. Such situations lead to poverty. Thus, the causes of poverty may be many ranging from non-availability of work to large size of families. Poor states like Bihar, UP, MP, Chhattisgarh, Odisha, Jharkhand, etc. face such calamities regularly.
Work and Promotion of Livelihoods in the Unorganized Sector by the National Commission on Enterprises in the Unorganized Sector 2007 (NCEUS, 2007) reveals that in
2004-05, out of India’s total workforce, 92 percent worked
in the informal economy. Urban poverty in India is over 25 per cent; with more than 80 million people living in urban areas on incomes that are below the poverty line.
The major causes of Urban poverty include uncontrolled migration, lack of employment opportunities in rural areas, lack of investment, inadequate infrastructure, lack of affordable housing, etc.
Poverty is the outcome of a complex set of relationships that controls distribution and the use of resources in a society. Poverty is regarded as a social problem as it affects smooth functioning of institutions in the society. It also paves way for other social problems.
Urban Poverty
Economic Development and Urbanization are closely linked. Cities in India are emerging as the country's engines of economic growth, with a contribution of more than 60 per cent to GDP. As per Census 2011, India's urban population is now 377 million which shows a 31 percent increase from 2001.
Specific Causes of Urban Poverty:
• According to 11th Five Year Plan document:
• Structural causes - which includes socially constructed constraints like caste, class, etc. as a barrier to opportunities for low-income groups;
• Migration or Influx of a large number of workers to cities without commensurate job opportunities and availability of housing and basic amenities;
• High cost of living, including cost of health care and medical facilities, housing, transport and education;
• Lack of Urban Planning, especially housing for low-income categories and provision of land for informal sector activities;
• Absence of adequate regulation to protect the economic interests of the poor;
• Lack of involvement of poor in urban planning and developmental process
Other Detailed Causes include:
• Uncontrolled Migration: According to Census 2011, about 450 million of the total population of
1.2 billion migrated within the country. 78 million population or 15.6% of all domestic migrants have migrated from rural to urban areas.
• Agriculture is seasonal in nature as there is large gap between sowing and harvesting season. This leads to seasonal migration of agricultural labourers towards urban centers.
• Lack of infrastructure and facilities in villages leads to ‘push migration or forced migration’ to urban India.
• Rapid Growth of Slums: At the slum decadal growth
rate of 34%, the slum households are projected to go upto 18 million, which has multiplier effect on multi- dimensional poverty.
• They face deprivation in terms of lack of access to sanitary living conditions and their well-being is hampered by discrimination, social exclusion, crime, violence, insecurity of tenure, hazardous environmental conditions and lack of voice in governance.
• Problem of Housing: Houselessness is a problem faced by millions, especially in urban India. It leads to overcrowding, which is a favourable condition for the growth of slums.
• The people are, thus, forced to live in unhealthy conditions. This reduces their capacity to work, increases health hazards due to increase in communicable diseases, and frustration, that together leads to poverty.
• Poverty forces living in the substandard houses and leaves little for the prerequisites of decent living.
• Dominance of Informal Sector: The urban informal sector comprises a large part of the unorganized non-agriculture sector. There is a constant threat of eviction, removal, confiscation of goods and almost non-existent social security cover.
• Due to availability of large number of unskilled and semi-skilled laborers, wages of urban poor is very low, leaving them with less money to invest on health and education.
• Higher dependence on loans at high rates of interests causes issues of indebtedness.
• Low levels of education and skill in the unorganized sector workers have resulted in their inability to access the opportunities offered by emerging markets. This underscores the criticality of skills up-gradation for better livelihoods opportunities in urban areas.
• Social deprivations like lack of social protection, lack of voice and participation in governance structures, lack of family support and rise in isolation, frustration, violence, stress and anxiety among the poor, which causes lower productivity and lower income thus higher poverty.
• Caste, Class, Religion, Region, Ethnic and Gender related discrimination also causes lack of opportunities and problem of multidimensional poverty.
• Issues of security are another factor for lower income, especially for the migrants living in slums and unorganized colonies.
The Key Dimensions of Urban Poverty are:
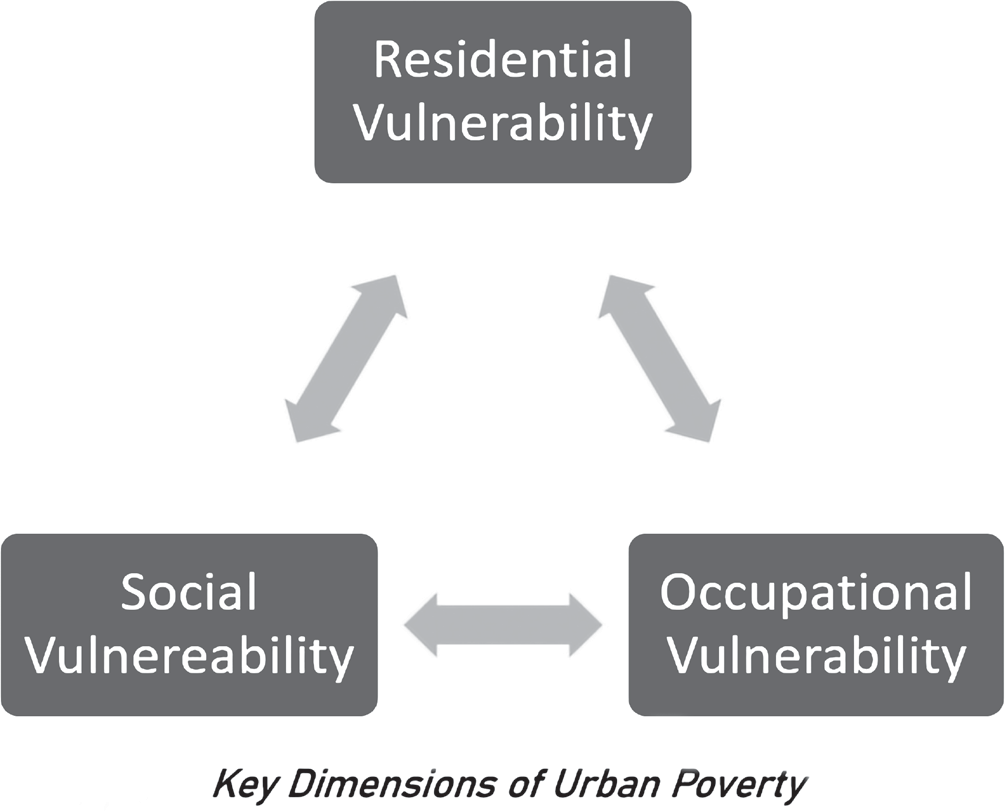
• Residential vulnerability (access to land, shelter, basic services, etc.);
• Social vulnerability (deprivations related to factors like gender, age and social stratification, lack of social protection, inadequate voice and participation in governance structures, etc.) and
• Occupational vulnerability (precarious livelihoods, dependence on informal sector for employment and earnings, lack of job security, poor working conditions, etc.).
These vulnerabilities are inter-related. Amongst the urban poor, there are sections subject to greater vulnerability in terms of the above classification; these include women, children, and the aged, SCs, STs, minorities and differently- abled persons who deserve attention on a priority basis.
Therefore, Urban poverty causes various distinct challenges for housing, water, sanitation, health, education, social security, livelihoods and the special needs of vulnerable groups such as women, children and the aging.
Relationship Between Rural and Urban Poverty
It has been observed that the problem of poverty in India is mainly a problem of rural poverty.
Role of Rural-Urban Migration: It has often been said that the urban poor of India are only an overflow of the rural poor into the cities and that essentially, they belong to the same class as the rural poor. Studies have found that a large number of rural poor migrate to urban centres due to lack of work in villages and growing opportunities of employment in towns and cities.
• The largest cities have drawn the highest number of rural migrants, as they provide a broader range of job opportunities compared to smaller towns. Many of these migrants are employed in low-income self- employment ventures or low-wage unskilled and semi-skilled positions within the unorganized sector of the urban economy.
• The rural poverty is carried over to the urban areas by the channel of rural urban migration. This is very evident in slums and squatter settlements, environmental deterioration, substandard housing and low levels of health and nutrition of the urban poor.
Social and cultural factors: The rural migrants depend upon kinship, caste and regional networks not only for
decisions with regard to the choice of destination but also for their early and easy adjustment to the difficult conditions of urban living. They get automatically pushed into the slums or squatter settlements where their kin- members, castemen, acquaintances or friends live. These people help them in getting employment or give financial assistance in the beginning.
• Moreover, the urban poor maintain their linkages with their families in rural areas by visits and remittances. They go to their villages during harvesting, festivals and other ceremonies like marriage and death.
• In time of difficulty or unemployment, they fall back on the traditional but scanty, sources of income available in their villages. Most of them continue to maintain their roots in villages. The rural poor join the mass of urban poor after reaching the towns and cities. In this way, rural poverty is carried over to urban areas.
Rapid Rise in Urban Population: But the natural increase in the population of the urban poor has also become significant in recent years because of the number of the urban poor who are permanently settled in towns and cities. In our next section we will turn our attention to the approach and concern at the governmental level toward the problems of poverty in India.
Measurement of Poverty
• Methods of Measuring Poverty
The four important used methods of measurement of poverty are: (i) The Head Count Index (H); (ii) Income Gap Index (I) (ii) The Poverty Gap Index (P) and (iii) The Sen Index (SI).
• Head Count Index (H): The poverty headcount is the simplest and most commonly used method to measure poverty. It calculates the percentage of the population living below the poverty line. The formula used for the calculation of HCI is: HCI=M/N
HCI= Head Count Index
Where M= Number of people living below the poverty line N=Total Population
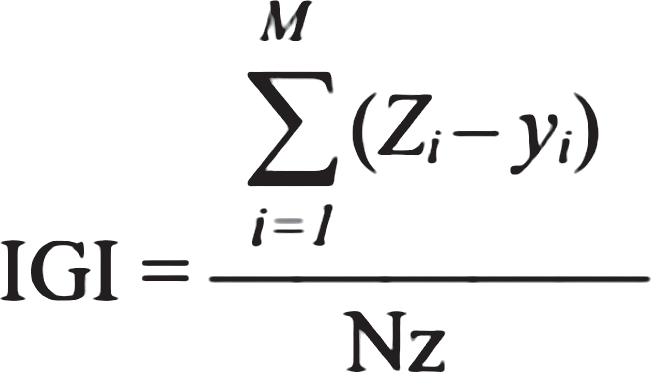
• Income Gap Index (I): The formula used in the calculation of Income Gap Index is follows:
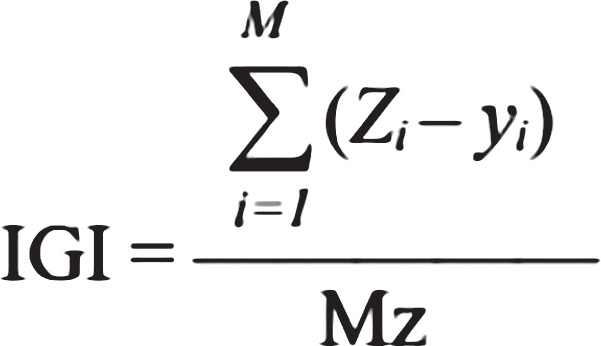
IGI = Income Gap Index
Mz = Number of people living below the poverty line
Zi = Poverty line income
yi = Mean income of the poor
• The Poverty Gap Index (P): The formula used in the calculation of PGI:
PGI = Poverty Gap Index
M = Number of people living below poverty line Nz = Number of poor population
Zi = Poverty line income
yi = Mean income of the poor
• The Sen Index (SI): Amartya Sen (1976) developed an index that considers the combined effects of the number of people living in poverty, the severity of their poverty, and the distribution of poverty within the population. The Sen Index incorporates elements from the headcount ratio, income gap index, and Gini
coefficient to provide a more comprehensive measure of poverty. The formula used in the calculation of Sen’s index is as follows
SI = H [ I + (1 – I ) G ]
Where SI = Sen Index H= Head Count Index, I= Income Gap Index G= Gini coefficient
• Global Measures to Estimate Poverty:
The United Nations Global Multidimensional Poverty Index (MPI):
Introduced in 2010 by the United Nations Development Program (UNDP) and the Oxford Poverty and Human Development Initiative (OPHI), the Multidimensional Poverty Index (MPI) assesses poverty across more than
100 developing countries. Unlike traditional poverty
measures that rely solely on income, the MPI captures deprivation across three key dimensions and ten specific indicators, as outlined below :
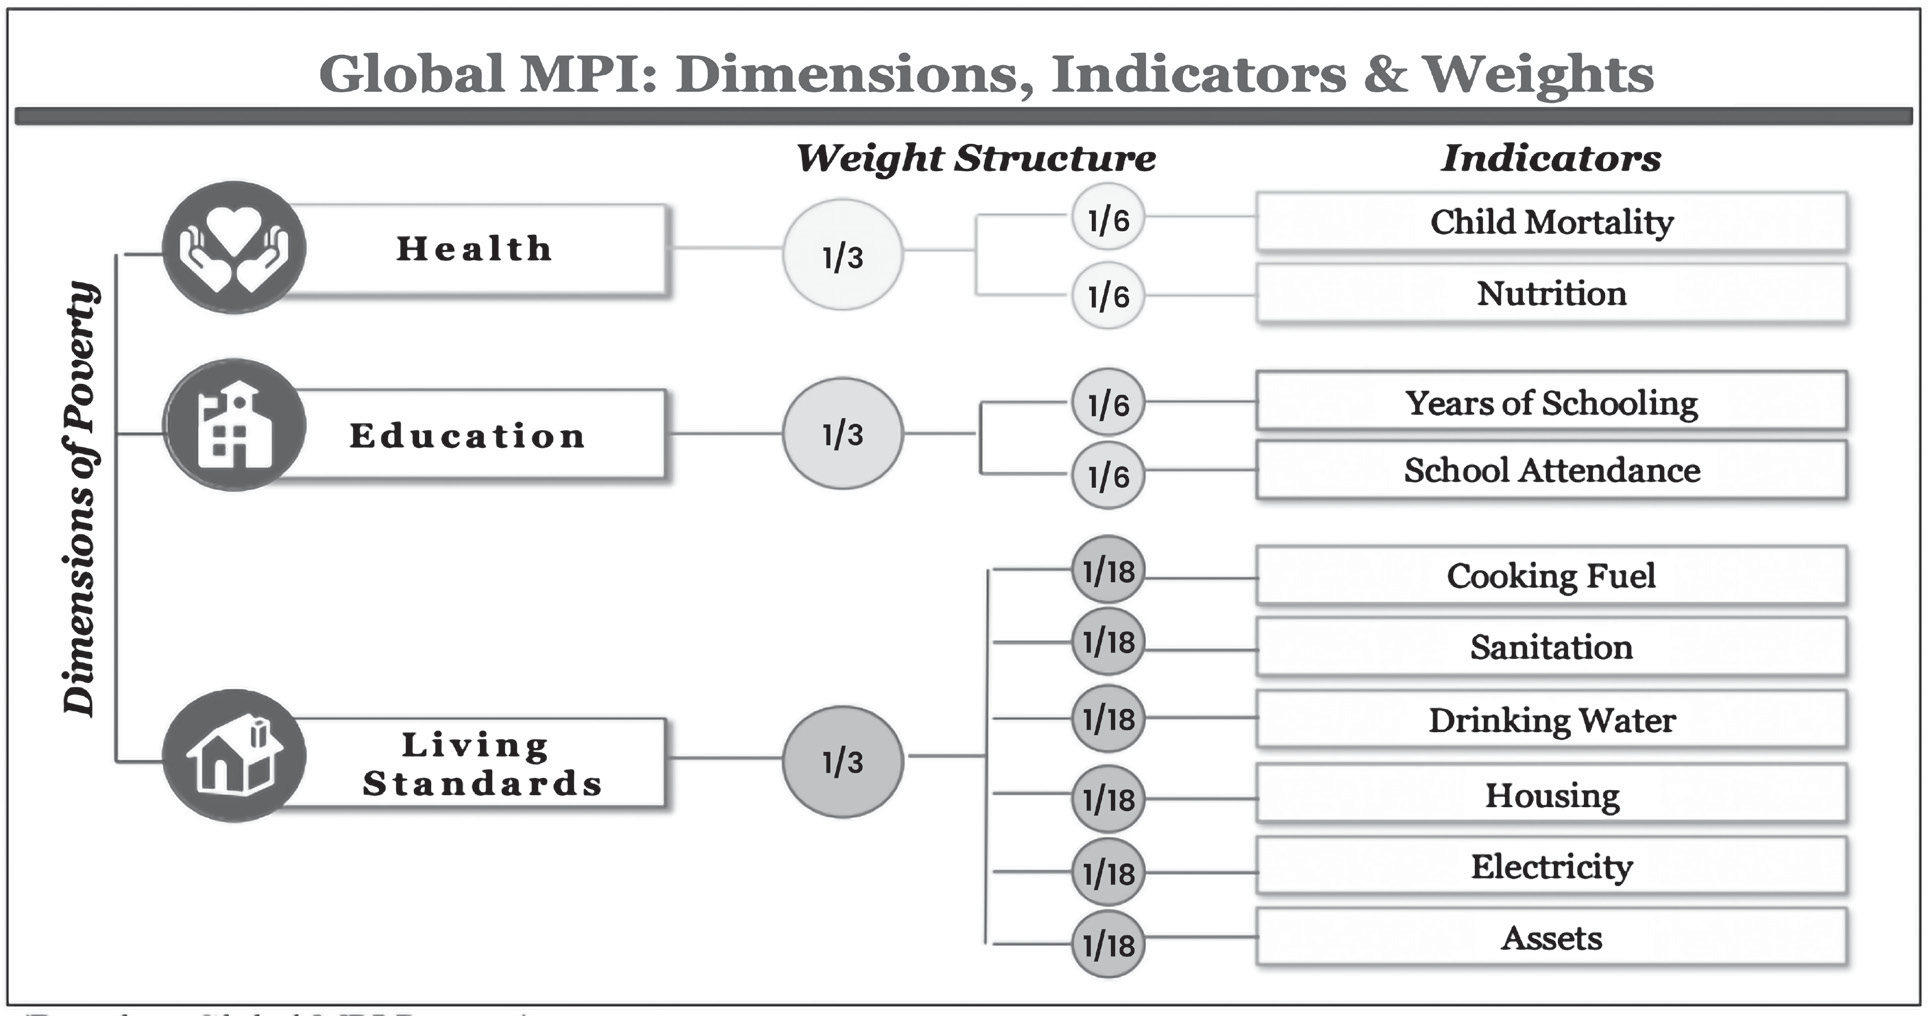
Measurement Standards: A person is classified as multidimensionally poor if they experience deprivation in at least one-third of the weighted ten indicators. Individuals who are deprived in half or more of these indicators are considered to be living in extreme multidimensional poverty.
The MPI ranges from 0 to 1, with higher values indicating greater levels of poverty. Currently, the MPI is the most comprehensive measure of multidimensional poverty, offering a broader perspective than traditional methods that assess poverty solely based on income or monetary terms.
The Multidimensional Poverty Index (MPI) integrates two factors of poverty:
Poverty Incidence refers to the percentage of people living in poverty. This is represented by the headcount ratio of multidimensional poverty (H).
• The Intensity of Multidimensional Poverty (A) measures the average percentage of dimensions in which poor individuals experience deprivation. The three dimensions of poverty considered are health, education, and standard of living.
The MPI is calculated by multiplying the poverty headcount by the intensity of poverty,
MPI = H x A (Incidence x Intensity).
Role of Various Indicators in MPI :
Role of Income: Though the, it doesn’t directly incorporate income. The inclusion of income as an indicator could result in the counting of people’s deprivations twice.
The Standard of Living, one of the key dimensions of the United Nations MPI, is a key representative input of economic wellbeing.
Other Dimensions of Wellbeing like poor health, lack of education, poor quality of work, the danger of violence, and residing in environmentally harmful locations, is considered as a corresponding measure of income poverty that underscores the progress beyond a stated limit of the monetary side of people’s lives.
In the recent 2020 Global Multidimensional Poverty Index (MPI) report state that India has recorded the biggest reduction in the number of multi-dimensionally poor
people about 273 million between 2005-06 and 2015-16.
• Measurement of Poverty in India
India has a long history of studies on measurement of poverty. The erstwhile Planning Commission was the nodal agency in India for estimation of poverty.
The estimation of poverty in India has been based on two critical components.
Consumption expenditures and its distribution
across households as provided by NSS.
• These expenditures by households are evaluated with
reference to a given poverty line.
Estimation of poverty line in India: During the Pre- Independence era ‘the Poverty and Unbritish Rule in India 1901’, ‘National Planning Committee’s ;1938’ and ‘The Bombay Plan; 1944’ were the major efforts in estimation of poverty.
Post- Independence Poverty Estimation: Various expert groups constituted by the Planning Commission have estimated the number of people living in poverty in India.
• Working Group (1962): The poverty line in India was quantified for the first time in terms of a minimum requirement (food and non-food) of individuals for healthy living. The Group formulated the separate
poverty lines for rural and urban areas (₹20 and ₹25
per capita per month respectively in terms of 1960-61 prices) without any regional variation.
• VM Dandekar and N Rath (1971): They for the first time established the consumption levels required to meet a minimum calorie norm of 2,250 calories per capita per day.
Poverty in India, based on National Sample Survey (NSS) data. They found poverty lines to be Rs. 15 per capita per month for rural households and Rs. 22.5 per capita per month for urban households at 1960‐61 prices.
Task Force on “Projections of Minimum Needs and Effective Consumption Demand” 1979: headed by Dr. Y.
K. Alagh, the task force defined the per capita consumption expenditure level to meet average per capita daily calorie requirement of 2400 kcal per capita per day in rural areas and 2100 kcal per capita per day in urban areas.
• Lakdawala Expert Group (1993): The Planning Commission constituted the Lakdawala Expert Group to “look into the methodology for estimation of poverty and to re-define the poverty line, if necessary”. It suggested their updating using the Consumer Price Index of Industrial Workers (CPI- IW) in urban areas and Consumer Price Index of Agricultural Labour (CPI-AL) in rural areas rather than using National Accounts Statistics.
• Tendulkar Expert Group (2009): The Tendulkar group did not construct a poverty line and adopted the officially measured urban poverty line of 2004-05 (25.7per cent) based on Lakdawala methodology.
• It recommended a shift away from basing the poverty lines from calorie norms.
• Secondly instead of two separate PLBs for rural and urban poverty lines, it recommended a uniform all-India urban PLB across rural and urban India.
• The national poverty line for 2011-12 was estimated at Rs. 816 per capita per month for rural areas and Rs. 1,000 per capita per month for urban area.
• Rangarajan Committee (2014): It recommended separate consumption baskets for rural and urban areas which include food items that ensure recommended calorie, protein & fat intake and non-food items like
clothing, education, health, housing and transport. As per the report, poverty line is estimated as Monthly Per Capita Expenditure of Rs. 1407 in urban areas
and Rs. 972 in rural areas.
NITI Aayog’s Multi-Dimensional Poverty Index:
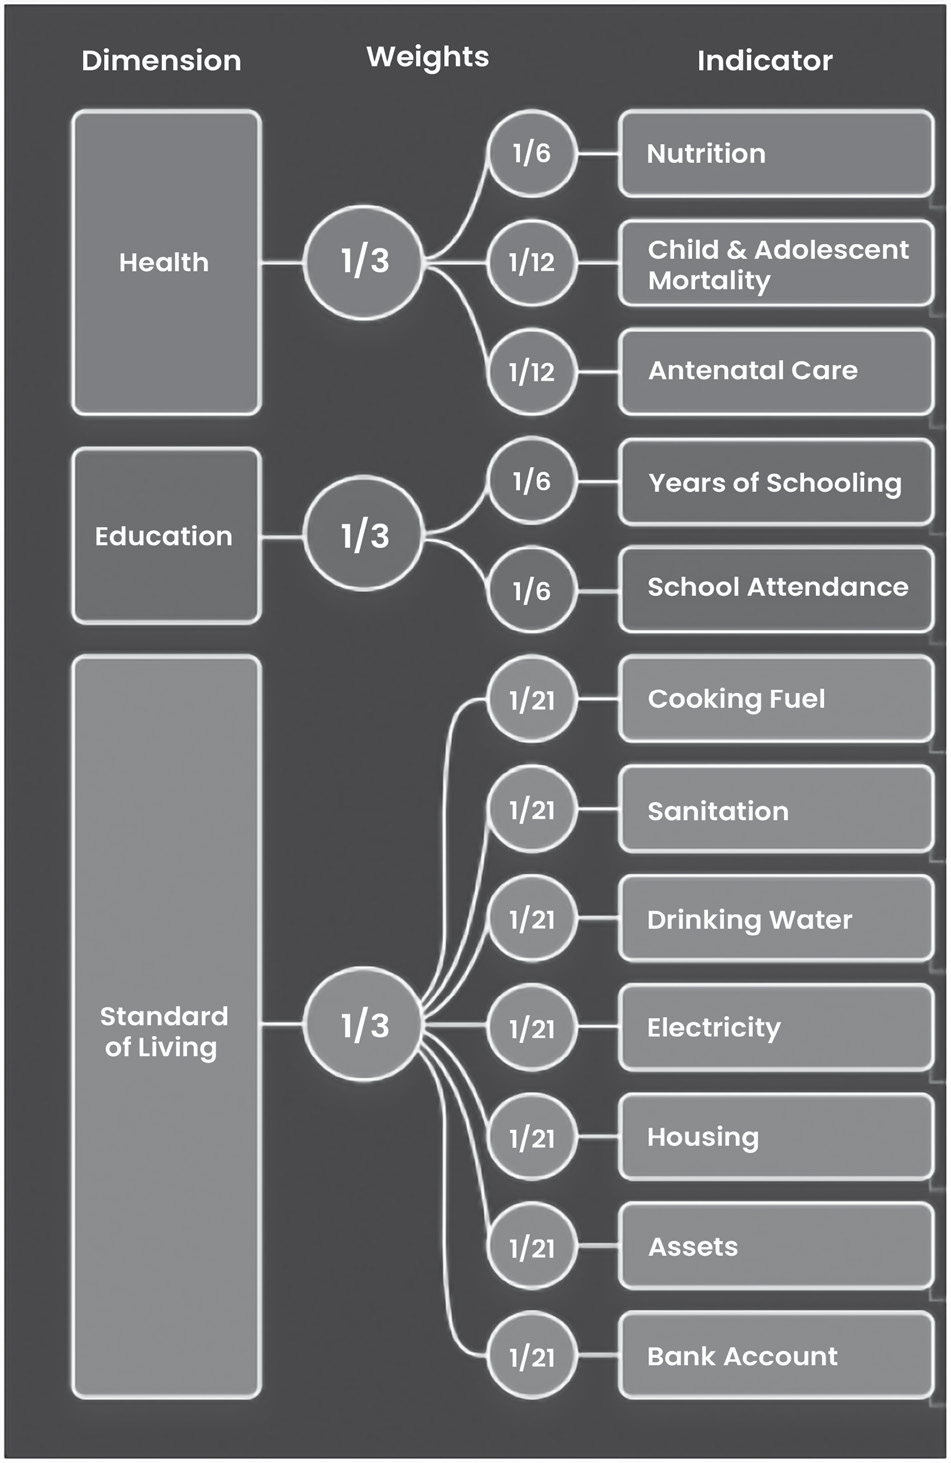
The National MPI Project is aimed at deconstructing the Global MPI and creating a customized Indian MPI for drawing up comprehensive Reform Action Plans with the larger goal of improving India’s position in the Global MPI rankings.
The National Multidimensional Poverty Index Baseline Report is based on National Family Health Survey 4 (2015-16).
The MPI aims to assess poverty across multiple dimensions, complementing traditional poverty statistics based on per capita consumption expenditure. It consists of three equally weighted dimensions: health, education, and standard of living, each represented by four indicators,
totaling twelve indicators.
The report reveals that Bihar has the highest proportion of multidimensionally poor people, with 51.91% of its population affected, followed by Jharkhand at 42.16% and Uttar Pradesh at 37.79%.
Additionally, Bihar leads in the number of malnourished individuals, followed by Jharkhand, Madhya Pradesh, Uttar Pradesh, and Chhattisgarh.
Socio Economic Caste Census 2011:
Following the recommendations of the Saxena Committee, the Ministry of Rural Development, Government of India, initiated the Socio-Economic and Caste Census (SECC) 2011 in June 2011. This was carried out through a comprehensive door-to-door enumeration across the country.
The SECC-2011 provides an analysis of the socio-economic status of both rural and urban households, allowing them to be ranked according to predefined parameters. The purpose of the SECC was not to replace the poverty line but to offer detailed information about the socio-economic conditions and educational status of various castes and population groups, enabling households to be ranked based on their socio-economic standing to help identify those living below the poverty line.
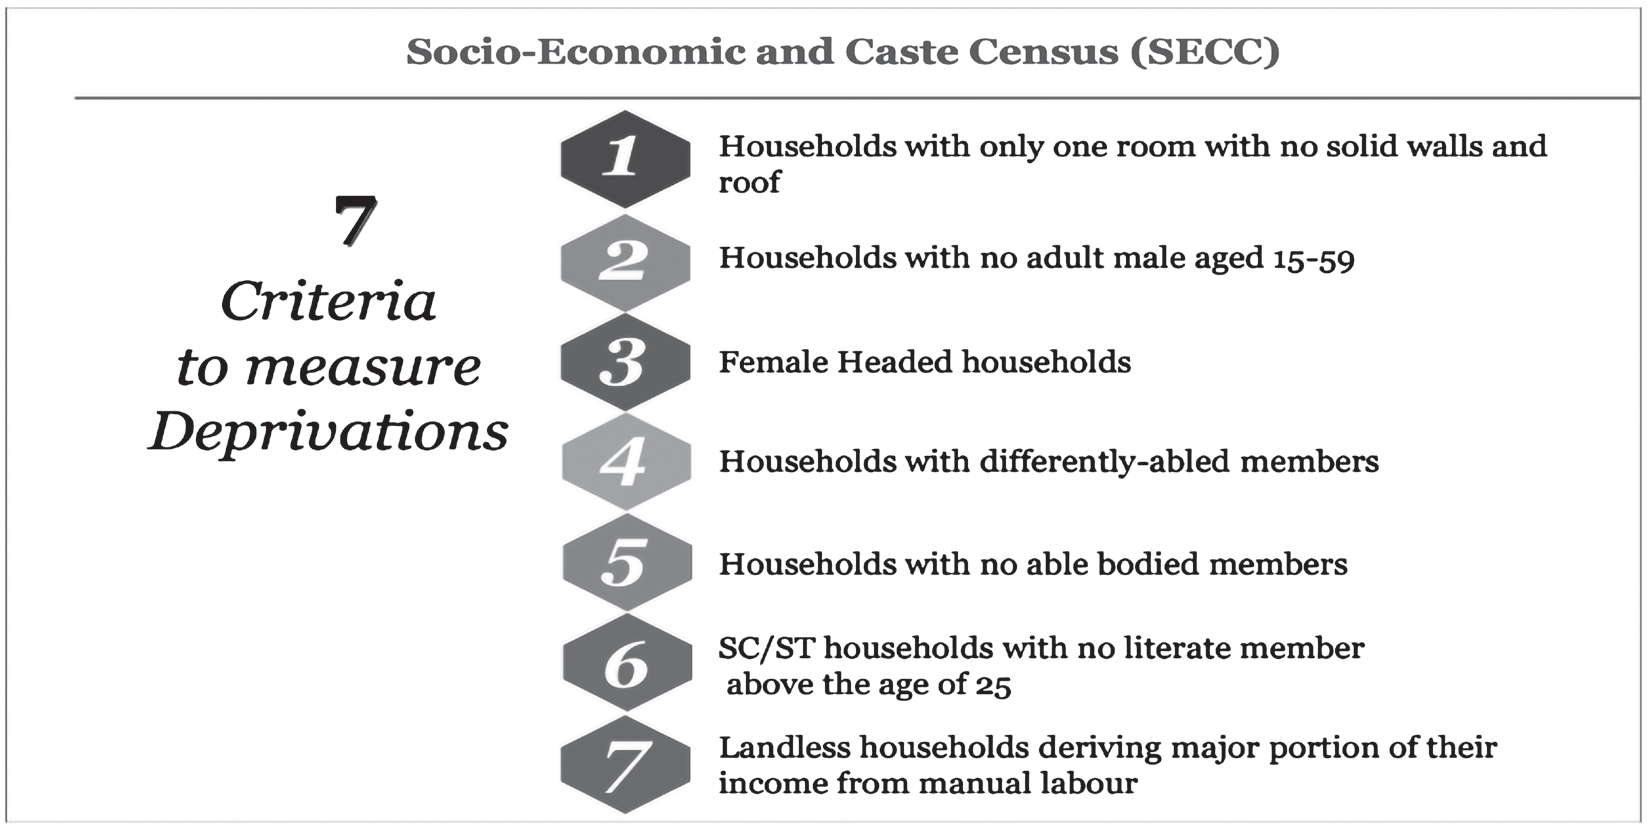
Unlike BPL Censuses, SECC-2011 allows for the first time to track the deprivation of households and address gaps effectively with focus on multi-dimensionality of poverty.
The Sumit Bose Committee (2017) recommended using SECC 2011 data to identify beneficiaries for all centrally sponsored, central and state government schemes as far as possible.
Deprivation Data of Rural India; SECC; 2011
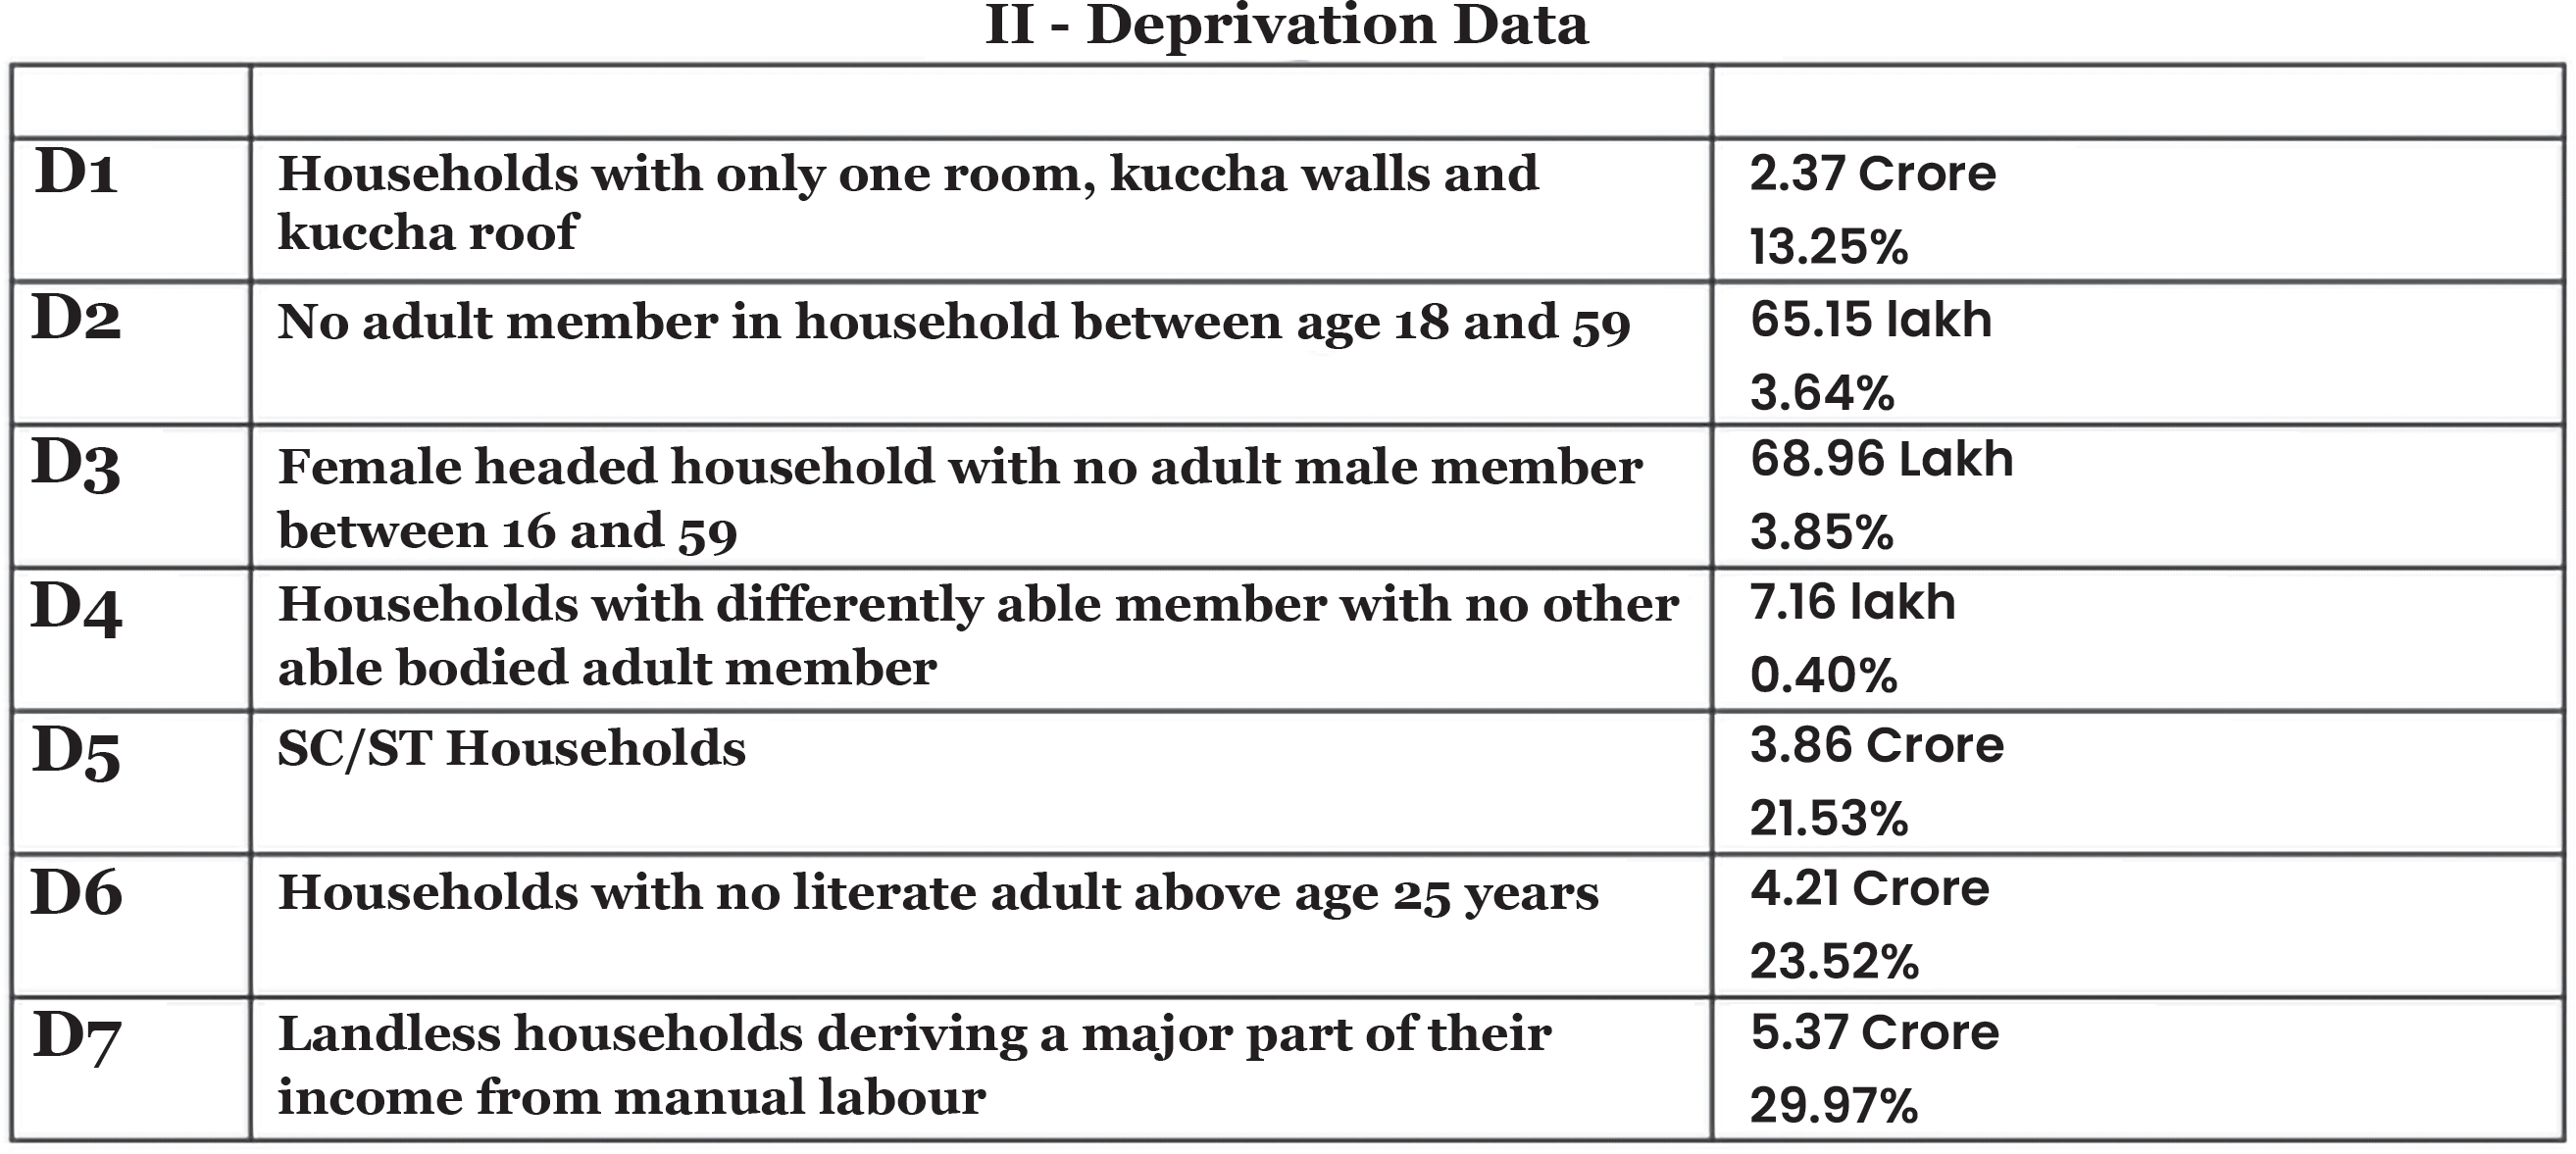
Use of SECC data in the implementation of Government programmes allows for evidence based developmental interventions. The selection of beneficiaries gets validated through Gram Sabhas, while identity is established through Aadhaar.
This leads to selection of right beneficiaries and minimizes duplication and fraud. This has substantially enhanced the effectiveness of government‘s efforts to tackle multi-dimensional poverty, going beyond income or expenditure-based poverty.
Poverty and Good Governance
The relationship between good governance and poverty is complex. On the one hand good governance and effective implementation of policies is a pre-request for eliminating poverty, while on the other hand poverty poses a challenge in good governance.
For example, subsidy on fuel is supposed to benefit the poor and vulnerable section but it’s the affluent section who benefits most from it.
One of the prime examples of how good governance could be a means to end poverty is the achievements of present regime in India. Government’s efficient implementation of policies, rationalization of schemes and strict monitoring has led to persistent decline in poverty in India in last few years.
Government characterized by high level of corruption correlates with poverty and deprivation. This relationship holds across all the development goals related to poverty and hunger whether it is education, maternal and child health, communicable diseases, water and sanitation etc.
In countries where the government is transparent and accountable, progress has been made in achieving the SDGs. Therefore, good governance is key to poverty alleviation.
Implement nationally appropriate social protection systems and measures by 2030 to achieve substantial coverage of the poor and the vulnerable.
To ensure that all men and women, have equal rights to economic resources, access to basic services, ownership and control over natural resources, and access to financial services, including microfinance.
To build the resilience of the poor and those in vulnerable situations and reduce their exposure and vulnerability to climate-related extreme events.
Ensure significant mobilization of resources through enhanced development cooperation, in order to provide adequate and predictable means for developing countries, to implement programmes and policies to end poverty in all its dimensions.
Create sound policy frameworks at the national, regional and international levels, based on pro- poor and gender-sensitive development strategies, to support accelerated investment in poverty eradication actions.
Performance
Between 2015 and 2018, global poverty continued its historical decline, with the poverty rate falling from
10.1 per cent in 2015 to 8.6 per cent in 2018.
However, owing to the COVID-19 pandemic, the global poverty rate increased sharply from 8.3 per cent in 2019 to 9.2 per cent in 2020, representing the first increase in extreme poverty since 1998.
This unprecedented reversal is being further exacerbated by rising inflation and the impacts of the war in Ukraine.
The losses have been much higher for low-income countries, where poverty reduction target has been dragged back by eight and nine years.
For the first time in two decades, the world’s share of workers living below the international poverty line increased to 7.2 per cent in 2020, that means additional 8 million workers were pushed into poverty.
However, India’s progress in the Global Multi- dimentional poverty Index shows that the Sustainable Development Goal 1.2 to reduce poverty is feasible, even at a large scale.
Steps Taken for Poverty Alleviation During the Plan Period:
• In 1947, India was characterized with widespread
poverty, mass illiteracy, low level of production.
Therefore, immediately after the independence, the Five-Year Plans were launched for better utilization of the country’s resources in development efforts.
• The First Five Year Plan (1951-56) stated that “the central objective of planning in India is to raise the standard of living of the people. It invested 44per cent of the budget in rural development and social welfare. The primary focus was on agriculture and irrigation.
• The Second plan focussed on basic and heavy industries that increased the national income by 25 percent and generated employment to some extent.
• The Third plan saw two wars and severe drought that hampered the poverty alleviation efforts of the government. However, successive five-year plans continued to emphasize poverty eradication as one of the key objectives.
• The Fifth Five Year Plan (1974-1979) with the call of ‘Garibi Hatao’ mainly focused on the removal of poverty and aimed in bringing larger sections of the poor masses above the poverty line.
• The fifth plan also assured a minimum income of Rs. 40 per person per month calculated at 1972-73 prices. The plan was terminated in 1978 when the Janata Government came to power.
• Removal of poverty was the main objective of the Sixth five-year plan (1980-85) with a major focus on economic growth, elimination of unemployment, self-sufficiency in technology, and raising the lifestyles of the weaker sections of the society.
• Similarly, the Seventh Five Year Plan aimed at improving the living standards of the poor with a significant reduction in the incidence of poverty.
• The Tenth Five-Year Plan set a goal to reduce the poverty ratio from 26% to 21% by 2007, while also ensuring that children complete at least five years of schooling by the same year.
Key Tools for Poverty Alleviation
• Micro finance
• Self Help Group – Bank Linkage Programme (SHG- BLP): SHG-BLP has evolved as a cost-effective mechanism for providing financial services to the unreached and underserved poor households. What started as a pilot project to link 500 SHG in 1992-93, has now become the largest microfinance programme in the world.
• The savings-led microfinance model has evolved into the world’s largest coordinated financial inclusion program, reaching nearly 100 million households across the country. With over 84% of the groups consisting exclusively of women, the program has played a crucial role in advancing women’s empowerment in the nation
• Social spending by government: Social spending by government on welfare measures is an important way of eradicating poverty and hunger. However, it is noteworthy that GoI spends only a fifth of its total expenditure on the social sector. State governments, conversely, devote a higher share to social sector spending.
According to the Economic Survey 2021-22, government’s spending on Social Services increased significantly during the pandemic. The Survey states that the Centre and the State governments earmarked an aggregate of Rs. 71.61 lakh crore for spending on social service sector.
However, as per centage of GDP India’s social sector expenditure has grown in snail pace with just 7.7per cent of the gross domestic product.
• Poverty Alleviation Programmes:
India is working on a two-pronged strategy to eliminate poverty, which lies at the core of India’s national development agenda i.e.
• Maintaining an average annual GDP growth rate of 8 per cent in real terms is a critical element of the strategy for the creation of remunerative jobs for new entrants to the labour market.
• Targeted programmes aim to directly attack various facets of poverty and help the poor.
Over the last few years, thrust on the poor and deprived households is reflected across a range of interventions covering food security, nutrition support, housing for all with basic amenities, education for all, universal health coverage, road connectivity, social security, employment, livelihood diversification, skill development, etc.
• Pradhan Mantri Jan Dhan Yojana is ensuring financial inclusion of poor households by providing universal access to banking facilities, access to credit and insurance cover.
• Ayushman Bharat Yojana aims to provide universal health protection to poor and vulnerable population.
• Quality homes for the deprived under the PMAY with basic amenities like LPG, electricity, drinking water, toilet, etc. are helping to bridge the deprivation gap.
• The thrust on durable assets that generate incomes (farm ponds, wells, goat shed, cattle shed, housing support, etc.) through individual beneficiary schemes under MGNREGS is a key intervention for faster poverty reduction.
• With over 6 crore households mobilized into Self Help Groups under the DAY-NRLM, the country is witnessing large scale social capital formation across the rural India.
Use of the SECC 2011 data for beneficiary selection along with the use of IT/Direct Benefit Transfer (DBT), Aadhaar, geo-tagging, and other governance and financial reforms has transformed the delivery of benefits to the poor.
• The expansion of all- weather rural roads under the Pradhan Mantri Gram Sadak Yojana (PMGSY) has strengthened the ability of deprived households to leverage markets to their advantage.
India’s Achievements in Poverty Alleviation
A recent World Bank Report has shown that extreme poverty in India more than halved between 2011 and 2019 i.e., from 22.5 per cent to 10.2 per cent.
The reduction in poverty was higher in rural areas as compared to urban areas. The rate of decline in poverty between 2015 and 2019 was faster compared to 2011-2015.
The significant reduction in poverty in last one decade can be attributed to government’s thrust on improving the ease of living of ordinary Indians through schemes such as the Ujjwala Yojana, PM Awas Yojana, Swachh Bharat Mission, Jan Dhan Yojana and Mission Indradhanush in addition to the Deendayal Antyodaya Yojana-National Rural Livelihood Mission and improved coverage under the National Food Security Act.
Government’s janbhagidari based thrust on pro-poor public welfare that ensured social support for the endeavor has been instrumental in rapid decline in poverty rate especially in the rural areas.
Landmark Measures taken to address Rural Poverty in India
• The identification of deprived households on the basis of the Socioeconomic and Caste Census (SECC) 2011 across welfare programmes helped in creating a constituency for the well-being of the poor, irrespective of caste, creed or religion.
• The coverage of women under the Deendayal Antyodaya Yojana and the phenomenal jump in the number of SHGs from 2.5 crore in 2014 to over 8 crores in 2018 and these SHGs working closely with over 31 lakhs elected panchayati raj representatives, 40 per cent of whom are women provided a robust framework to connect with communities and created a social capital that helped every Programme.
• Finance Commission transfers directly to gram panchayats leading to the creation of basic infrastructure like pucca village roads and drains at a much faster pace in rural areas.
• The benefits of Gram Swaraj Abhiyan such as gas and electricity connections, LED bulbs, accident insurance, life insurance, bank accounts and immunisation were provided to SC/ST dominated 6,3974 villages.
• Universal Coverage for individual household latrines, LPG connections and pucca houses ensured that no one was left behind.
• The thrust on “Sabki Yojana Sabka Vikas” for preparing the Gram Panchayat Development Plans from 2017-18 onwards, laid the foundation for robust community participation involving panchayats and SHGs.
• Through processes like social and concurrent audits, efforts were made to ensure that resources were fully utilized. Several changes were brought about in programmes like the MGNREGS to create durable and productive assets.
• Launched in 2018, the 'Transformation of Aspirational Districts' initiative aims to address regional disparities by driving a mass movement focused on the rapid and effective transformation of these districts. The core strategy revolves around Convergence (integrating Central and State schemes), Collaboration (involving Central and State 'Prabhari' officers and District Collectors), and fostering healthy Competition among districts, all powered by a collective spirit of progress.
• Led by the States, this program will leverage the unique strengths of each district, identify opportunities for immediate improvement, track progress, and rank the districts accordingly.
• A total of 115 districts were selected from 28 states, with at least one district from each state. The selection process was conducted transparently by a committee of Senior Government of India Officers in consultation with State Officials, using a composite index that includes data on deprivation from the Socio-Economic Caste Census, key health and education indicators, and the status of basic infrastructure.
• Swajal Scheme 2018: The goal is to ensure that every rural individual has access to sufficient safe water for drinking, cooking, and other essential domestic needs, on a sustainable basis. This water should meet minimum quality standards and be easily accessible at all times and under all circumstances.
• The National Rural Drinking Water Programme, developed by the Ministry of Jal Shakti, is a demand-driven and community-centered initiative aimed at ensuring sustainable access to drinking water for rural populations.
• SVAMITVA (Survey of villages and mapping with improvised technology in village areas) scheme: This new initiative by the Ministry of Panchayati Raj aims to empower rural residents by granting them the right to document their residential properties, enabling them to use their property for economic purposes.
•
The scheme involves surveying land parcels in rural inhabited areas using drone technology. The surveys will be conducted nationwide in phases from 2020 to 2025.
• The scheme is designed as a Central Sector initiative.
• Pradhan Mantri Khanij Kshetra Kalyan Yojana: This program is designed to promote the welfare of communities affected by mining activities, particularly focusing on scheduled tribes living in predominantly Fifth Schedule areas.
• The PMKKKY is specifically aimed at protecting the health, environment, and economic well-being of tribal communities while providing them with opportunities to benefit from the mineral resources extracted from their regions.
• The Pradhan Mantri Khanij Kshetra Kalyan Yojana (PMKKKY) will be implemented by the District Mineral Foundations (DMFs) in the respective districts, utilizing funds generated by the DMF.
• Pradhan Mantri Adarsh Gram Yojana (PMAGY): It is a Government of India initiative for the empowerment of deprived sections, aims to achieve integrated development of selected villages through convergent implementation of all relevant Central and State schemes.
• Launched in March 2010 on a pilot basis, the scheme focuses on the integrated development of 1,000 villages, each with more than 50% SC population.
• The vision of an “Adarsh Gram” (Model Village) includes providing adequate physical and institutional infrastructure, ensuring that the basic needs of all community members are fully met. It aims to create a harmonious environment where people live in unity with one another and with nature, in a progressive and dynamic village.
• These villages are to be equipped with all necessary facilities for dignified living, fostering an environment where all residents can realize their full potential.
• The primary objective of the ‘Adarsh Gram’ component under the merged Pradhan Mantri Anusuchit Jaati Abhyuday Yojana (PM AJAY) is the integrated development of villages with a majority SC population.
• Primarily through convergent implementation of the relevant Central and State Schemes; and,
• To take up identified activities, which do not get covered under the existing Central and State Government Schemes, through ‘Gap-filling’ funds provided as Central Assistance to the extent of Rs.20.00 lakh per village.
• Sansad Adarsh Gram Yojana (SAGY) 2014: The goal is to develop three Adarsh Grams by March 2019, with the first one to be achieved by 2016. Following this, five more Adarsh Grams (one per year) will be selected and developed by 2024.
• Inspired by the values and principles of Mahatma Gandhi, the scheme emphasizes fostering national pride, patriotism, community spirit, and self- confidence, alongside developing essential infrastructure.
• SAGY aims to preserve the essence of rural India while providing its people with access to quality basic amenities and opportunities to shape their own future.
• An Adarsh Gram is built through a shared vision of the people, utilizing their resources and capacities, with joint efforts from the Gram Panchayat, civil society, and the government, under the guidance of the Hon’ble Member of Parliament. The Village Development Plans (VDPs) created under SAGY are developed through a participatory process, led by the Hon'ble Members of Parliament. These VDPs include prioritized, time-bound actions aimed at achieving the village’s overall development.
All these factors contributed in improving ease of living
of deprived households and improving their asset base.
Landmark Measures Taken to Address Urban Poverty in India
Urban development is primarily a state subject, with the Ministry of Housing and Urban Affairs supporting
States and Union Territories (UTs) through various missions and schemes. These include the Atal Mission for Rejuvenation and Urban Transformation 2.0 (AMRUT 2.0), Smart Cities Mission, Swachh Bharat Mission-Urban
2.0 (SBM-U 2.0), Pradhan Mantri Awas Yojana-Urban (PMAY-U), Deendayal Antyodaya Yojana-National Urban Livelihoods Mission (DAY-NULM), PM Street Vendor’s AtmaNirbhar Nidhi (PM SVANidhi), and various urban transport schemes.
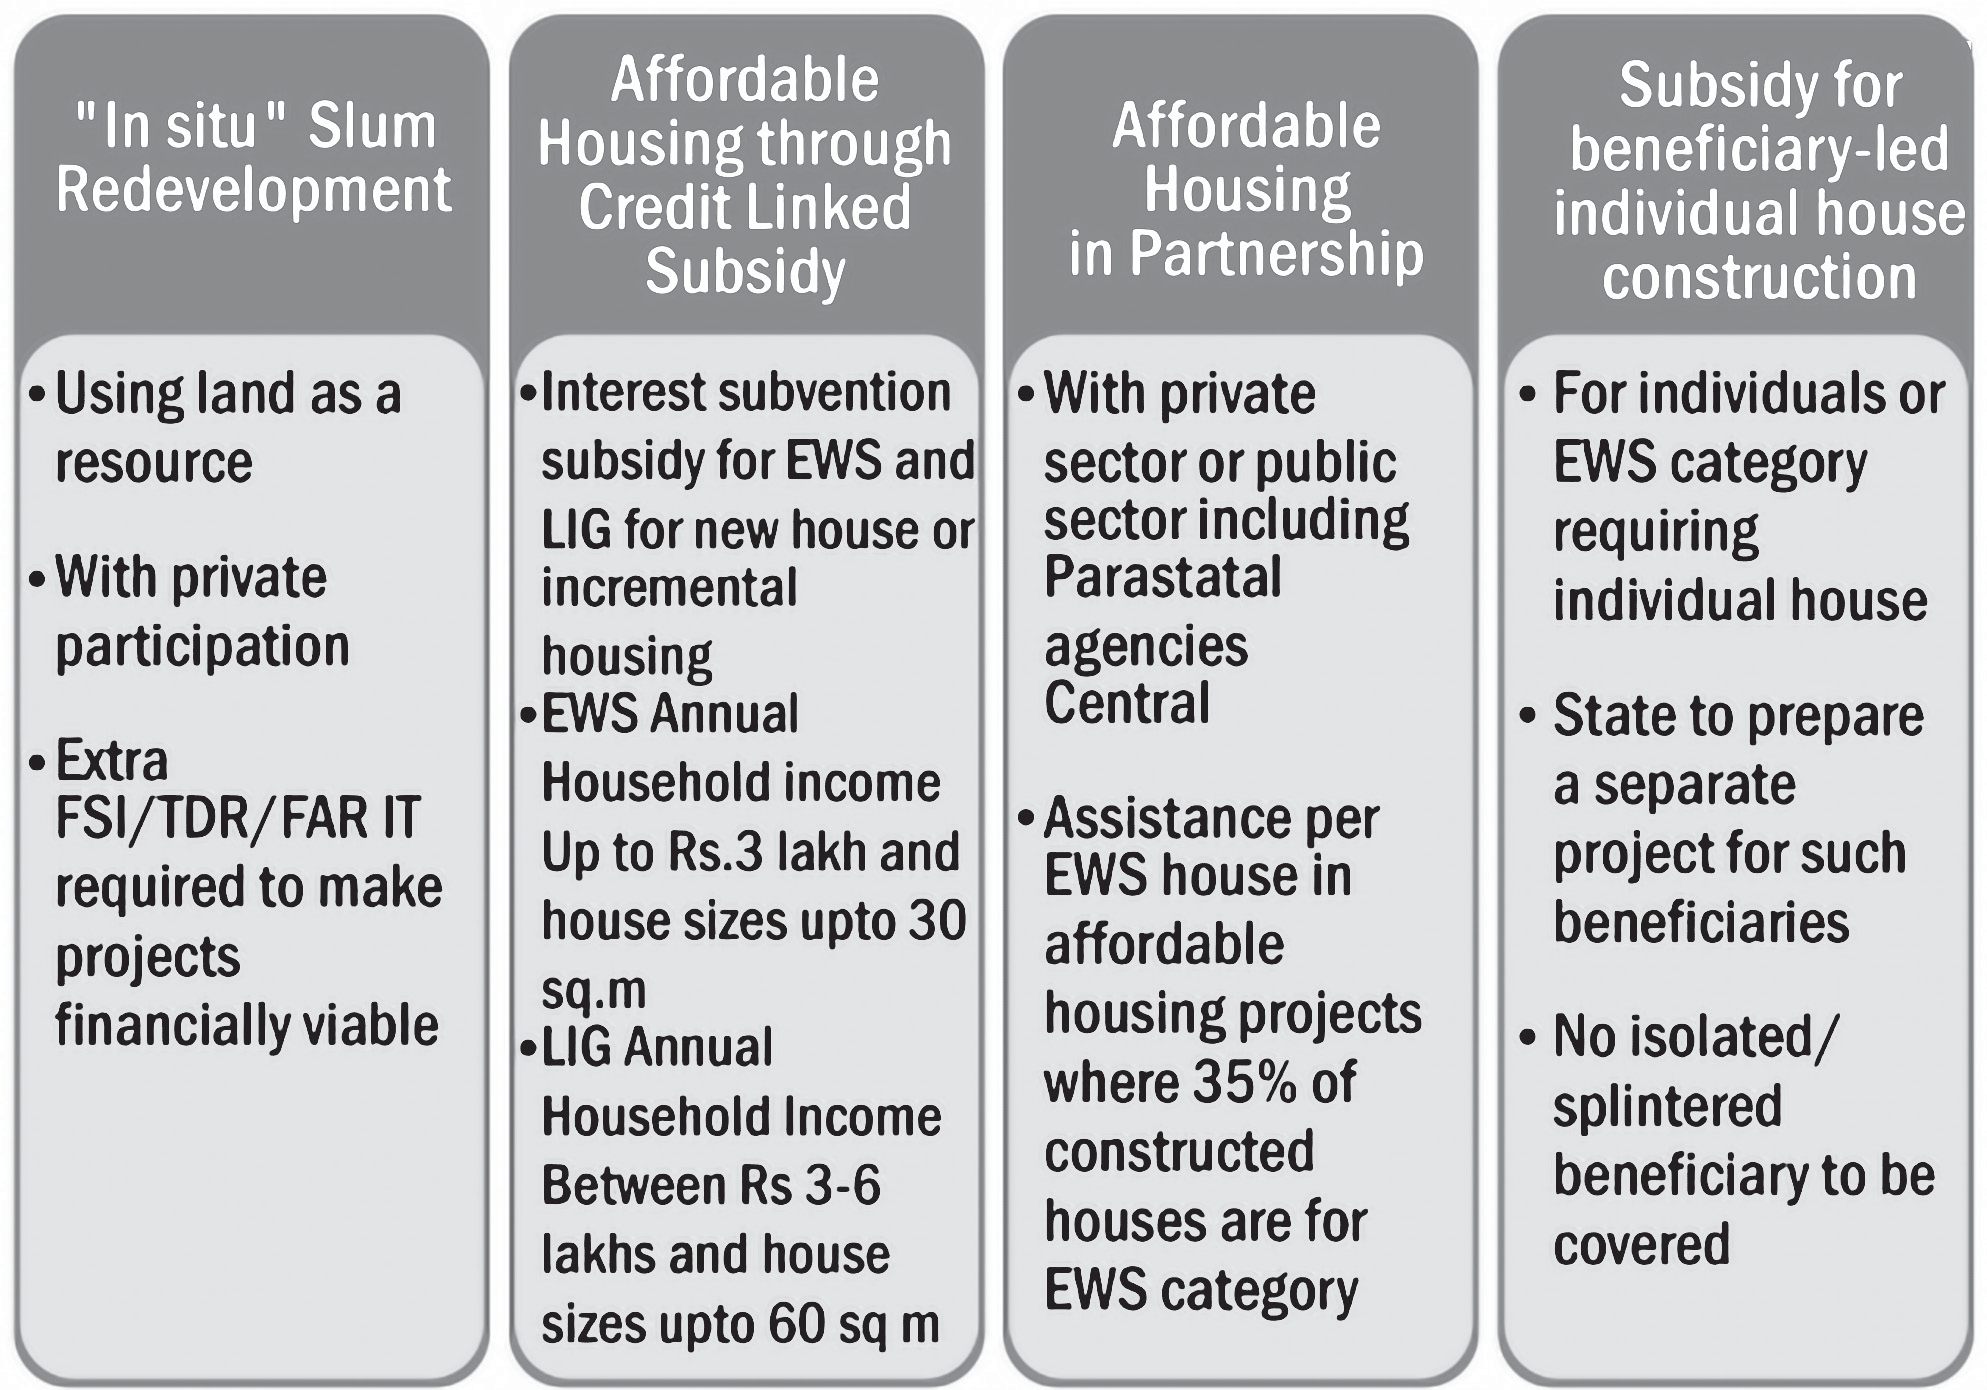
• Pradhan Mantri Awas Yojana (Housing for All - Urban) :The Pradhan Mantri Awas Yojana (Urban) program, launched by the Ministry of Housing and Urban Poverty Alleviation (MoHUPA), aims to achieve Housing for All by 2022, coinciding with the nation’s 75th year of Independence.
• This mission covers all urban areas, including Statutory Towns, Notified Planning Areas, Development Authorities, Special Area Development Authorities, Industrial Development Authorities, and any other authorities under state legislation responsible for urban planning and regulation.
• The "Housing for All" mission, set to run from 2015 to 2022, provides central assistance to implementing agencies through States and UTs to ensure that all eligible families and beneficiaries receive housing by 2022.
• The mission will be executed as a Centrally Sponsored Scheme (CSS), with the exception of the credit-linked subsidy component, which will be managed as a Central Sector Scheme.
• Employment oriented urban poverty alleviation Schemes like Centrally-sponsored scheme named Swarna Jayanti Shahari Rozgar Yojana (SJSRY), 1997.
• The scheme strives to provide gainful employment to the urban unemployed and under-employed poor, through encouraging the setting up of self- employment ventures by the urban poor living below the poverty line, and also through providing wage employment by utilizing their labour for construction of socially and economically useful public assets.
• Launched in 2020, the PM Street Vendor’s AtmaNirbhar Nidhi (PM SVANidhi) scheme aims to provide easy access to micro-credit for street vendors in urban areas, helping them restart their businesses that were impacted by the Covid-19 pandemic. Under this scheme, street vendors can receive a working capital loan of up to Rs. 10,000, followed by loans of Rs. 20,000 and Rs. 50,000 in the second and third tranches, respectively, upon repaying the previous tranche.
• Sanitation and Hygiene through Swachh Bharat Mission-Urban (SBM-U) of 2014 had objectives of
• Attaining 100% Open Defecation Free (ODF) status across all States and Urban Local Bodies (ULBs).
• Ensuring 100% scientific processing of municipal waste throughout the country.
• Promoting behavior change through a Jan Andolan in all statutory towns.
• The "Deendayal Antyodaya Yojana - National Urban Livelihoods Mission (DAY-NULM)" aims to alleviate poverty and reduce the vulnerability of urban poor households in statutory towns by providing access to sustainable self-employment and skilled wage employment opportunities. The mission focuses on improving livelihoods through the establishment of strong grassroots-level institutions for the urban poor.
• The mission seeks to provide shelters with essential services to the urban homeless.
• Additionally, it addresses the livelihood challenges faced by urban street vendors by facilitating access to appropriate spaces, institutional credit, and social security.
• The Employment through Skill Training & Placement (EST&P) component aims to equip the urban poor with market-oriented skills, helping them establish self-employment ventures or secure salaried employment.
• The Self-Employment Programme (SEP) component offers financial support to individuals, groups, or Self-Help Groups (SHGs) of the urban poor to set up viable self-employment ventures or micro-enterprises.
•
Jal Jeevan Mission Urban: The Jal Jeevan Mission (Urban) aims to provide universal water supply coverage to all households in 4,378 statutory towns through functional taps, in line with Sustainable Development Goal 6 ("Clean Water and Sanitation for All"). Another key focus is to ensure the provision of sewerage and septage management in 500 AMRUT cities.
• The mission also focuses on rejuvenating water bodies to enhance sustainable freshwater supply, creating green spaces, and developing sponge cities to mitigate flooding and improve amenity value, all under an Urban Aquifer Management plan.
• JJM(U) will promote a circular water economy by developing a city water balance plan for each urban area. This plan will emphasize the recycling and reuse of treated sewage, water conservation, and the rejuvenation of water bodies, aiming to meet 20% of water demand through reused water, with a strong institutional framework in place.
• An Information, Education, and Communication (IEC) campaign will raise public awareness about the importance of water conservation.
• Pey Jal Survekshan will be conducted in cities to assess the equitable distribution of water, the reuse of wastewater, and to map water bodies based on water quality and quantity through a competitive challenge.
• The mission includes a reform agenda that focuses on strengthening urban local bodies and ensuring water security for cities. Major reforms are
Reducing non-revenue water to below 20%.
Recycling treated wastewater to meet at least 20% of the city’s total water demand and 40% of industrial water demand at the state level.
Implementing dual piping systems.
Installing electric vehicle charging stations.
Providing Wi-Fi infrastructure in new buildings.
Enhancing land use efficiency and unlocking value through effective urban planning.
Developing GIS-based master plans for cities.
Raising funds through the issuance of municipal bonds.
Rejuvenating water bodies.
• Light House Projects (LHPs) are being built as part of the Global Housing Technology Challenge-India (GHTC- India) initiative under the Pradhan Mantri Awas Yojana-Urban (PMAY-U), an initiative of the Ministry of Housing and Urban Affairs
Members of Parliament Local Area Development Scheme (MPLADS) is an ongoing Central Sector Scheme which was launched in 1993-94. The Scheme enables the Members of Parliament to recommend works for creation of durable community assets based on locally felt needs to be taken up in their constituencies in the areas of national priorities namely drinking water, education, public health, sanitation, roads etc.
The Ministry of Statistics and Programme Implementation has been responsible for the policy formulation, release of funds and prescribing monitoring mechanism for implementation of the Scheme.
It is the proactive use of fiscal policy combined with effective targeting that marks a crucial departure from the earlier attempt of spending money "in the name of the poor". This departure has delivered in terms of ensuring that the benefits of growth are more equitably distributed across a wider class of citizens
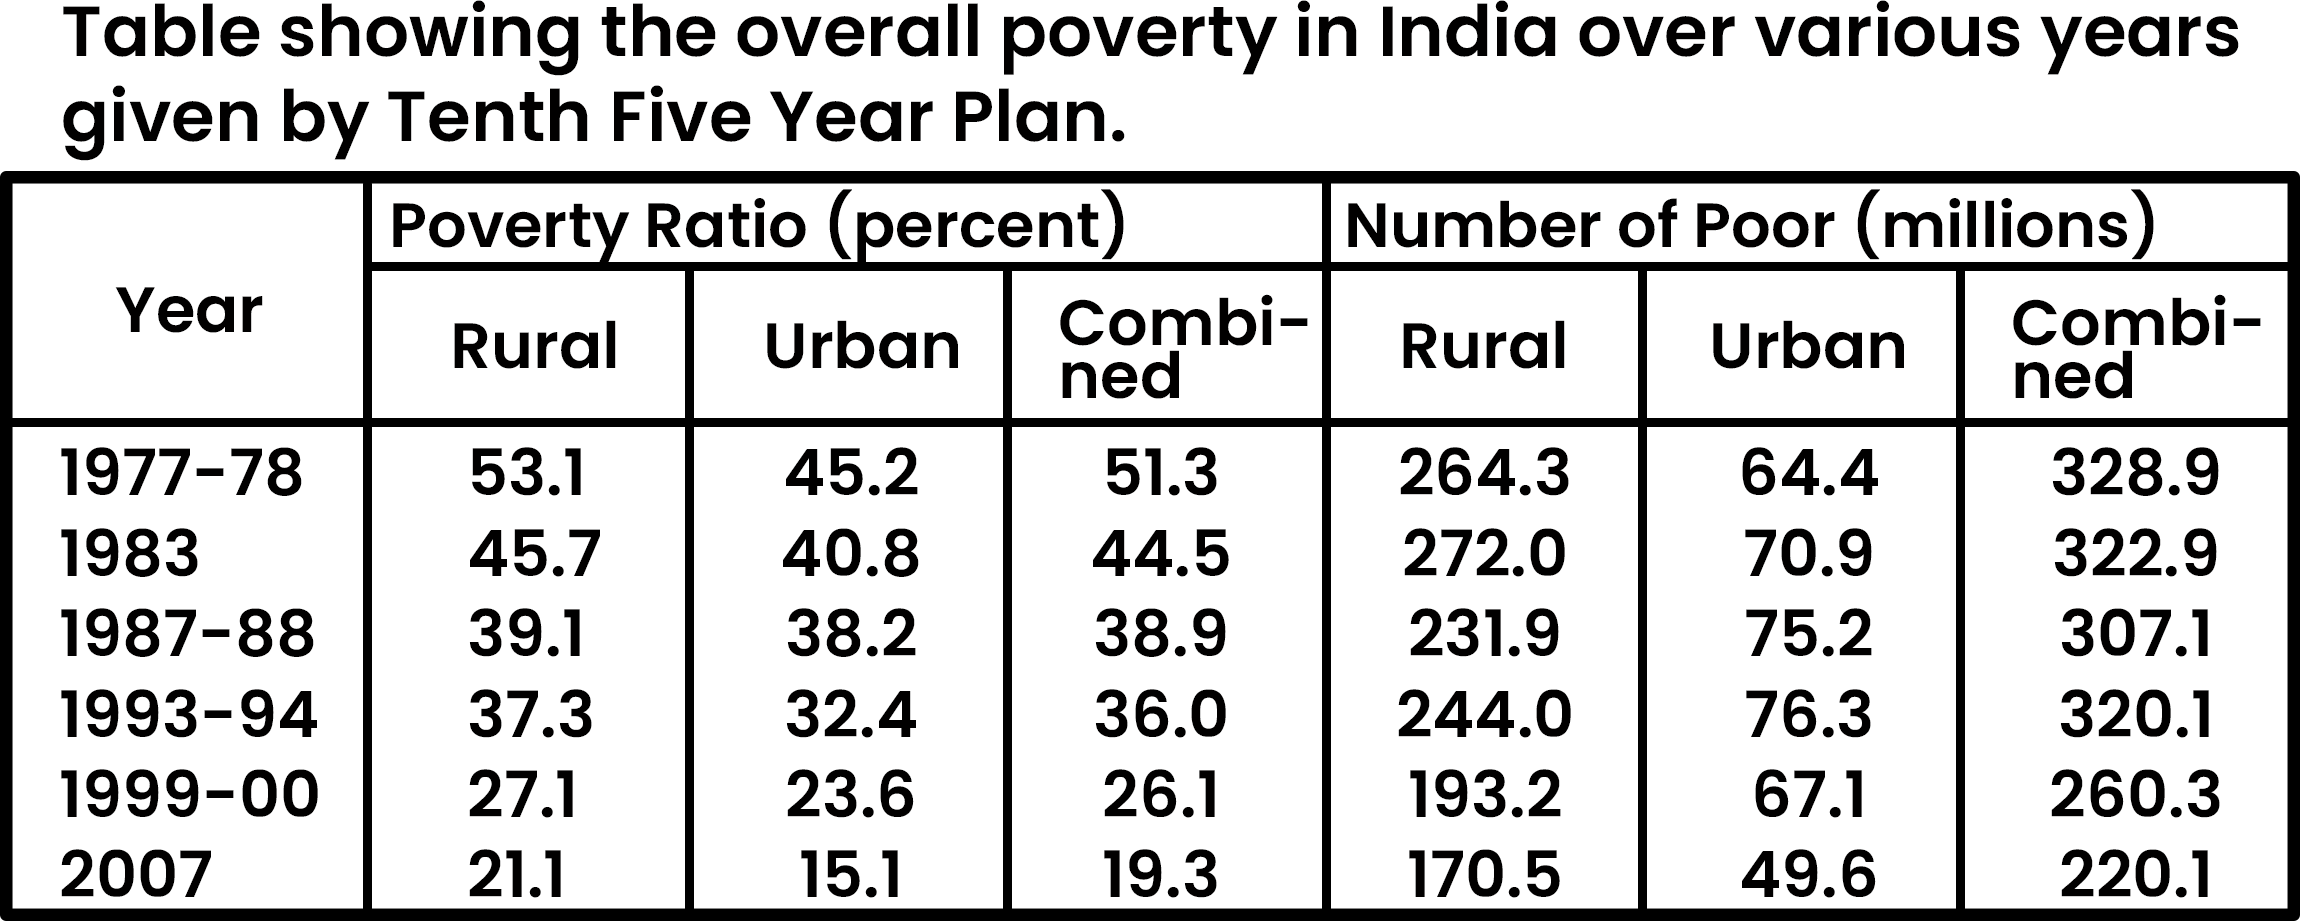
Impact of COVID 19 and Russia-Ukraine War on Inequality and Poverty
Inequality has been widening as a result of the pandemic and accelerated due to Russia-Ukraine War, a reversal in trend in many decades. Like the recovery from
the pandemic, the dip in poverty has been uneven. The
developing and poor countries have added the maximum new poor and the poverty level among the poor have further deepened in these countries.
COVID-19 Pandemic
The World Bank estimates that this pandemic will push an additional 88 million to 115 million people into extreme poverty with the total rising to about 150 million by 2021 where the new poor would be in countries already having high poverty rates.
A new study from the United Nations Development Programme (UNDP) has found that an additional 207 million people could be pushed into extreme poverty by 2030 due to the severe long-term impact of the coronavirus pandemic, bringing the total number of the world’s extremely poor to more than a billion.
The World Bank's latest report, Poverty and Shared Prosperity 2022: Correcting Courses, highlights that in regions like sub-Saharan Africa and rural areas of many poor and developing countries, eradicating poverty seems nearly impossible given the current circumstances.
The pandemic served as an unprecedented economic shock. In 2020, it pushed an additional 70 million people into poverty, raising the global number of those living below the international extreme poverty line of
$2.15 per day to 719 million, resulting in a poverty rate of 9.3%, compared to 8.4% in 2019.
The report projects that by 2030, around 7% of the global population—approximately 574 million people—will remain trapped in extreme poverty. This is more than double the SDG1 target of reducing
poverty to 3%.
"The poorest individuals bore the heaviest costs of the pandemic: income losses averaged 4% for the bottom 40%, twice the losses experienced by the wealthiest 20%," the report states
Case of India
India implemented one of the earliest and most stringent lockdowns in response to the pandemic, which brought the economy to a halt, resulting in widespread unemployment, hunger, distress, migration, and significant hardship. The Inequality Virus Report by Oxfam International found that the Covid-19 crisis significantly deepened existing inequalities both in India and globally.
• Education: Less than a third of schoolchildren had access to online education, revealing a stark digital divide and deepening class inequalities.
• Health and Nutrition: The health and nutrition of the poor, especially the elderly, children, and women, were severely affected due to disruptions in regular health services and Anganwadi programs.
• Gender Inequality: Women were disproportionately impacted, facing increased domestic violence and exacerbated inequalities. The unemployment rate for women rose from an already high 15% before the pandemic to 18%. Additionally, data from the Centre for Monitoring Indian Economy (CMIE) showed a low labor force participation rate among women, at just 11%.
• Unemployment: CMIE data estimated that approximately 140 million people lost their jobs in India. According to the International Labour Organization (ILO), over 400 million people were at risk of falling into poverty, relying on informal work.
• Migrant Crisis: India's large informal, predominantly migrant workforce was hit hardest, accounting for 75% of the 122 million jobs lost. This left many without food, income, or shelter.
In order to combat the worst effects of Covid-19, the government has launched PM Garib Kalyan Anna Yojana and Atma-Nirbhar Bharat Abhiyan. However, undoing the impacts of Covid-19 will certainly not be a short-term process. Need is to expand rural employment generation
programmes like MGNREGA and extend the Public Distribution System provisions to ensure livelihood security, income security and food security.
Russia-Ukraine War
The World Bank's 2022 report provides the first comprehensive analysis of the combined effects of the COVID-19 pandemic and the ongoing Russian invasion of Ukraine on global poverty. This assessment comes after a period of five consecutive years, before the pandemic, when the global rate of poverty reduction had already been slowing.
The war has exacerbated the situation by driving up energy and food prices, further compounding the struggles of the poor. While the world is slowly recovering from the pandemic, the war is expected to push 685 million people below the extreme poverty line by the end of 2022.
The poor have become even poorer, hindering the post- pandemic recovery, especially when the war struck. Rising food and energy costs, combined with the impacts of the climate crisis—such as extreme weather events disrupting agriculture and disasters destroying assets and incomes—have not only made recovery impossible but have also trapped the poor in chronic poverty.
As a result, this crisis has caused the largest setback in the global fight against poverty since World War II. The report states, "These setbacks have significantly altered the trajectory of poverty reduction in profound and lasting ways, pushing the world even further off course from the goal of eradicating extreme poverty by 2030."
Way Forward
There are two critical issues in the discourse on poverty in India that relates to
• Poverty measurement
• Effective poverty elimination
Gradually, priorities have shifted with development in India. Today, the poor seeks betterment in living standards- sanitation, housing, piped water, electricity, education, health and consumption, skills and jobs, and not merely minimum food and shelter to keep THE body and soul together.
The current COVID-19 pandemic has also underscored the criticality of these ‘essentials’ and the need for living spaces where social distancing can be practiced.
Over time, India will need to adjust to the new reality of the transition to a middle- income country, in which poverty is not living at the edge of hunger but, rather, lack of income to take advantage of the opportunities thrown up by a growing economy.
Evidence shows that India is successfully addressing multidimensional poverty and at global level also, India’s success is critical for the realization of the ambitious sustainable development goals (SDGs) that aim to leave no one behind.
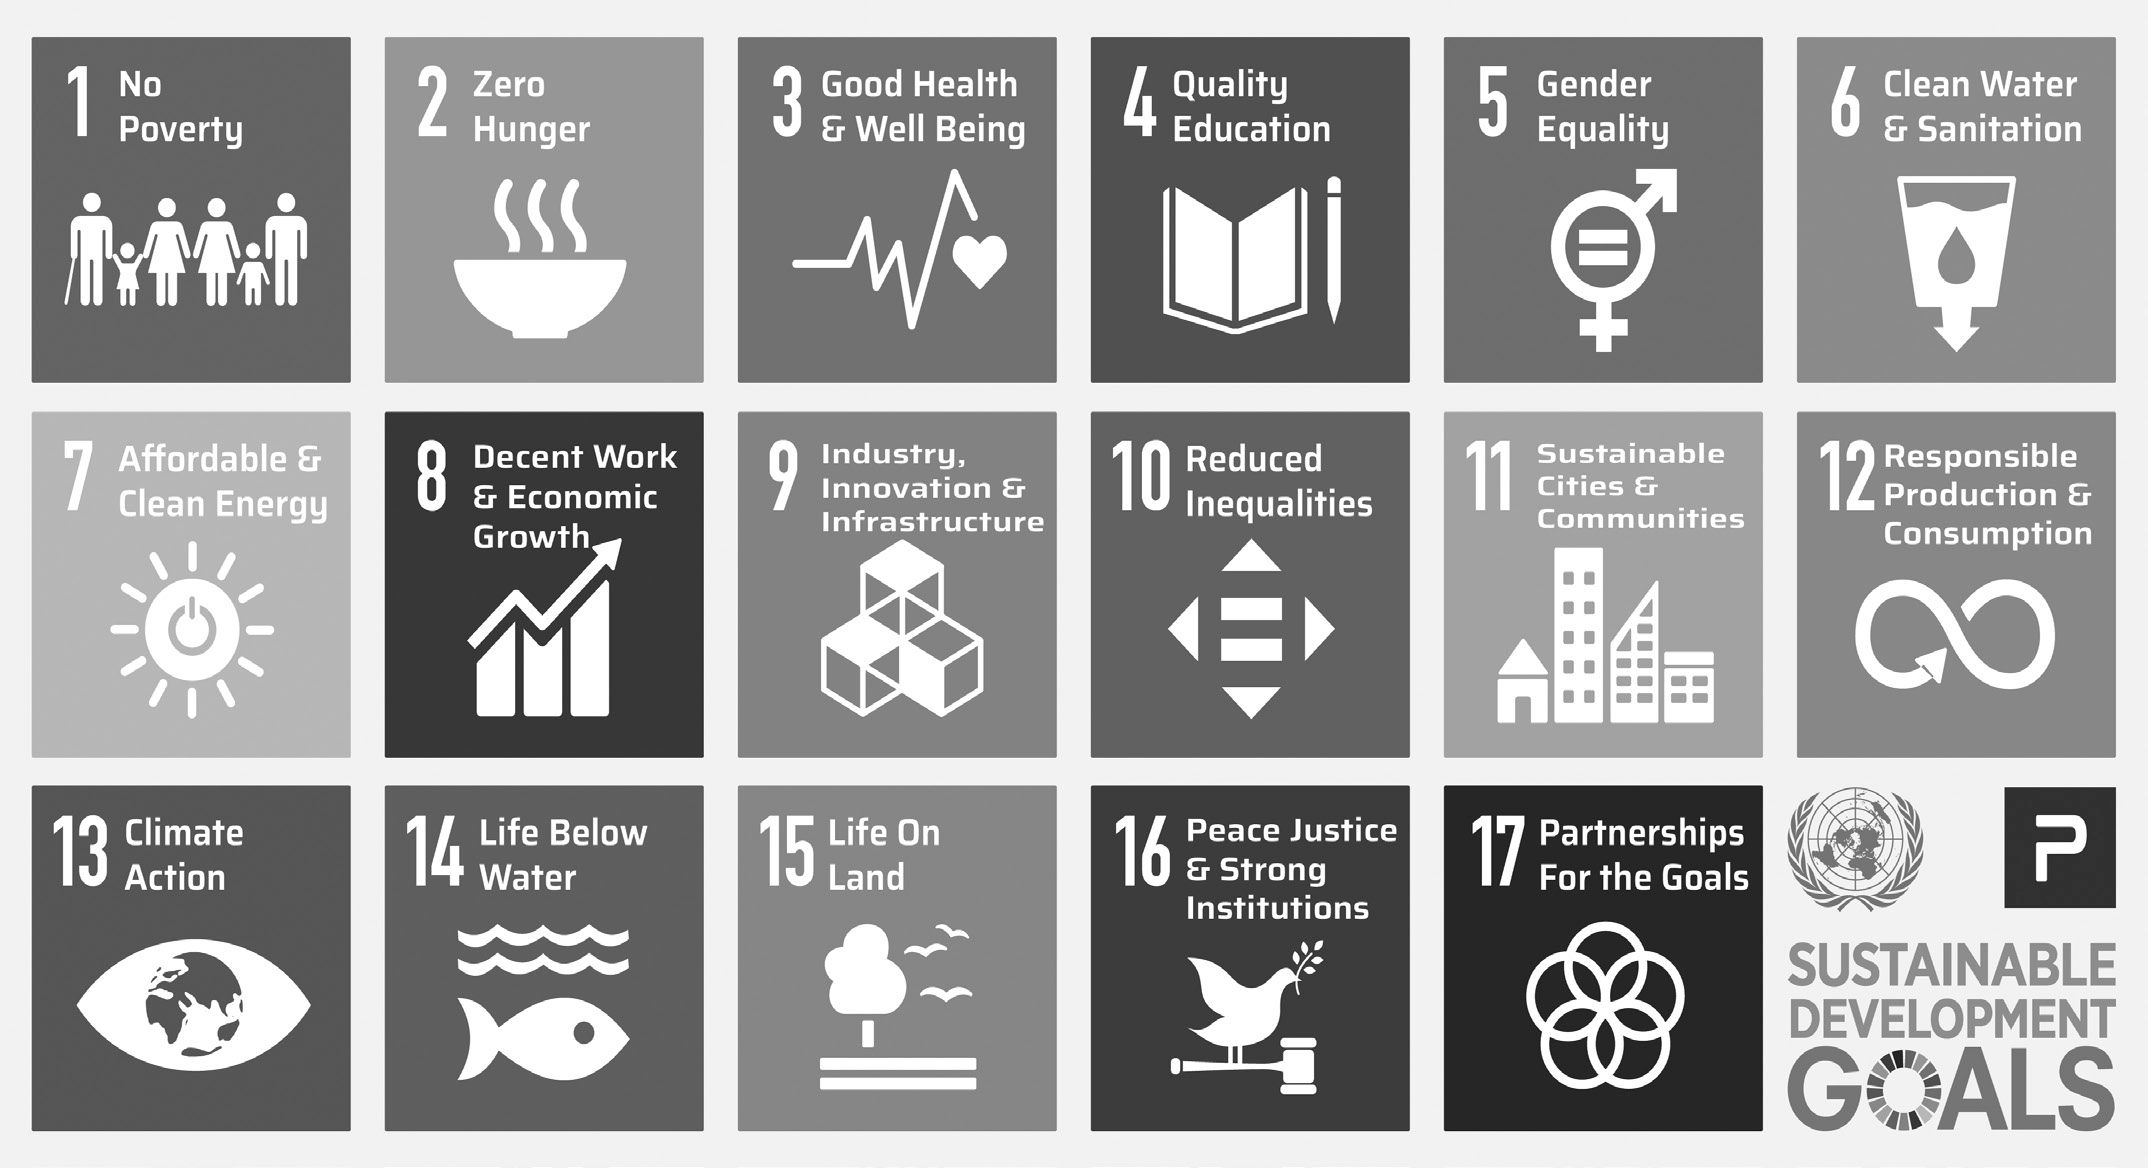
Conclusion
According to World Bank, India is no longer largely chronically poor; it is now more unequal and vulnerable with pockets of deep poverty. Its future shared prosperity will depend to a large extent on how its social protection system evolves and catches up with its diversity and demography. For individual poverty is a nightmare, for family it is a trap, while for nation, poverty is a curse'. Therefore, it should be the priority of the policymakers to end all forms of poverty and deprivation from India. Although a lot has been achieved; much remains to be done.