Editorial 1 : Good news in single digits
Context
Poverty fell significantly last year. Much of it was driven by GDP growth.
The Survey data
- The Household Consumption Expenditure Surveys by the National Statistics Office (NSO) for 2022-23 and 2023-24 help estimate recent poverty and inequality trends.
- Using the Rangarajan Committee's poverty line, monthly per capita spending needed to stay above poverty in rural areas rose from Rs 972 in 2011-12 to Rs 1,940 in 2023-24, and in urban areas from Rs 1,407 to Rs 2,736 over the same period.
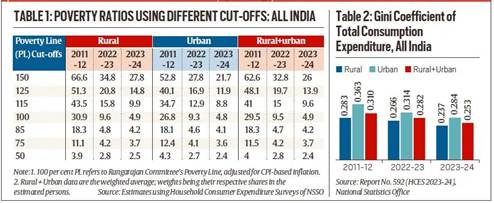
- The overall poverty rate (rural and urban combined) dropped sharply from 29.5% in 2011-12 to 9.5% in 2022-23 and further to 4.9% in 2023-24.
- While poverty has steadily decreased at about 2.05 percentage points per year since 2011-12, this is slightly slower than the 2.2 percentage point annual drop seen from 2004-05 to 2011-12.
Data from World Bank
- The World Bank recently released a Poverty & Equity Brief for over 100 developing countries.
- It says India has significantly reduced poverty over the past decade.
- Extreme poverty (living on less than $2.15 per day in purchasing power parity terms) declined from 16.2 per cent in 2011-12 to 2.3 per cent in 2022-23 — more than 170 million were lifted above conditions of extreme poverty in this period.
- The number of people below the poverty line criteria for lower-middle-income countries — $3.65 per day — fell from 61.8 per cent to 28.1 per cent.
Determination of poverty
- Poverty is determined by factors such as GDP growth, prices and safety nets.
- GDP growth increased from 7.6 per cent in 2022-23 to 9.2 per cent in 2023-24 — an increase of 1.6 percentage points in one year.
- The consumer price index (CPI) declined from 6.7 per cent in 2022-23 to 5.4 per cent in 2023-24 — a decline of 1.3 percentage points.
- However, food inflation increased from 6.6 per cent to 7.5 per cent during the same period.
- There does not seem to be significant changes in welfare programmes that make up the safety next.
- It appears, therefore, that GDP growth could be a proximate reason for the decline in poverty in 2023-24 as compared to that of 2022-23.
Trends in Poverty Depth and Inequality Reduction
- The depth of poverty in India between 2011-12 and 2023-24 can be better understood by looking at how poverty ratios change with different poverty line cut-offs.
- The main questions are whether poverty is falling as fast when the poverty line is raised, and how far below the line the poor actually are.
- Between 2011-12 and 2023-24, the overall poverty ratio (rural and urban) dropped by 24.6 percentage points.
- Though the headcount ratio is often criticized for not showing how poor people are, data reveals that over half of the poor lie just below the poverty line — between 75% and 100% of it. In 2022-23, 56% of rural and total poor were in this group, while many non-poor were just above the line (115% to 125%).
- Inequality in consumption also decreased during this period.
- The Gini coefficient, which measures inequality, dropped from 0.310 in 2011-12 to 0.282 in 2022-23, with a bigger drop in urban areas.
Conclusion
To conclude, there has been a significant decline in poverty. The poverty ratio is now in single digits. The overall inequality in consumption expenditure has come down a bit. The analysis shows that most of the poor are concentrated around the poverty line — this makes poverty more manageable.