Types of Goods
Types of Goods
Final Good
• When something is referred to be a final good since it is intended for final use and won’t go through any further production stages or changes. It is referred to as a final good since, upon sale, it is removed from the current economic flow. It will not be changed in any way by a producer going forward. That could, however, change depending on what the final buyer does.
• In fact, many such final goods are transformed during their consumption. As a result, the buyer does not drink the tea leaves they purchased; instead, they are utilized to manufacture drinkable tea that is then drunk.
• Similarly, most of the items that enter our kitchen are transformed through the process of cooking. But cooking at home is not an economic activity, even though the product involved undergoes transformation. Home cooked food is not sold to the market. On the other hand, the same materials, like tea leaves, would no longer be considered finished commodities and would instead be considered inputs to which economic value addition can occur if the same cooking or tea brewing was done in a restaurant where the cooked product would be sold to patrons. Therefore, a good becomes a final good due to the economic character of its usage rather than the nature of the item itself.
• We are able to differentiate between capital goods and consumer products among the final items.
• Goods like food and clothing, and services like recreation that are consumed when purchased by their ultimate consumers are called consumption goods or consumer goods. (This also includes services which are consumed but for convenience we may refer to them as consumer goods.)
Capital Goods
• There are other durable goods that are employed in the manufacturing process. These are machineries, tools, and implements. They do not change during the production process, even if they enable the manufacture of other goods. Even though they are final products, they are not goods that should be eaten in the end.
• These products are a component of capital, one of the essential production variables that a profitable business has invested in, and they keep the production process going for endless cycles of production.
• These are capital goods and they gradually undergo wear and tear, and thus are repaired or gradually replaced over time.
Consumer durables
• Even though they are for final consumption, some commodities, like television sets, cars, or home computers, have a quality with capital goods: they are also durable.
• In other words, they have a longer shelf life than items like food or clothing and are not destroyed by sudden or even brief consumption.
• They require periodic maintenance and renewal, just like machines, and of time, they too experience wear and tear and require repairs and part replacements. We refer to these products as consumer durables because of this.
Intermediate Goods
• A sizable portion of the economy’s overall production is made up of goods that are neither capital goods nor intended for final consumption. Other producers may use these commodities as raw materials.
• Copper is used to make utensils, and steel sheets are used to make cars. These are intermediary items, mostly utilised as inputs or raw materials in the manufacturing of other commodities. These aren’t the finished products.
Normal and Inferior Goods
• Goods: By goods we mean physical, tangible objects used to satisfy people’s wants and needs. The term ‘goods’ should be contrasted with the term ‘services’, which captures the intangible satisfaction of wants and needs. We can conceive of the work that teachers and doctors undertake for us as examples of services, as opp
• Normal Goods: Depending on the nature of the commodity, the quantity that a consumer needs may rise or fall in response to an increase in income. Regarding the majority of goods, a consumer’s choice of quantity rises with rising income and falls with falling income. These products are known as typical items.
• Inferior Goods: Certain items see demand that is inversely correlated with consumer income.
• We refer to these products as inferior goods. The demand for substandard goods declines with rising consumer income and increases with falling consumer income.
• For instance: foods such as jowar flour, wheat flour and coarse grains substitutes for one another.
• Goods which are consumed together are called complementary goods.
• Examples of goods which are complement to each other include tea and sugar, shoes and socks, pen and ink, etc.
• Because tea and sugar are used in tandem, a rise in sugar prices is likely to reduce the demand for tea, while a fall in sugar prices is likely to raise it.
• In general, the demand for a good move in the opposite direction of the price of its complementary goods.
• Goods like tea and coffee are not eaten together, in contrast to complements. They actually serve as each other’s replacements.
• Due to the fact that tea can be used in place of coffee, its use is expected to grow if the price of coffee increases. On the other hand, tea usage is probably going to decline if coffee prices drop.
• The demand for a good usually moves in the direction of the price of its substitutes
Giffen goods
• Sometimes, a consumer’s increased purchasing power (money) leads them to consume less goods overall.
• In such a case, the substitution effect and the income effect will work in opposite directions.
• Depending on the relative strength of these two opposing effects, the price of an item might have a positive or negative relationship with its demand.
• The relationship between the price and demand of an item would remain inverse if the substitution effect outweighs the income effect.
• On the other hand, if the income effect outweighs the replacement effect, the price of the good will positively correlate with demand. We refer to such a good as a Giffen good.
Giffen good is an inferior good for which demand increases as the price of the good rises, contradicting the law of demand. Giffen goods are named after the Scottish economist Sir Robert Giffen, who suggested their existence
PRODUCTION AND COSTS
Production
• The process that turns inputs into “output” is called production. Producers or firms are in charge of production. A firm acquires different inputs like labour, machines, land, raw materials etc. It uses these inputs to produce output.
• Consumers may use this output or it may be utilised by other businesses to produce more.
• An organisation must pay for the inputs it purchases. We refer to this as the production cost. After production is complete, the company sells the product to make money. The profit of the company is the amount that separates income from costs.
Factors of Production
Factors of production is an economic concept that refers to the inputs needed to produce goods and services. The factors are land, labour, capital, and entrepreneurship. The four factors consist of resources required to create a good or service, which is measured by a country’s gross domestic product (GDP).
• Land as a Factor of Production
All natural resources that are found on land, such as wood, water, flora, gold, and oil, are collectively referred to as land. One can categorise natural resources into two groups: non-renewable and renewable.
• Labour as a Factor of Production
Labour as a factor of production refers to the effort that individuals exert when they produce a good or service. For example, an artist producing a painting or an author writing a book. Labour itself includes all types of Labour performed for an economic reward, such as mental and physical exertion. The value of Labour also depends on human capital, which is determined by the individual’s skills, training, education, and productivity.
• Capital as a Factor of Production
Capital, or capital goods, as a factor of production, refers to the money that is used to purchase items that are used to produce goods and services. For example, a company that purchases a factory to produce goods or a Factors of Production
Factors of production is an economic concept that refers to the inputs needed to produce goods and services. The factors are land, labour, capital, and entrepreneurship. The four factors consist of resources required to create a good or service, which is measured by a country’s gross domestic product (GDP).
• Land as a Factor of Production
All natural resources that are found on land, such as wood, water, flora, gold, and oil, are collectively referred to as land. One can categorise natural resources into two groups: non-renewable and renewable.
• Labour as a Factor of Production
Labour as a factor of production refers to the effort that individuals exert when they produce a good or service. For example, an artist producing a painting or an author writing a book. Labour itself includes all types of Labour performed for an economic reward, such as mental and physical exertion. The value of Labour also depends on human capital, which is determined by the individual’s skills, training, education, and productivity.
• Capital as a Factor of Production
Capital, or capital goods, as a factor of production, refers to the money that is used to purchase items that are used to produce goods and services. For example, a company that purchases a factory to produce goods or a Factors of Production
Factors of production is an economic concept that refers to the inputs needed to produce goods and services. The factors are land, labour, capital, and entrepreneurship. The four factors consist of resources required to create a good or service, which is measured by a country’s gross domestic product (GDP).
• Land as a Factor of Production
All natural resources that are found on land, such as wood, water, flora, gold, and oil, are collectively referred to as land. One can categorise natural resources into two groups: non-renewable and renewable.
Labour as a Factor of Production
• capital – cannot be varied, and therefore, remains fixed. The company can only change the other factor in order to change the output level. The variable factor is the one that the company may change, whereas the fixed element is the one that stays constant.
• All production factors are modifiable over an extended period. A company may change both inputs at the same time to generate varying output levels over time. Therefore, there isn’t a fixed factor in the long run.
• By determining whether or not all of the inputs are variable, we may determine whether a period is long run or short run.
Total Product, Average Product and Marginal Product
• Total Product: It refers to the total quantity or amount of output produced by a given level of input, such as labour. It represents the cumulative production resulting from the combination of inputs. The relationship between the variable input and output, keeping all other inputs constant, is often referred to as Total Product (TP) of the variable input.
• Average product: Average product is the total product divided by the quantity of input used. It represents the average output per unit of input. Average product provides an indication of the productivity of each unit of input.
• Marginal product: It is defined as the change in output per unit of change in the input when all other inputs are held constant. It represents the additional output gained by adding an extra unit of input.
Laws of Returns to Scale
“The term returns to scale refers to the changes in output as all factors change by the same proportion.” Returns to scale are of the following three types:
Increasing Returns to scale - It describes a condition in which all of the factors of production are raised, resulting in a higher rate of output. For example, if inputs are raised by 10%, the output will be increased by 20%.
Reasons
Due to the economy of scale
Specialisation through better division of labour
Constant Returns to Scale - It describes a condition in which all of the factors of production are increased at the same time, resulting in a steady growth in output. For example, if inputs are raised by 10%, the output is also increased by 10%.
Reasons:
• As the firm’s production grows, it reaches a point where all of the economy’s resources have been fully utilised, and output equals input.
Diminishing Returns to Scale - When all of the production factors are increased simultaneously, output grows at a slower rate. For example, if inputs are raised by 10%, the output will be increased by 5%.
Reasons:
• The major cause of diminishing returns to scale is large-scale economies, diseconomies of scale occur when a company has grown to such a size that it is difficult to manage.
• Lack of coordination
.
Difference Between Economics and Economy
Economics
The theory of economics is a method rather than a doctrine, an apparatus of mind, a technique of thinking, which helps its possessor to draw correct conclusions.
- John Maynard Keynes
Economics is the science which studies human behaviour as a relationship between ends and scarce means which have alternative uses.
- Lionel Robbins
At present India is the world's sixth-largest economy by nominal GDP with ($3.9) trillion to ($4.2) trillion and the third- largest by Purchasing Power Parity (PPP). It is estimated to become the third largest economy of the world in term of GDP with $7.3 trillion by By 2030. To achieve this goal some schemes and reforms such as Next-generation GST and PM Viksit Bharat Rozgar Yojana has been initiated. In this regard more than 17 crore jobs generated in the last ten years.
Economics is the study of scarcity and how it affects the use of resources, the production of goods and services, the growth of production and well-being over time, and many other important and complicated issues that affect society. It is the study of how things are made, moved around, and used. It looks at how people, businesses, governments and countries choose to use their resources.
Traditionally, the subject matter of economics has been studied under two broad branches:
• Microeconomics
• Macroeconomics
Microeconomics
• The study of how people, households and businesses make decisions and allocate resources is known as microeconomics.
• Microeconomics, in its examination of the behaviour of individual consumers and firms, is divided into consumer demand theory, production theory (also called the theory of the firm) and related topics such as the nature of market competition, economic welfare, the role of imperfect information in economic outcomes and at the most abstract, general equilibrium, which deals simultaneously with many markets
• It concerns such issues as the effects of minimum wages, taxes, price supports, or monopoly on individual markets and is filled with concepts that are recognizable in the real world.
• It has applications in trade, industrial organization and market structure, labour economics, public finance and welfare economics.
Microeconomic analysis offers insights into such disparate efforts as making business decisions or formulating public policies.
Macroeconomics
The area of economics known as macroeconomics focuses on the conduct and overall performance of an economy. It focuses on the overall shifts in the economy, including inflation, growth rate, unemployment and gross domestic product.
Macroeconomics analzses all aggregate indicators and the microeconomic factors that influence the economy. Governments and corporations use macroeconomic models to help in formulating economic policies and strategies.
In macroeconomics, the subject is typically a nation how all markets interact to generate big phenomena that economists call aggregate variables.
The government is a major object of analysis in macroeconomics for example, studying the role it plays in contributing to overall economic growth or fighting inflation.
Macroeconomics often extends to the international sphere because domestic markets are linked to foreign markets through trade, investment, and capital flows.
Macroeconomics describes relationships among aggregates so big as to be hard to apprehend such as national income, savings and the overall price level.
The field is conventionally divided into the study of national economic growth in the long run, the analysis of short-run departures from equilibrium and the formulation of policies to stabilize the national economy that is, to minimize fluctuations in growth and prices. Those policies can include spending and taxing actions by the government or monetary policy actions by the central bank.
| Difference | Microeconomics | Macroeconomics |
| Meaning | Microeconomics is a branch of economics concerned with the study of individual, household and corporate behaviour in decision making and resource allocation. It tackles economic issues and encompasses markets for products and services. | The area of economics known as macroeconomics focuses on the conduct and performance of the economy as a whole. Among the most important variables studied in macroeconomics are growth rate, GDP, unemployment and inflation. |
| Study Area | It studies the particular market segment or the individual economic units of the economy. It covers a wide range of topics, such as supply and demand, product and factor pricing, economic welfare, production and consumption. | It studies the whole economy, which covers several market segments. It deals with various issues like national income, distribution, employment, general price level, money etc. |
| Significance | It is useful in regulating the prices of a product alongside the prices of factors of production (labour, land, entrepreneur, capital, etc.) within the economy. It helps in business decision-making, production planning, etc. | It helps to evaluate the resources and capabilities of an economy, churn out ways to increase the national income, boost productivity, and create job opportunities to upscale an economy and solve the major issues of the economy like deflation, inflation, unemployment, and poverty as a whole. |
Positive and Normative Economics
Positive economics addresses the issue of a theory having validated data and facts that must be considered prior to the theory’s development. Take the Law of Demand, for instance, a hypothesis based on established facts.
The foundation of normative economics is values judgement, which promotes social welfare and is better for the country’s economic future. Consider the idea that the economy’s income should be allocated fairly.
WHAT IS THE ECONOMY?
An economy is a system of interrelated production and consumption activities that ultimately determine the allocation of resources within a group. The production and consumption of goods and services as a whole fulfil the needs of those living and operating within it.
In simple words, an economy is a system for deciding how scarce resources are used so that goods and services can be produced and consumed. Resources are things like land, people (who can work or innovate through their ideas), and raw materials. They are seen as scarce because we have unlimited wants but there are not enough resources to produce the goods and services to satisfy these wants.
Problem of Allocation of Resources
Just as an individual’s resources are limited, so are the community’s resources when compared to what the members of the society may desire in unison.
Since Resources are scarce and Demands are unlimited
there is a Problem of Allocation of Resources.
The society’s limited resources must be distributed wisely among its members to produce a variety of goods and services that suit their preferences.
Any allocation of resources of the society would result in the production of a particular combination of different goods and services. The goods and services thus produced will have to be distributed among the individuals of the society. Two of the fundamental economic issues that society faces are the distribution of the final mix of commodities and services and the allocation of scarce resources.
Central Problems of an Economy
The three main economic activities in life are the production, exchange and consumption of products and services. Every community has to deal with these fundamental economic issues including:
Scarcity of resources
Problem of choice
An economy’s issues are frequently summed up as follows:
What is to be produced and in what quantities?
Every society has to choose how much of each of the countless products and services it can manufacture.
How are these goods produced?
Every civilization must choose which resources to employ in what proportion to produce the various commodities and services.
For whom are these goods produced?
Dividing the created products and services among the persons within the economy and allocating limited resources to the creation of various conceivable commodities and services are problems that every economy must deal with.
Production Possibility Frontier
A certain mix of various goods and services is produced by the economy’s allocation of its limited resources. With the available resources, various combinations of all potential goods and services can be achieved by allocating the resources in a variety of ways. The production possibility set of the economy is the set of all potential combinations of commodities and services that can be created from a given stock of technological knowledge and a given quantity of resources.
Opportunity Cost
Opportunity Cost
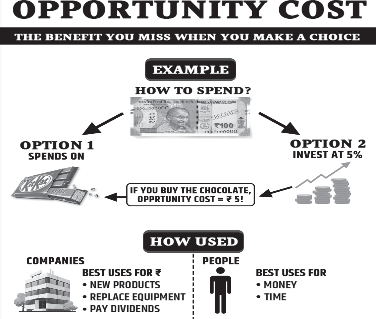
The price paid for selecting one course of action over another and losing out on the possibility to profit, whether through investing or not, is known as the opportunity cost. An opportunity cost is a gain that someone may have had but skipped in order to pursue a different course of action. Opportunity cost is also called the economic cost. For example, if we want to have more of one of the goods, we will have less of the other good. This is known as the opportunity cost of an additional unit of the goods.
The opportunity cost is transferred from the product’s users to the tax-paying public when a good is given away for free by the government. Microeconomic theory states that common resources like fish and grazing land, as well as free goods like air, have no opportunity cost. The opportunity cost applies to public goods like defence and street lights (the government might have used that money on street lights instead of the military). Thus, opportunity cost is not equal to zero.
Indifference Curve
Indifference Curve
An indifference curve is a graphical representation used in microeconomics to depict the various combinations of two goods or services that provide equal levels of satisfaction or utility to a consumer. It shows all the possible combinations of goods among which the consumer is indifferent or has no preference.
A curve joining all points representing bundles among which the consumer is indifferent is called an indifference curve. Every point on an indifference curve, such as A, B, C and D, offers the same degree of satisfaction to the customer.
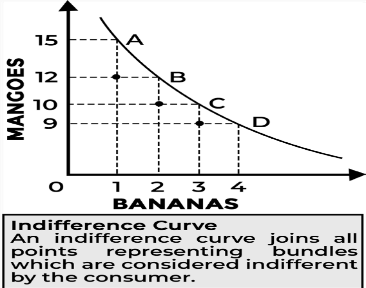
The marginal rate of substitution (MRS) is the quantity of mangoes a consumer must give up in order to obtain an extra banana while maintaining her total utility level.
Put otherwise, MRS represents the rate at which a customer will switch from mangoes to bananas while maintaining the same level of overall utility.
Features of Indifference Curve
The indifference curve slopes downwards from left to right.
A higher indifference curve gives a greater level of utility.
Two indifference curves never intersect each other.
Engel curve
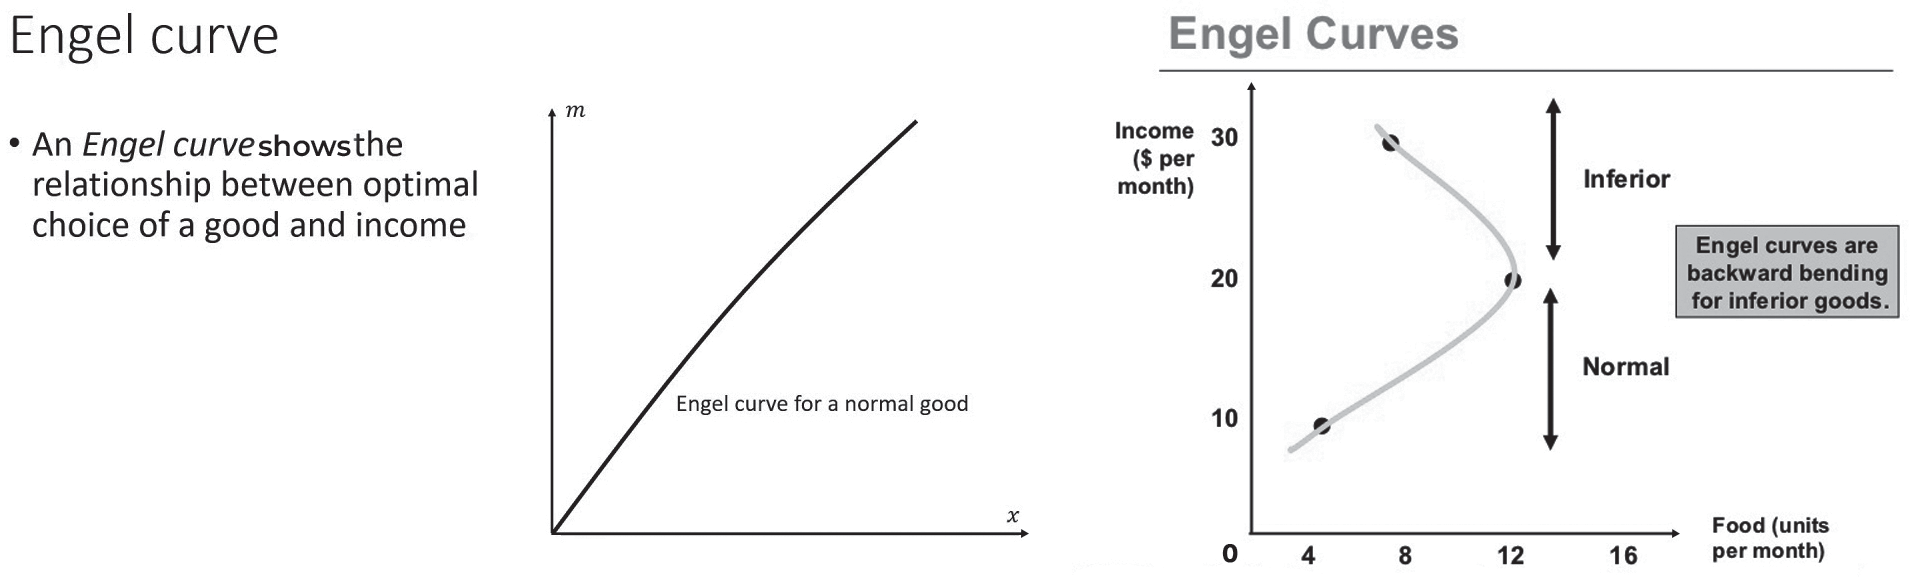
The Engel curve illustrates the relationship between household income and expenditure on a certain good. Along with other consumer attributes, demographic factors like age, gender and educational attainment can affect the shape of an Engel curve.
Additionally, the Engel curve varies according to the kind of items. With income level as the x-axis and expenditures as the y-axis, the Engel curves show upward slopes for normal goods, which have a positive income elasticity of demand. Inferior goods, with negative income elasticity, assume negative slopes for their Engel curves. In the case of food, the Engel curve is concave downward with a positive but decreasing slope.
Kuznets curve
The Kuznets curve is an economic concept that explains the relationship between economic development and income inequality. It proposes that when a nation moves from an agrarian to an industrial economy in its early stages of growth, income disparity rises. Income disparity reduces while economic growth continues. A common representation of the Kuznets Curve is an inverted U, where income inequality rises in the early phases of development and then falls after a certain degree of economic success is attained. The question of whether this pattern is always true remains unresolved, as some scholars have proposed that the relationship between economic progress and income disparity may be influenced by other variables, such as governmental regulations.
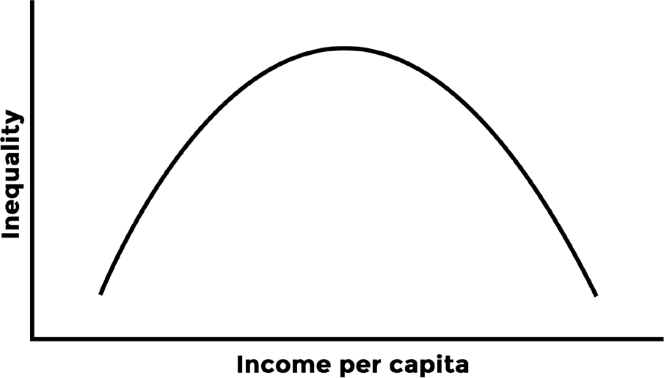
The Kuznets curve hypothesis suggests that economic development is linked to a specific pattern of income inequality over time. It implies that when a nation experiences economic growth, income disparity first rises before peaking and declining as the nation grows wealthier.
Economic Systems
ECONOMIC SYSTEMS
An economy is an organisation through which citizens make their livelihood. To deal with its internal problems, every economy has certain norms and rules of conduct called institutions. Resources, industries, kin, money, etc. are examples of economic institutions. The economic system is a pattern of cooperation among associates of an economy with its specific institutions. It comprises the institutions that direct an economy.
Features of an Economic System
• Orderly institutional arrangement
• Man-made phenomenon
• Evolutionary, dynamic and flexible
TYPES OF ECONOMIC SYSTEMS
Capitalism
• In this type of economic System, the ownership of means of production lies in the hands of private individuals and institutions.
• It is wholly market-based and profit is the guiding principle of all economic activities, regulated by the forces of demand and supply – that whatever is in demand will be produced since it yields high profits.
• The consumer is the supreme factor around whose choices the goods and services are based. It is also called a ‘Free Market Economy’ since all citizens have the legal freedom to opt for any occupation or agreement.
Features
• Price mechanism: In the absence of external interference, the prices in a capitalist economy are determined in accordance with the movement patterns of demand and supply. The production decisions of quality, quantity and place of produce are decided in tune with the price mechanism.
• Freedom of enterprise: The citizens are free to choose the occupation or profession based on their capability and liking. They can use their means of production as per their preferences.
• Competition: The number of competitors is high because of the presence of market economy and price mechanism. Moreover, individuals can choose ways of using their means of production with no restrictions on the profit motive.
• Profit orientation: All the economic activities are profit- driven.
• Sovereignty of the consumer: The ‘Customer is king’ principle prevails in a capitalist economy. Since the consumer, through his choices, decides on the demand and supply in the market, his satisfaction is given the utmost care.
• Labour as a commodity: Labour is available in the market for a price called wages from people with inadequate means of production who are unable to utilize their own labour.
• No government interference: The role of the government is to protect its citizens from foreign invasion, and acts of terrorism and ensure law and order in the state. It does not interfere with the economic activities
Merits
• Economic freedom
• Equal right to work
• Right to accrue wealth
• Rich choice of goods and services
• Encouragement to success and hard work
• Consumer as prime focus
• Quality production
Demerits of Capitalism
• Disproportionate sharing of wealth
• Neglect of public welfare
• Risk of cyclical fluctuations
• Ruthless competition
• Discord between the haves and have-nots.
• Consumer sovereignty becomes a myth as most of the consumption choices are directed by advertisement and sales propaganda.
Socialism
Presently, there is no nation in the world that can be termed a truly socialist economy. After the great fall of the Soviet Union that claimed itself to be the antithesis of capitalist America, doubts about a socialist economy have abounded. Even China has started adopting such economic measures that cannot be categorized as a socialist economy.
Nevertheless, in socialism, the economic system is administered and regulated by the government. The objective is to secure the welfare and equality of the society.
Main Features
• Social or collective ownership: All means of production are socially owned and utilized by the government. No individual ownership in any form is encouraged. However, an individual can hold private property as is necessary for his subsistence.
• Central planning authority: Based on a survey of available resources (human and physical), a central planning authority established by the government decides on economic issues. Accordingly, an exhaustive plan is made in pursuit of the pre-determined goals. The planning authority prepares plans for the economy as a whole.
• Government control: It is present in all economic activities and also in central planning. Plans of the central planning authority are carried out only with the approval of the government.
Merits of Socialism
• Optimum usage of economic resources
• Better way out to basic problems
• Lesser cyclical fluctuations
• Rapid and balanced economic development
• Equitable distribution of income
• Better equipped to face economic crisis
Demerits
• No proper basis of cost calculation
• Curtain of concealment
Mixed Economic System
In India, after independence, while making the choice of an economic system, the Jawaharlal Nehru-led nation decided to blend capitalism and socialism. Known as ‘mixed economy’ and rightly so, it aims to include the best of the other two systems. It is characterized by the joint operation of the private and public sectors and the allocation of economic resources is done accordingly.
Main Features
Partnership of the private and public sectors: The public sector strives for the betterment of the interests of the common man, works towards a more equitable distribution of income and promotes its ideals of a welfare state. The private sector too is given a specific responsibility.
• Planned economy and government control: Focusing on economic development, periodical plans for the nation are made by the Government to be adhered by both sectors. To reach the set destination and uphold social welfare, the private sector is regulated and controlled by the government.
• Private property and economic equality: Having permitted the right to private property, the government through a well-planned mix of laws, taxes and welfare programmes ensures fair distribution of income and wealth.
Merits
• Economic freedom and capital formulation
• Competition and efficient production
• Efficient allocation of resources
• Advantages of planning
• Economic equality
• Freedom from exploitation
At present there are 7 socialist countries while 4 are communist countries in the world.
Demerits
• Unstable economy: The current trend in India shows a strong shift to a capitalist economy. Some decades ago, the focus was socialist economy. Based on the strength at a given time, one sector dominates the other thereby tilting towards one economic system. This may destabilize the mixed economy in the long run.
• Constrained growth: Just as riding on two horses, in a mixed economy neither the private sector is allowed to operate freely nor does the public sector function to its optimum efficiency. This prevents desired growth in both sectors.
Sectors of Economy
A nation’s or economy’s economic activity can be broadly classified into three primary sectors and economies are named for their predominance in these sectors.
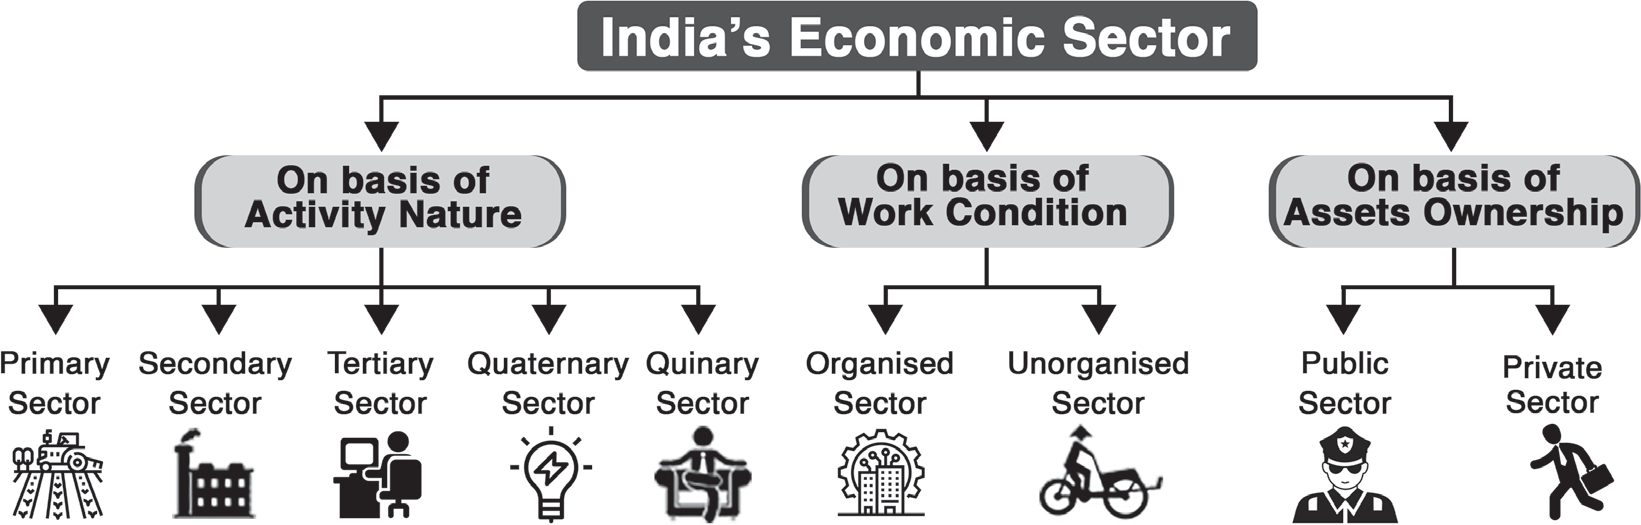
Primary Sector
The economic activities that take place while exploiting the natural resources fall under it, such as mining, agricultural activities, oil exploration, etc. When the agriculture sector (one of the sub-sectors of the primary sector) contributes a minimum of half of the national income and livelihood in a country it is called an agrarian economy.
Secondary Sector
It contains all of the economic activities under which the raw materials extracted from the primary sector are processed (also called the industrial sector). One of its sub-sectors, manufacturing, has proved to be the largest employer across the western developed economies. An economy is considered industrial when the secondary sector accounts for at least half of the jobs and national income in that nation.
Tertiary Sector
This sector includes all economic endeavours that involve the production of services, including banking, healthcare, education and communication. An economy is considered to be in the service sector when it provides at least half of the livelihood and national income in that nation. Experts went on to construct the quinary and quaternary sectors of the economy. However, they belong to the tertiary sector as subsectors.
• Quaternary Sector: Often referred to as the “knowledge” sector, it encompasses many activities such as research and development, teaching and so forth. When determining the calibre of human resources available to an economy, the industry is the most significant factor.
• Quinary Sector: It encompasses all actions where important decisions are made. It includes the top ranking decision-makers in both the public and private corporate sectors, including their bureaucracies.
Organised Sector
• Employees in this industry have guaranteed job and social security and employment terms are regular and set.
• It can also be defined as an industry where the enterprises are subject to several statutes and are registered with the government. Hospitals and schools fall under the organised sector.
• The jobs of those employed in the organised sector are secure. They have a maximum amount of hours that they must work. The employer has to pay them overtime if they put in more hours.
Unorganised Sector
• An unorganized worker is a home-based worker, self- employed worker or wage worker in the unorganized sector as well as a worker in the organized sector who is not covered by any of the Acts pertaining to welfare Schemes listed in Schedule II of the Unorganized Workers Social Security Act, 2008.
• Due to the informal and seasonal nature of work and the dispersed placement of firms, wage-paid labour in this sector is typically non-unionized.
• Low wages, insecure and irregular work and a lack of protection from legislation or trade unions characterize the industry.
• The unorganized industry relies heavily on labor and indigenous technologies. Workers in the unorganized sector are so dispersed that the legislation’s execution is severely inadequate and ineffectual. There are few unions in this industry to act as watchdogs.
• However, the unorganized sector’s contribution to national income is far more than that of the organized sector. It the informal sector contributed about 45% to the total GDP of the economy in FY 2022-23 whereas the organized sector contributes less than half, depending on the industry.
Public Sector
• The government controls the majority of the assets in the sector, and it is the segment of the economy associated with delivering different governmental services.
• The goal of the public sector is not only to make money. Governments collect funds through taxes and other means to cover the costs of the services they provide.
Private Sector
• In economics, the private sector is that part of the economy that is run by private individuals or groups, usually as a means of enterprise for profit and is not controlled by the state.
• By contrast, enterprises that are part of the state are part of the public sector and non-profit organizations are regarded as part of the voluntary sector.
• Private sector enterprises are characterized by ownership and management in the hands of private individuals and are guided by personal initiatives and profit motives.
PPP (Public Private Partnership)
• A public-private partnership (PPP) is an agreement between the public and the private sector for the provision of public assets and/or public services.
• The private corporation invests for a predetermined amount of time in this kind of collaboration.
• PPP does not equate to privatisation since the government is still in complete control of the services it provides.
• The distribution of risk between the public and private sectors is clearly established.
• The private firm is compensated based on performance and is selected through open competitive bidding.
• In developing nations when borrowing money for significant projects is hindered by numerous constraints, the public-private partnership (PPP) option presents an alternative.
• It can also provide the necessary knowledge for organising or carrying out significant initiatives
Indian Context
• India has a mixed economy in which both the private sector and public sector are allowed to operate.
• In 1948 industrial resolution divided the industries into three categories: i) Three industries in which the state was given an exclusive monopoly and ii) six industries, where the state had the exclusive right to set up new units but the existing private units were allowed to operate, iii) eighteen industries where regulations and direction are necessary and iv) all other industries not included in the above three categories, where the private sector was allowed the freedom to operate.
• The 1956 industrial policy divided all industries into three categories. i) seventeen industries (schedule A) whose future development was to be the exclusive responsibility of the state ii) twelve industries (schedule B) where the state would increasingly establish new units but the private sector would not be denied to set up their units. iii) all other industries (not listed in Schedule A or B) where the private sector was given full freedom to operate.
• The government of India has duly emphasized the mutual coexistence and mutual dependence and cooperation of the private and public sectors.
• The new industrial policy of 1991 abolished the licensing system and ushered in new era liberalization, where the role of the public sector was diluted.
• Doors of foreign investment considerably opened and numerous incentives and initiatives were granted to the private sector to expand its business activities.
The private sector plays the following dominant role in Indian economy
• It has an extensive modern industrial sector
• It has become the powerful driver of development
• It has led to the growth of small-scale industries
• It has huge employment and investment potential
• lt plays significant role in health and education sector
• Significance of Corporate Sector in India
• The phenomenal growth of the private sector of India can be attributed to political will, financial reforms, usage of more advanced technology, young and large English speaking working class. The 7-8 % annual GDP growth rate of India is one of the highest growth rates in the world. The last 15 years witnessed a phenomenal rise in the growth of the private sector in India. The opening up of the Indian economy has led to the free inflow of foreign direct investment (FDI) along with modern cutting-edge technology, which propelled India’s economic growth. The market changed as soon as the markets were opened for investments. This saw the rise of the Indian private companies which prioritized customer’s need and speedy service. Further, the government of India also divested some of its enterprises to ensure the smooth operation of these companies which otherwise were loss-making. It also went further and forged joint ventures with private Indian companies, especially in sectors like telecommunication, petroleum, housing, and infrastructure. This inculcated healthy competition and benefited the end consumers since the cost of services or products came down substantially.
Every domestic economy is divided into three sectors:
General government sector
Real sector
Financial sector
Real Sector: The real sector of the economy consists of enterprises (non-financial corporations), households and non-profit institutions serving households.
Financial Sector: The financial sector consists of corporations principally engaged in financial intermediation or in auxiliary financial activities that contribute to financial intermediation.
The Real Sector plays a crucial role in driving economic output and is made up of the industries essential for the growth of a country's GDP. The expansion of the real sector relies heavily on a strong and well-functioning financial system, which makes the development of the financial sector a key factor in supporting the growth of the real sector. The key indicators of the real sector include GDP data, employment rates, private investments, consumption patterns, and metrics such as wholesale and consumer price indices (inflation), along with production levels in agriculture and industry.While the nominal economy focuses on the financial aspects, the real sector is concerned with the production side of the economy. Activities within the real sector include processes like farmers harvesting their crops and textile manufacturers converting raw cotton into finished textiles.
Theory of Consumer Behaviour
THEORY OF CONSUMER BEHAVIOUR
The consumer has to decide how to spend his income on different goods. This is known as the choice issue by economists. Naturally, every customer wants to get a set of products that will satisfy him to the fullest.
What will be the best combination?
This is contingent upon the consumer’s preferences and purchasing power. Consumer “likes” are often referred to as “preferences.” Additionally, the consumer’s income and the costs of the goods determine what they can afford to buy.
Utility
Typically, a consumer bases his demand for a good or service on the utility or satisfaction that good or service provides.
• The utility of a commodity is its want-satisfying capacity. The utility obtained from a commodity increases with the degree of need for it or the intensity of desire for it.
• Utility is subjective. Different individuals can get
different levels of utility from the same commodity.
Measures of Utility
Total Utility: It refers to the total satisfaction or benefit that a consumer derives from consuming a certain quantity of a good or service. It represents the sum of the utility or satisfaction obtained from each unit of the good or service consumed.
Marginal Utility: The change in overall utility brought about by consuming one more unit of a commodity is known as marginal utility (MU). It measures the change in total utility resulting from a small change in the quantity consumed. Assume, for instance, that four bananas provide us with 28 units of total utility and five bananas provide us with 30 units. It is evident that using the fifth banana increased overall usefulness by two units (30 units minus 28 units). Consequently, the fifth banana has a marginal usefulness of two units
Law of Diminishing Marginal Utility
According to this, when a commodity’s use rises, its marginal utility decreases while the consumption of other commodities remains constant. In simpler terms, it means that the more you have of something, the less value or enjoyment you get from each additional unit.
Example: Suppose you’re eating ice cream on a hot day. The first scoop brings you immense pleasure and satisfaction. As you continue eating, each subsequent scoop provides less and less additional satisfaction. Eventually, you may even reach a point where you start to feel less enjoyment, and consuming more ice cream may become less desirable or even unpleasant.
Budget line
• In the language of economics, the budget is the sum of all the bundles of items that a customer can purchase at the going rates for her income.
• The budget line represents all bundles which cost the consumer her entire income.
The budget line is negatively sloping.
The budget set changes if either of the two prices or the income changes
#Note: The consumer has a limited income, that acts as a constraint to his/her maximizing behaviour, i.e. the budget constrains how much the consumers can consume. While budget line graphically represents the bundle of two goods which a consumer can buy with the given budget. As against, all the combinations in the positive quadrant, which lie on or below the budget line are called a budget set.
• Demand for a particular commodity, apart from the price of this commodity, depends on factors such as:
• Prices of other commodities
• Income of the consumer
• Tastes and preferences of the consumers
• Expectations
• Number of buyers
The relationships between product demand and price, subject to fluctuations in the economy keeping all other factors constant, are as follows, are as follows:
• If the cost of one of its alternatives increases, there will be a greater demand for the good. If the cost of one of its alternatives drops, there will be less of a demand for the good.
• If the price of an item’s complement drops, the demand for that good will rise. Take ice cream and fudge sauce, for instance
• When income rises, the desire for inferior goods declines. A normal good’s demand rises in response to income growth.
• A good’s demand will rise if its price decreases.
Demand curve
A demand curve is a visual representation of the varied amounts of a good or service that a buyer is willing to purchase at different prices, while maintaining the same prices of similar goods and the buyer’s income.
The downward-sloping demand curve indicates that the consumer is willing to purchase more commodity x at lower prices and less at higher prices.
As a result, the quantity desired and the price of a good have an inverse or negative connection that is known as the Law of Demand.
• The Law of Demand asserts that, barring unforeseen circumstances, there exists an inverse relationship between the demand and price of a given commodity. Put another way, as a commodity’s price rises, demand for it falls, and when it falls, demand for it rises, all other things being equal.
The two factors that are involved when a commodity’s price fluctuates the substitution effect and the income effect can also be used to explain the demand curve’s negative slope.
• When the price of good ‘x’ drops, consumers maximise their utility by switching to good ‘x’ for good ‘y’ to experience the same degree of satisfaction from the price adjustment. This leads to a rise in demand for good ‘x’.
• Moreover, as the price of good ‘x’ drops, consumer’s purchasing power increases, which further increases demand for bananas (and good ‘y’ ). This is the income effect of a price change, resulting in further increase in demand for bananas.
Demand function
• The amount of a good that the consumer optimally chooses depends only on its price if other goods’ pricing, the consumer’s income, and her tastes and preferences all stay the same.
• The demand function is the relationship that determines how much of an item a buyer chooses to purchase at an optimal price. As a result, while all other factors stay the same, the consumer’s demand function for a good indicates how much of the good they prefer at various price points.
• The consumer’s demand for a good as a function of its price can be written as X = f (P) where, X denotes the quantity and P denotes the price of the good.
Shifts in the Demand Curve
• A shift in the demand curve results from an increase in income because it affects the demand for a good at different prices, which is determined by the consumer’s preferences and the pricing of competing goods.
• For normal goods, the demand curve shifts rightward and for inferior goods, the demand curve shifts leftward.
• The demand for a good at each price point varies in response to changes in the price of a related good, given the consumer’s income and preferences. This causes a shift in the demand curve.
• If there is an increase in the price of a substitute good, the demand curve shifts rightward.
• On the other hand, if there is an increase in the price of a complementary good, the demand curve shifts leftward.
• The demand curve can also shift due to a change in the tastes and preferences of the consumer.
• If the consumer’s preferences change in favour of a good, the demand curve for such a good shifts rightward.
• On the other hand, the demand curve shifts leftward due to an unfavourable change in the preferences of the consumer.
• For example, the demand curve for ice cream is expected to move to the right throughout the summer as summertime tastes increase.
Revelation of the fact that cold-drinks might be injurious to health can adversely affect preferences for cold-drinks. This is likely to result in a leftward shift in the demand curve for cold-drinks
Elasticity of Demand
• Price elasticity of demand refers to how easily a good’s demand can adjust in response to changes in its price. The percentage change in a good’s demand divided by the percentage change in its price is known as the price elasticity of demand.
• Price-elasticity of demand for a good -
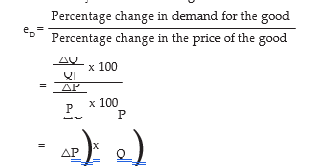
Where, P is the Initial price of the good, Q is the Initial quantity of the good, △P is the change in price and △Q is the change in quantity demanded.
• Elasticity can be described as:
Elastic or very responsive: Demand is considered to be very responsive to changes in market price when the percentage change in quantity demanded is greater than the percentage change in market price, and the estimated eD is greater than one (eD > 1). At that price, the good’s demand is considered elastic. For instance, the desire for upscale products
Inelastic or not very responsive: Demand for the good is considered to be inelastic at that price when eD is anticipated to be less than one (eD < 1) and the percentage change in quantity demanded is less than the percentage change in market price. For example, the demand for necessities
Unitary elastic demand is defined as follows: eD is believed to be equal to one (eD = 1), and the good is said to be unitary-elastic at that price when the percentage change in quantity demanded equals the percentage change in its market price.
SUPPLY
• The quantity that a company decides to sell at a specific price, considering technology and manufacturing factor costs, is its “supply.”
• Quantity supplied refers to a specific amount of commodity offered for sale at a particular price at a point of time.
• A company’s supply curve displays the output levels that the company choose to generate in relation to various market pricing, once more maintaining the same levels of technology and production factor prices.
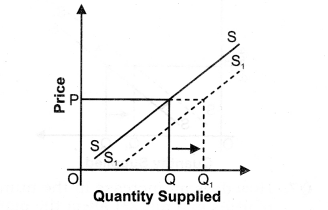
accordance with the law of supply, which stipulates that the amount provided of an item and its price are directly correlated. In other words, amount supplied rises with rising prices and falls with falling prices.
Law of Supply
• The law of supply asserts that, other things being equal, there is a direct and positive relationship between an item’s price and its amount supplied.
• As the price of a good rises, the suppliers will supply more of that good and as the price of a good falls, the suppliers will supply less of that good as the consumers are paying less for that good.
• E.g., If the price of rice is 10 then the quantity supplied is 100. So, when the price increases to 20, the quantity supplied becomes 200. Similarly, if the price decreases from Rs. 20 to Rs. 10, the quantity supplied decreases from 200 to 100.
The Theory of The Firm Under Perfect Competition
• Perfect Competition - A perfectly competitive market has the following defining features:
• The market consists of a large number of buyers and sellers. It means that each individual buyer and seller is very small compared to the size of the market. This means that no individual buyer or seller can influence the market by their size.
• Each firm produces and sells a homogenous product i.e., the product of one firm cannot be differentiated from the product of any other firm. It means that the product of each firm is identical. So, a buyer can choose to buy from any firm in the market, and she gets the same product.
• Entry into the market as well as exit from the market are free for firms. The existence of a large number of enterprises is contingent upon this requirement. There may be fewer businesses in the market if entry was challenging or prohibited.
• Information is perfect. It suggests that every seller and every buyer is fully aware of the product’s quality pricing and other pertinent information, as well as the state of the market.
Market Equilibrium
• The goals of consumers are to maximise their preferences, while the goals of businesses are to maximum their profits. In the equilibrium, the goals of the firms and customers are consistent.
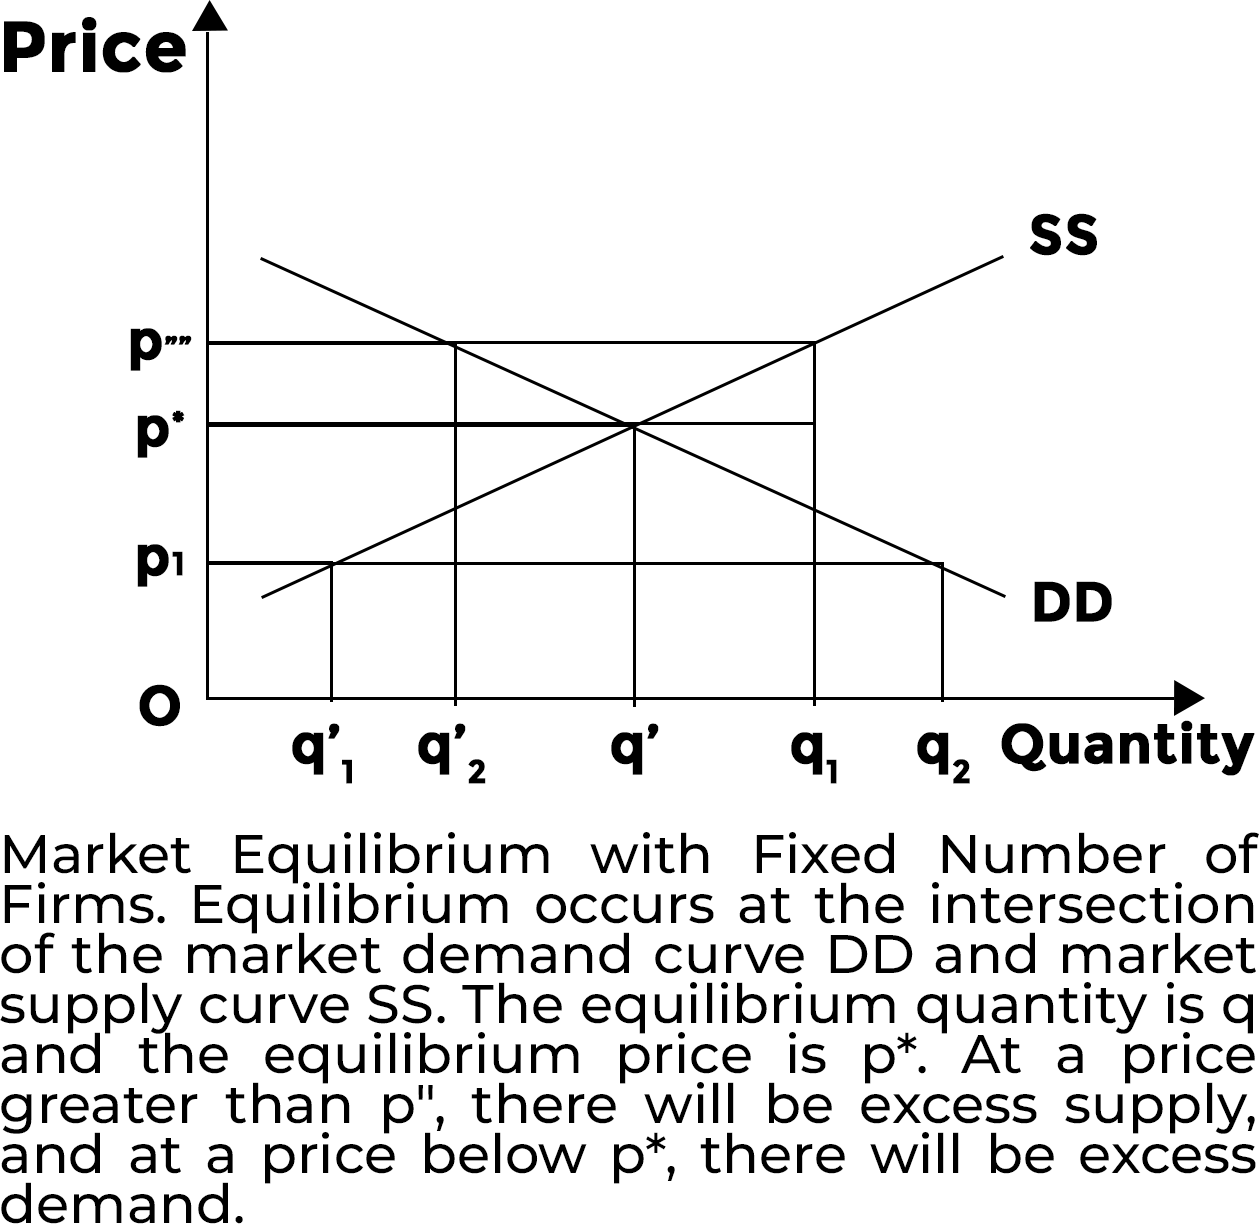
• A state in which all consumers’ and enterprises’ plans align and the market clears is known as an equilibrium. When the market is in equilibrium, supply and demand are equal; that is, the total amount that all businesses want to sell and the total amount that all customers want to purchase.
• The amount bought and sold at the equilibrium price is known as the equilibrium quantity, and the price at which equilibrium is reached is known as the equilibrium price.
• If market supply surpasses market demand at a given price, we refer to this as an excess supply in the market; conversely, if market demand surpasses market supply at a certain price, we call this an excess demand in the market at that price.
• Therefore, equilibrium in a perfectly competitive market can be defined alternatively as zero excess demand-zero excess supply situation.
• There is a propensity for prices to fluctuate whenever market supply and demand are out of balance, which results in an unbalanced market.
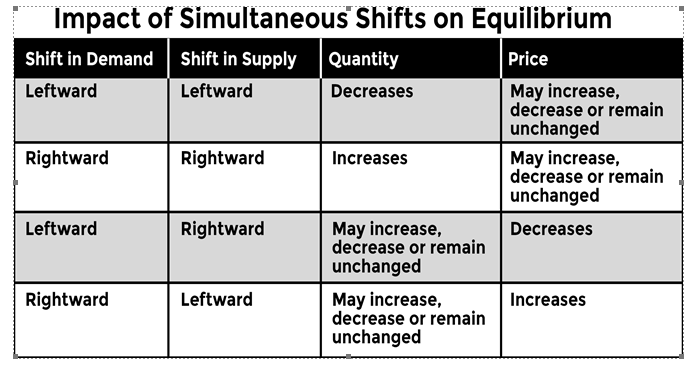
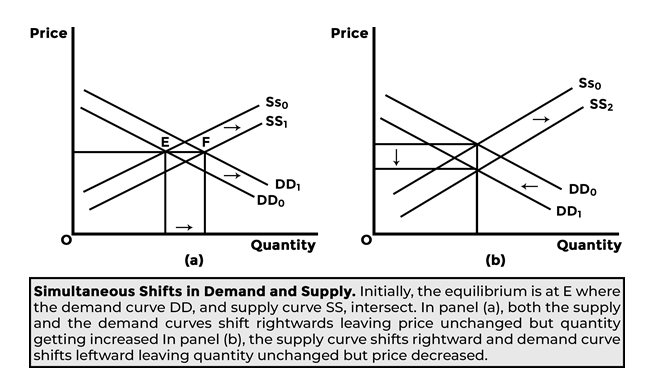
Simultaneous Shifts of Demand and Supply
The simultaneous shifts can happen in four possible ways:
• Both supply and demand curves shift rightwards.
• Both supply and demand curves shift leftwards.
• Supply curve shifts leftward and demand curve shifts rightward.
• Supply curve shifts rightward and demand curve shifts leftward
Price Floor: The government establishes floors or minimum prices for various commodities and services because it is undesirable for their prices to drop below a specific point. Price floors are lower limits set by the government on what can be charged for specific goods or services. The most well-known instances of price floors being imposed are minimum wage laws and agricultural price support programmes.
• Imposition of price ceiling below the equilibrium price leads to an excess demand.
• Imposition of price floor above the equilibrium price leads to an excess supply
Non-competitive Markets
• Monopoly
A monopoly is a type of market arrangement where there is only one seller. A market system with a monopoly demands that
A specific commodity is produced by a for example, Indian Railways has a monopoly over railway transportation in India.
This commodity cannot be replaced by any other commodity;
And for this to continue over time, there must be enough barriers in place to stop any other company from joining the market and beginning to sell the commodity
In this market, consumers are price takers
Note
In general, there is an inverse relationship between competitive behaviour and competitive market structure: the more competitive the market structure, the less competitive the company behaviour. Conversely, more firms will behave competitively towards one another under a less competitive market structure. There isn’t another company to compete with in a monopoly.Each firm employs labour up to the point where the marginal revenue product of labour equals the wage rate
B Monopolistic Competition
A market structure in which there are many enterprises, their entry and exit are unrestricted, but the goods they produce are not all the same. We refer to this type of market structure as monopolistic competition
Monopolistic competition is commonly found in industries such as restaurants, clothing, personal care products, and consumer electronics, where firms try to differentiate their products through branding, design, or other unique features
C . Oligopoly
An oligopoly is a market structure in which there are many vendors in a given commodity market, but the total number of sellers is relatively small.
Duopoly is the name given to the unique instance of oligopoly in which there are precisely two vendors.
Assumptions:
The goods that both companies offer are uniform and
There isn’t a replacement product made by any other company.
The way businesses engage with one another determines the industry’s output level, pricing levels, and profit margins. In the event that one of the two firms in a duopoly decides to double its output, for instance, the overall supply in the market will rise significantly, resulting in a decrease in price. All of the industry’s businesses’ profitability are impacted by this price decline. In response, other businesses will make new decisions about how much to create in an effort to safeguard their own earnings
Production and Costs
PRODUCTION AND COSTS
Short run costs
• In the short run, some of the factors of production cannot be varied, and therefore, remain fixed. The cost that a firm incurs to employ these fixed inputs is called the total fixed cost (TFC).
• Whatever amount of output the firm produces, this cost remains fixed for the firm. To produce any required level of output, the firm, in the short run, can adjust only variable inputs. Accordingly, the cost that a firm incurs to employ these variable inputs is called the total variable cost (TVC). Adding the fixed and the variable costs, we get the total cost (TC) of a firm.
• In order to increase the production of output, the firm must employ more of the variable inputs. As a result, total variable cost and total cost will increase. Therefore, as output increases, total variable cost and total cost increase.
Long Run Costs
• In the long run, all inputs are variable. There are no fixed costs.
The total cost and the total variable cost therefore, coincide in the long run
Shut Down Point: The last price-output combination at which the firm produces positive output is the Shut Down Point.
Normal Profit: The minimum level of profit that is needed to keep a firm in the existing business is defined as normal profit. A firm that does not make normal profits is not going to continue in business. Normal profits are therefore a part of the firm’s total costs.
Super-normal profit: Profit that a firm earns over and above the normal profit is called the super-normal profit.
Break-even point: The point on the supply curve at which a firm earns only normal profit is called the break-even point of the firm
Circular Flow Model
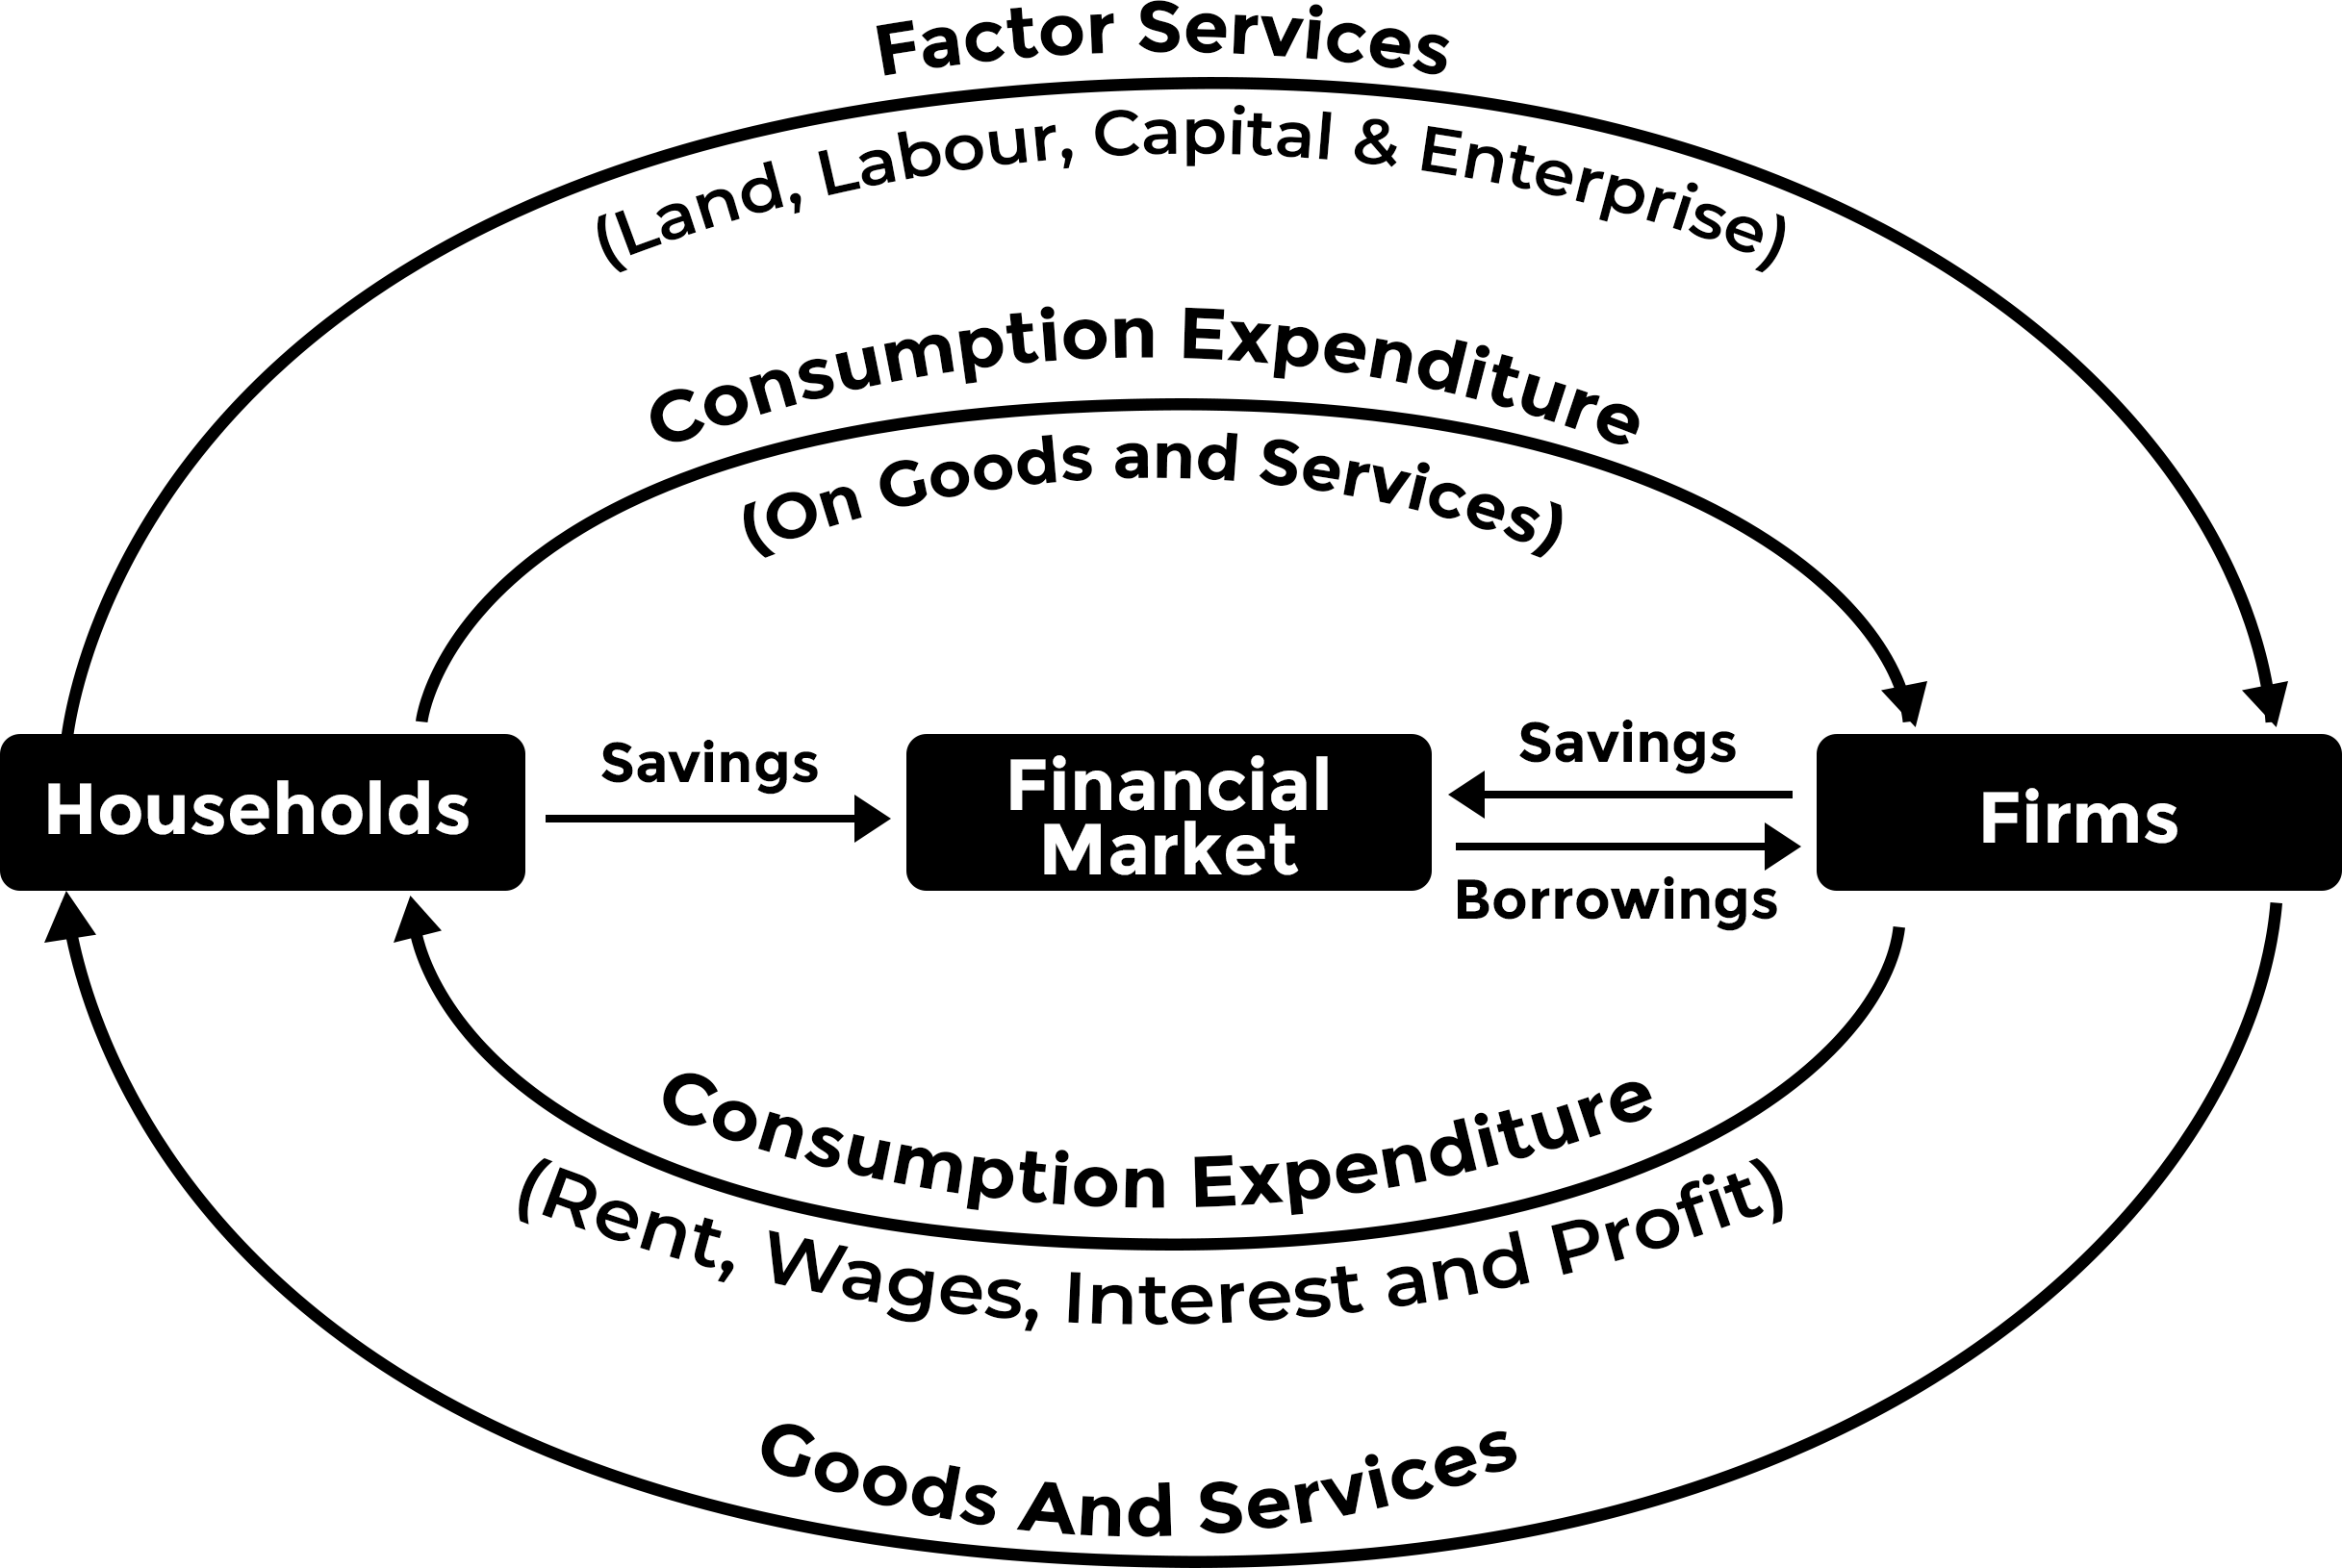
• The circular flow model is an economic model that presents how money, goods, and services move between sectors in an economic system. The flows of money between the sectors are also tracked to measure a country’s national income or GDP, so the model is also known as the circular flow of income.
• The idea of circular flow was first introduced by economist Richard Cantillon in the 18th century and then progressively developed by Quesnay, Marx, Keynes, and many other economists.
• How an economy runs can be simplified as two cycles flowing in opposite directions. One is goods and services flowing from businesses to individuals, and individuals provide resources for production (labor force) back to the businesses.
• In the other direction, money flows from individuals to businesses as consumer expenditures on goods and services and flows back to individuals as personal income (wages, dividends, etc.) for the labor force provided. This is the most basic circular flow model of an economy. In reality, there are more parties participating in a more complex structure of circular flows.
Two-Sector Model
• The model described above is the two-sector model, which is the most basic model containing only two sectors: individuals or households and businesses.
• In the two-sector model, it is assumed that households spend all their incomes as consumer expenditures and purchase the goods and services produced by businesses. Thus, there are no taxes, savings, or investments that are associated with other sectors.
Three-Sector Model
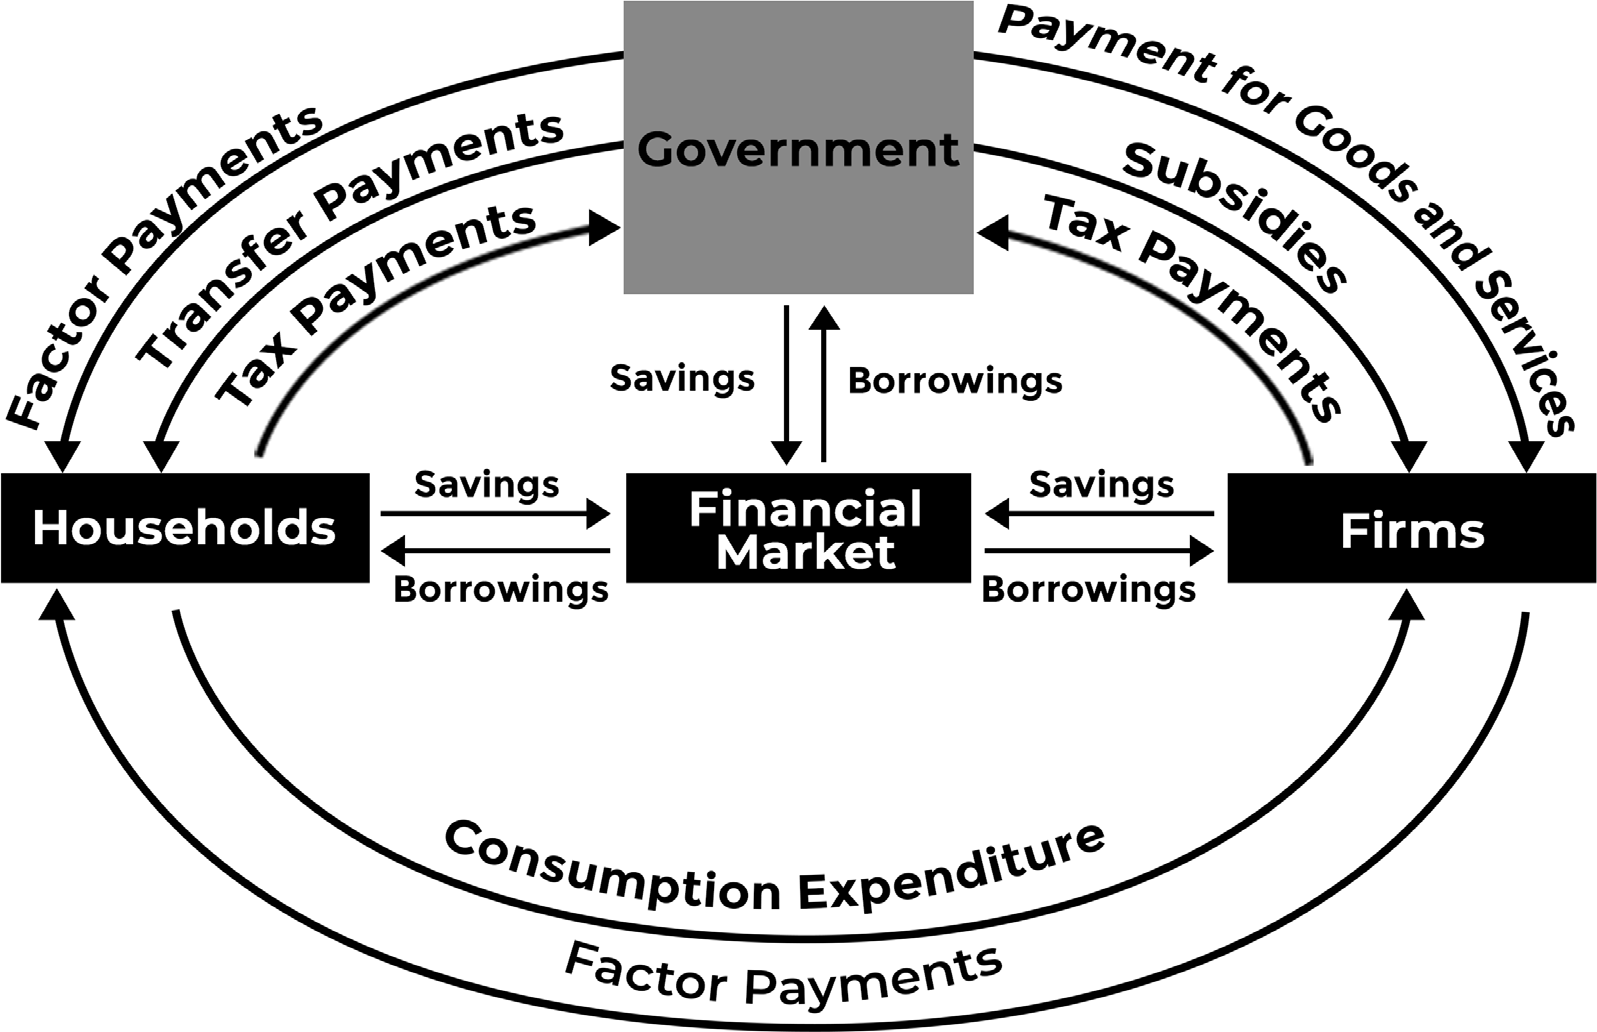
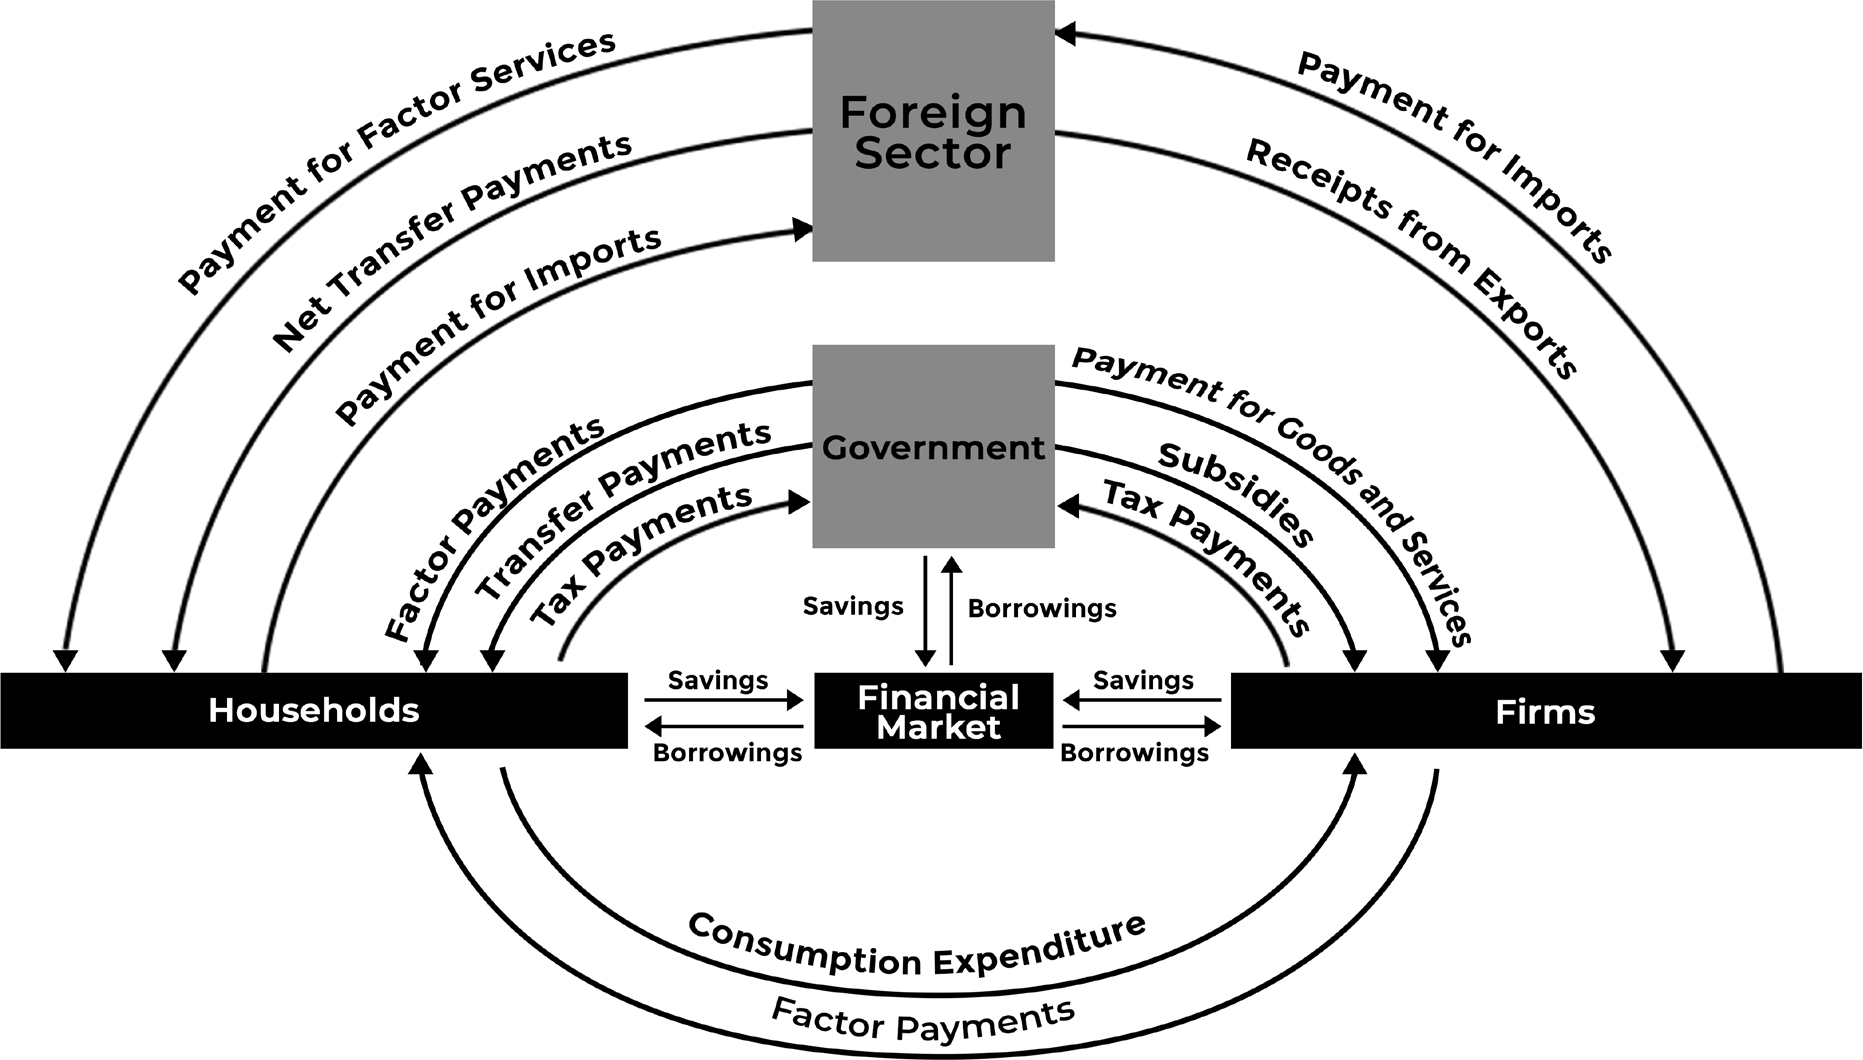
In the three-sector model, the government is added to the two-sector model. In this model, money flows from households and businesses to the government in the form of taxes. The government pays back in the form of government expenditures through subsidies, benefit programs, public services, etc.
Four-Sector Model
The four-sector model contains the foreign sector, which is also known as the overseas sector or external sector. The overseas sector turns a closed economy into an open economy. It is connected to the other sectors through two flows of money: foreign trade (imports and exports) and foreign exchange (inflow and outflow of capital). Like the other sectors, each flow of money is paired with a flow of a factor of production or goods and services.
Five-Sector Model
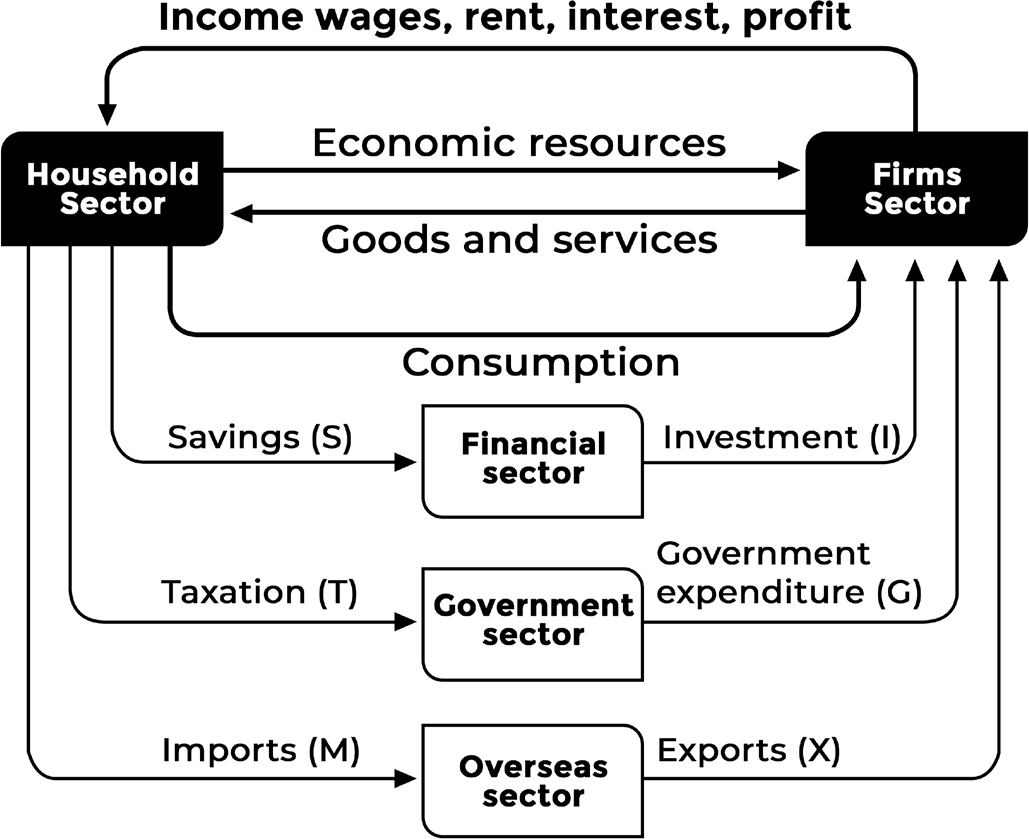
The fifth sector – the financial sector – is added to complete the circular flow model. It includes banks and other institutions that provide borrowing and lending services to the other sectors. Savings and investments are assumed in the five-sector model, which flow from other sectors with residual cash into the financial institutions, then out to the sectors that need money. As long as lending (injection) is equal to borrowing (leakage), the circular flow reaches an equilibrium and can continue forever
Implications of the Circular Flow Model
As a fundamental concept of macroeconomics, the circular flow model has been widely applied in different studies, with significant impacts on the understanding of economics. Four examples are listed below to show the significance of the model.
• Measurement of national income: The sectors in the circular flow model are the components of the calculation of national income. The expenditure approach calculates a nation’s GDP as the sum of the household consumption expenditures, private domestic investment, government consumption and investment expenditures and net exports (GDP = C + I + G + [X-M]).
• Knowledge of interdependence: The circular flow model underpins the knowledge of interdependence between sectors in an economic system. The activities and money flows cannot take place without interaction with another sector.
• Unending nature of economic activities: Money and economic resources flow in cycles indefinitely with an equilibrium of aggregate income and expenditures.
• Injections and leakages: The circular flow of an economy is balanced when the total injections equal the leakages. If injections overweight leakages, the country’s national income will grow. If injections are below leakages, the national income will decrease.
Invisible Hand
The term “invisible hand” first appeared in Adam Smith’s famous work, "The Wealth of Nations", to describe how free markets can incentivize individuals, acting in their own self- interest, to produce what is socially necessary.
The invisible hand is a metaphor for how, in a free market economy, self-interested individuals operate through a system of mutual interdependence.
This interdependence incentivizes producers to make what is socially necessary, even though they may care only about their own well-being.
Each free exchange creates signals about which goods and services are valuable and how difficult they are to bring to market.
Critics argue that the invisible hand does not always produce socially beneficial outcomes, and can encourage greed, negative externalities, inequalities, and other harms.
Paradox of Thrift
The "paradox of savings" means that if everyone saves too much money, it can actually hurt the economy and lead to less savings overall. This seems strange because we usually think that saving more is good for everyone.
Even though saving is good for people, it might not be good for the economy. This idea comes from the theory that when people save too much and don’t spend enough, it can cause economic problems.
Where it came from: The idea was explained by the economist John Maynard Keynes in his book The General Theory of Employment, Interest, and Money (1936). Keynes thought that saving too much is bad for the economy, and that it’s better if people spend more money.
When people save, businesses use that money to create goods and services. But if people don’t buy enough of those things, businesses can lose money and stop investing. This slows down the economy. However, when people spend more, it helps businesses grow and the economy to improve.
Productivity
Productivity, in economics, measures output per unit of input, such as labor, capital, or any other resource. It is often calculated for the economy as a ratio of gross domestic product (GDP) to hours worked. Labor productivity may be further broken down by sector to examine trends in labor growth, wage levels and technological improvement. Corporate profits and shareholder returns are directly linked to productivity growth.
At the corporate level, productivity is a measure of the efficiency of a company’s production process, it is calculated by measuring the number of units produced relative to employee labor hours or by measuring a company’s net sales relative to employee labor hours.
Types of Productivity Measures
Labor Productivity
• The most commonly reported productivity measure is labor productivity published by the Bureau of Labor Statistics. This is based on the ratio of GDP to total hours worked in the economy.
• Labor productivity growth comes from increases in the amount of capital available to each worker (capital deepening), the education and experience of the
workforce (labor composition), and improvements in technology (multi-factor productivity growth).
Total Factor Productivity
• There are many factors that impact a country’s productivity. Such things include investment in plant and equipment, innovation, improvements in supply chain logistics, education, enterprise and competition. It is interpreted as the contribution to economic growth made by managerial, technological, strategic and financial innovations.
• Also known as multi-factor productivity (MFP), this measure of economic performance compares the number of goods and services produced to the number of combined inputs used to produce those goods and services. Inputs can include labor, capital, energy, materials and purchased services.
Capital Productivity
• Capital as a productivity measure looks at how efficiently physical capital is being used to create goods or services. Physical capital includes tangible items, such as office equipment, labor materials, warehouse supplies and transportation equipment (cars and trucks).
• Capital productivity is calculated by subtracting liabilities from physical capital. You then divide the sales number by the difference. A higher capital productivity number shows that physical capital is being used efficiently in the creation of goods and services while a lower capital productivity number shows the opposite.
Material Productivity
Measuring productivity by materials looks to measure output by the materials consumed. Materials consumed can be heat, fuel, or chemicals in the process to create a good or service. It analyzes the output generated per unit of material consumed.
Capital Output Ratio
• The concept of capital output ratio expresses the relationship between the value of capital invested and the value of output.
• The capital required to generate a single unit of output is
known as the capital output ratio. Assume, for instance, that an economy’s investment is 32% (of GDP) and that the growth of the economy is 8% at this level of investment.
• A high capital-to-output ratio indicates that significant capital is required to generate a single unit of output.
• Hence, growth will be constrained even with significant savings if there is a high capital-output ratio.
• In this case, an investment of Rs 32 yields an output of Rs 8. The ratio of capital output is 32/8, or 4. Put another way, four units of capital are required to produce one unit of output. Remember, though, that the Rs 32 you invested on the machinery will last for 10 or twelve years. Each year, this mechanism will produce one rupee.
Incremental Capital Output Ratio (ICOR)
• The incremental capital output ratio (ICOR) is a frequently used tool that explains the relationship between the level of investment made in the economy and the subsequent increase in the gross domestic product (GDP). ICOR indicates the additional unit of capital or investment needed to produce an additional unit of output.
• The utility of ICOR is that with more and more investment, the capital output ratio itself may change and hence the usual capital output ratio will not be useful.
• ICOR is a metric that assesses the marginal amount of investment capital necessary for a country or other entity to generate the next unit of production.
• A lower ICOR is a sign of more efficient production in a certain nation. Higher ICOR values are not recommended as they suggest inefficient production by the entity. The metric is primarily used to assess the degree of production efficiency in a nation.
• Some critics of ICOR have suggested that the use of ICOR is limited as it favors developing countries that can increase infrastructure and technology use as opposed to developed countries, which are operating at the highest level possible. For example, a developing country can theoretically increase its GDP by a greater margin with a set number of resources than its developed counterpart can.
ICOR can be calculated as:
ICOR= Annual Investment/Annual Increase in GDP