Initiatives and Policies to Reduce Poverty
INITIATIVES AND POLICIES TO REDUCE POVERTY
The fundamental goal of the government’s development strategies is social justice, as stated in the Indian Constitution and five-year plans.
All policy documents place emphasis on reducing poverty and state that the government must employ a variety of strategies to achieve this goal.
There were three facets to the government’s strategy for reducing poverty.
• First approach: Focus on Growth: It is predicated on the idea that the swift rise in the gross domestic product and per capita income that characterises economic growth will have a knock-on effect on all facets of society, including the impoverished.
In the 1950s and the early 1960s, planning was primarily focused less developed areas and the more disadvantaged segments of the community would gain from the quick industrial development and the green revolution-style agricultural transformation of a few areas.
However, according to economists, the poor have not benefited from economic growth.
• Second approach: Poverty Reduction Programmes:
Policymakers began to consider the possibility of increasing the incomes and employment of the poor to directly address the issue of poverty. Certain programmes aimed at reducing poverty could help achieve this. This second approach has been initiated from the Third Five Year Plan (1961-66) and progressively enlarged since then.
Food for Work was a prominent initiative launched in the 1970s.
Increasing the number of programmes for wage employment and self-employment is thought to be one of the most effective ways to combat poverty.
The Prime Minister’s Rozgar Yojana (PMRY): educated jobless individuals from low-income rural and urban households can receive financial assistance to launch any type of business venture that creates jobs.
Rural Employment Generation Programme (REGP): It aims to provide urban areas with opportunities for self-employment. It is being carried out by the Khadi and Village Industries Commission. Bank loans are one way that this programme provides financial support for starting small businesses.
Swarna Jayanti Shahari Rozgar Yojana (SJSRY): The primary goal of SJSRY is to increase employment opportunities in urban areas, including waged and self-employment jobs.
Self Help Groups: Previously, families or individuals received financial assistance under programmes for self-employment. This strategy has evolved since the 1990s. Self-help groups are now encouraged to be formed by those who want to benefit from these programmes. They are initially urged to save some cash and make small loans to one another. Subsequently, the government offers SHGs partial financial support through banks; the SHGs then choose who gets the loan for self-employment activities. One such initiative is the Swarnajayanti Gramme Swarozgar Yojana (SGSY). The National Rural Livelihoods Mission (NRLM) is the new name for this. For the urban poor, a comparable initiative known as the National Urban Livelihoods Mission has also been implemented.
The government offers numerous programmes aimed at creating wage jobs for low-income, unskilled individuals residing in rural regions.
Mahatma Gandhi National Rural Employment Guarantee Act: Passed by the Parliament in August 2005, permits every rural household with an adult volunteer to perform unskilled manual labour for at least 100 days a year in exchange for a guaranteed wage.
• Third approach: Welfare Measures:
• The provision of bare minimum necessities for people is the third strategy for combating poverty.
• India was one of the first countries in the world to realise that the standard of living could be raised by public spending on social consumption needs, such as the supply of food grains at discounted prices, health care, education, water supply, and sanitation.
• Programmes implemented under this strategy are anticipated to increase the poor’s consumption, generate jobs, and enhance health and education.
This strategy can be traced back to the Fifth Five Year Plan. The Integrated Child Development Scheme, the Public Distribution System, and the Midday Meal Scheme are three significant initiatives that work to improve the food and nutritional status of the underprivileged.
In the same direction are also the Pradhan Mantri Gramme Sadak Yojana, Pradhan Mantri Gramodaya Yojana, and Valmiki Ambedkar Awas Yojana.
To assist a few particular groups, the government also runs a number of other social security programmes.
One such federally-initiated programme is the National Social Assistance Programme. Pensions are provided under this programme to elderly individuals, widows and impoverished women who have no one to care for them.
Poverty Alleviation Programmes — A Critical Assessment
The number of absolute poor in several states is now significantly lower than the national average for the first time since independence, a testament to the success of efforts to reduce poverty.
Over the past 55 years, the approach to reducing poverty has changed gradually, but there hasn’t been a significant shift in it.
This is because the non-poor have appropriated the benefits of direct programmes aimed at reducing poverty due to the unequal distribution of land and other assets.
There are not enough resources available for these programmes in relation to the severity of poverty.
Furthermore, the execution of these programmes is mostly dependent on bank and government officials. Resources are wasted and used inefficiently because these officials lack motivation, are poorly trained, are prone to corruption and are susceptible to pressure from a range of local elites.
Institutions operating at the local level do not participate in the execution of programmes either.
The great majority of vulnerable people who live at or near the poverty line have not been adequately served by government policies.
It also shows that poverty cannot be eradicated by rapid growth alone. Any programme cannot be implemented successfully without the poor’s active participation.
Amartya Sen’s capability approach
The Indian economist and philosopher Amartya Sen is primarily credited with coining the capability approach, which he did so in the 1980s. The United Nations Development Programme, for instance, has made extensive use of it in the context of human development as a deeper and more comprehensive measure than GDP per capita growth or other purely economic indicators. Here, “development” is defined as the expansion of capability, and “poverty” is defined as the lack of the ability to live a decent life.
Randomised Controlled Trial- Abhijit Banerjee
An experiment intended to determine the impact of a particular variable or intervention on a particular outcome or event is called a randomised controlled trial (RCT).
Starting in the 1990s, Mr. Banerjee, Ms. Duflo, and Mr. Kremer applied RCT to the study of economics. Economists and other social science researchers can isolate the unique effect that a particular factor by itself has on the entire event through the use of RCTs. For example, in order to assess the potential effects of hiring more teachers on children’s learning, researchers need to account for the influence of other variables on the final event, such as intelligence, nutrition, climate, economic and social status, etc., all of which may also have varying degrees of influence on learning outcomes.
UNIVERSAL BASIC INCOME
Universal basic income (UBI) defined as a transfer that is provided universally and unconditionally. Under this kind of programme, the government pays a set amount of money to each and every citizen of the nation on a regular basis to cover a person’s basic needs, such as clothing, food, and housing.
The Economic Survey identifies three essential elements of universal basic income (UBI)
Every citizen is paid in cash.
These payments are made without conditions and
These funds are available for any individual to use however they please.
The idea of UBI in India
A May 2019 report commissioned by the Economic Advisory Council to PM (EAC-PM) in India recommended that the government implement a Universal Basic Income (UBI) programme in order to lessen glaring income disparities.
According to the Economic Survey 2016–17, a thorough analysis of the UBI is warranted. According to the Survey, the initiative, which aims to eradicate poverty in the nation, will reduce it to 0.5% of the population but will cost 4-5% of GDP.
The argument in Favor of UBI
• Poverty and vulnerability reduction: It will reduce income inequality thereby it will help in the eradication of poverty.
• Inclusive: since everyone is being targeted, there is no exclusion error (the impoverished are not left out).
• Insurance: The income floor will act as a safety net against unforeseen events such as the Covid-19 Pandemic that could affect one’s health or finances.
• Financial Inclusion: Payment transfers will promote increased bank account usage, which will increase bank correspondents’ earnings and result in an endogenous increase in financial inclusion.
• Psychological Benefits: The stress of making ends meet every day will be lessened with a guaranteed income.
• Administrative Efficiency: The state’s administrative burden will be lessened if a universal basic income is implemented in lieu of numerous distinct government programmes.
Argument Against UBI
• Wasteful Spending: Families, particularly those headed by men, might use this extra money for extravagant expenses.
• Moral Hazard (Decrease in Workforce): A minimum guaranteed income could encourage laziness and discourage people from entering the workforce. It lessens the motivation to work.
• Market risk exposure (cash vs. food): A cash transfer’s purchasing power could be significantly reduced by market fluctuations, in contrast to food subsidies, which are not impacted by shifting market dynamics.
• Universality-based political economy: The transfer to wealthy individuals may cause opposition because it appears to take precedence over the concepts of equity and public assistance for the underprivileged.
• Fiscal Burden of the Government: The social security and tax systems would need to be completely redesigned.
Conclusion
Only when the poor begin actively participating in the process of growth will poverty be effectively eradicated. This is made possible by a social mobilisation process that empowers and encourages the participation of the poor. Additionally, this will support the creation of job opportunities, which could raise income, skill levels, health, and literacy rates. Additionally, it’s important to pinpoint areas that are impoverished and build infrastructure there, including roads, schools, electricity, telecom, IT services, training facilities, etc.
Poverty
POVERTY
We categorise people into two groups in order to define poverty: those who are poor and those who are not, with the poverty line dividing the two. The completely poor, the extremely poor, and the poor are just a few of the various types of poverty. Similar to the poor, there are different categories of non-poor people as well: rich, extremely rich, absolutely rich, middle class, and upper middle class.
Categorising Poverty
Poverty can be classified in a variety of ways. The term “chronic poor” refers to a group of people that includes those who are always impoverished and those who are typically impoverished but occasionally have a little money (such as casual workers).
The occasionally poor, who are generally wealthy but may occasionally experience a run of bad luck, and the churning poor, who frequently fluctuate between poverty and prosperity (like small farmers and seasonal workers). We refer to them as the impermanent poor. Then there are the non-poor, or those who are never in poverty.
Absolute Poverty: a situation in which household income is insufficient to maintain the necessities of life (housing, food, and shelter). This allows intercountry comparisons over time.
The “Dollar a Day” poverty line, which was first established in 1990, determined absolute poverty using the benchmark of the world’s poorest nations. In October 2015, the World Bank reset it to $1.90 a day.
Relative Poverty: It is characterised as having a household income that is less than the national median income. They may not have the same level of living as the bulk of society, but those who fall into the category of relative poverty are relatively impoverished even though they may not be lacking all essential needs.
Situational Poverty: It is a type of poverty that occurs as a result of an adverse event such as an environmental disaster, job loss, or a severe health problem. Even with modest assistance, people can help themselves because poverty is the outcome of an unfortunate event.
Generational Poverty: It is transmitted to people and families from one generation to the next. This is more challenging because there is no way out because everyone is caught up in the root of the problem and lacks access to the necessary resources.
Multidimensional poverty
A person how is poor can suffer multiple disadvantages at the same time-for example they may have poor health or malnutrition, lack of clean water or electricity, poor quality of work or little schooling. Focusing on one factor alone, such as income is not enough to capture the true reality of poverty.
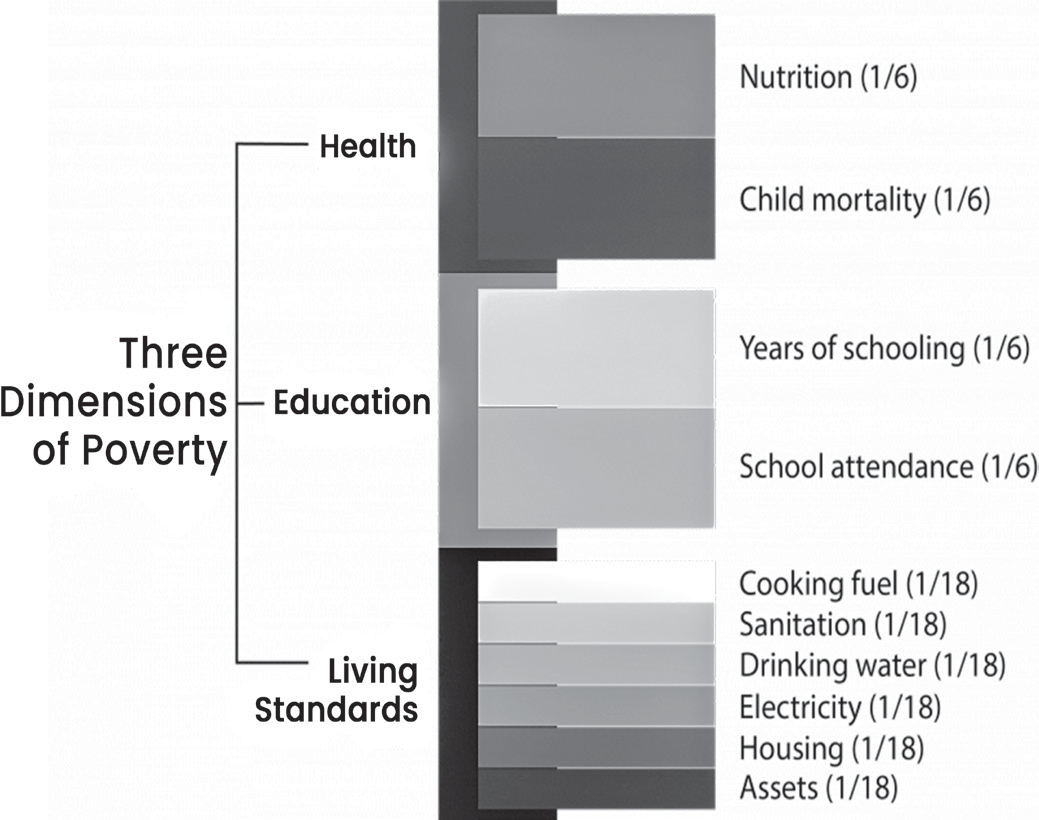
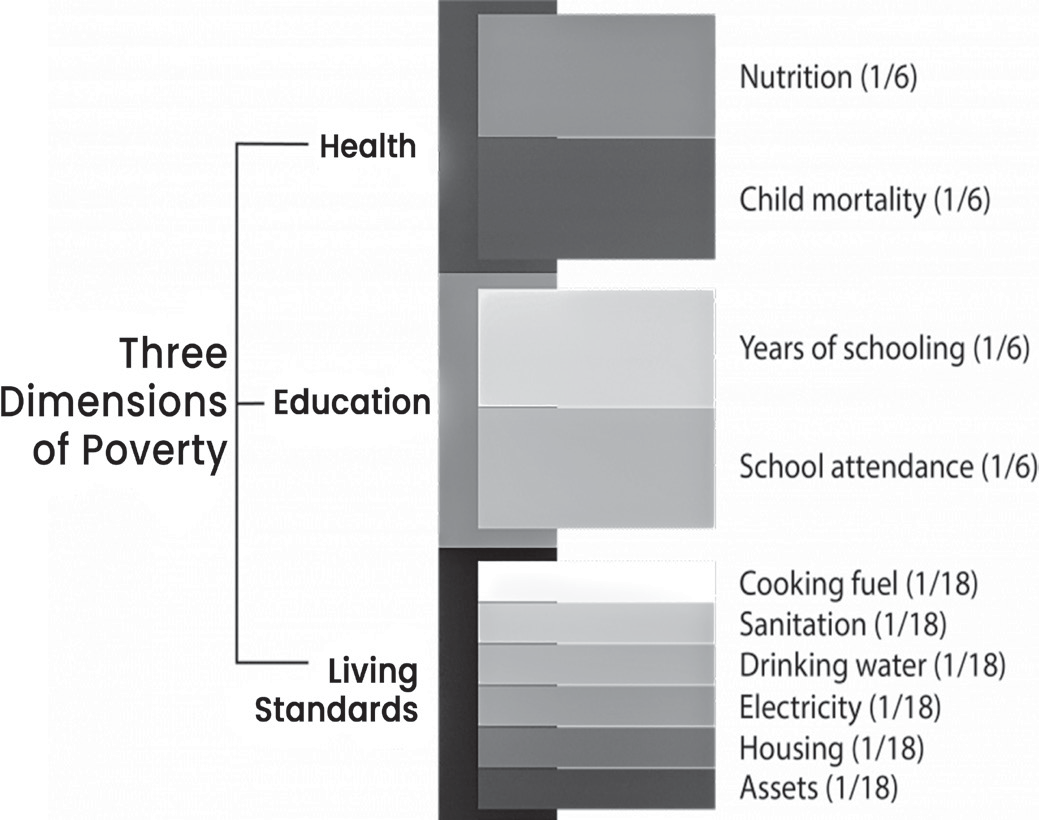
Multi-dimensional Poverty 2025
It mentions that 18.3% population of the surveying countries remain in acute multidimensional poverty they are majorly belongs to the young section of the society of low-income countries which may be the outcome of misuse and mishandling of demographic dividend.
For Indian point of view the report gives some good news that the level of poverty has declined from 55.1% in 2005-2005 to 16.4% in 2019-21 this was the outcomes of the schemes and programs related to eliminate extreme poverty for example PM Garib Kalyan Anna Yojan.
Causes of Poverty in India
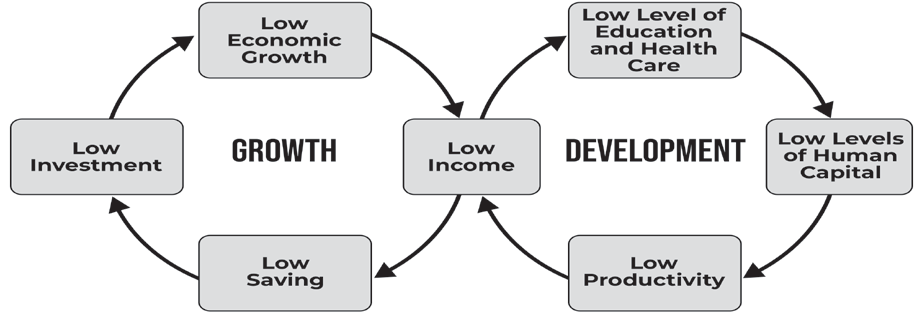
Population Rise: The population of India has been growing steadily over time. Over the previous 45 years, it has grown at a rate of 2.2 percent annually, meaning that about 17 million new people are added to the nation’s population annually. This significantly affects how much demand there is for consumer goods.
Low Agricultural Productivity: One of the main causes of poverty is the agriculture sector’s low productivity. Numerous factors can lead to low productivity. The main causes are divided and fragmented landholdings, a lack of funds, a lack of knowledge about contemporary farming technology, the application of traditional farming methods, loss during storage, and other elements.
Insufficient Use of Resources: The nation faces hidden and underemployment, especially in the agriculture sector. This has led to low agricultural productivity and a decline in living standards.
Economic Development at a Slow Pace: Prior to the 1991 LPG reforms, India’s economy developed slowly during the first 40 years of its independence.
Inflation: Price hikes have been ongoing in the nation, which has increased the burden already placed on the poor. The lower-income groups have suffered as a result and are unable to meet even their most basic needs, despite the fact that a few people have benefited.
Another factor that fuels poverty in India is:
• Unemployment: There are more people looking for work than there are employment opportunities. To meet the demand for work, however, this increase in possibilities is insufficient.
• Social Issues: India’s attempts to eradicate poverty are hampered by social issues in addition to economic ones. In this regard, barriers include inheritance laws, the caste system, and specific customs, to mention a few.

POVERTY ESTIMATION IN INDIA
Planning Commission of the past served as the official body responsible for estimating poverty. Since the 1960s, India has conducted recurring assessments of the prevalence of poverty using the methodology recommended by the Expert Groups/Committees that the Planning Commission occasionally constituted.
The National Sample Survey Office (NSSO) large sample survey of consumer expenditure data and the class distribution of individuals obtained from the survey constitute the basis for measuring the poverty ratio in India. The poverty line is quantified in terms of per capita consumption expenditure over a month.
A household is considered to be poor if its consumption expenditures fall below the federal poverty line, or “Below the Poverty Line (BPL)”. Reference Poverty Line Baskets (PLBs) are a set of products and services used to measure consumption.
Measures to estimate Poverty
Poverty Line: The traditional method of determining how poor a person is to set a minimum spending level (or income level) that must be met in order to buy a basket of goods and services that are required to meet their most basic needs. This minimum spending level is known as the poverty line.
Calculation of Poverty Lines: The NITI Aayog task force currently estimates poverty in India by calculating poverty lines using information from the National Sample Survey Office, which is part of the Ministry of Statistics and Programme Implementation (MOSPI). Formerly responsible for determining India’s poverty line, the Planning Commission has been superseded as a policy think tank by NITI Aayog.
Basket of Poverty Line: The Poverty Line Basket (PLB) is the collection of goods and services required to meet the necessities of human existence.
Ratio of Poverty: The poverty ratio, also known as the Headcount Ratio (HCR), is the percentage of the population that lives below the poverty line.
BPL Census
The government uses the “Below Poverty Line” as a benchmark and poverty threshold to identify people and households that are economically disadvantaged and in need of assistance.
The BPL was identified using three criteria: automatic inclusion, automatic exclusion, and ranking based on a seven-point deprivation index. Three categories were used to categorise the rural population: those living above the poverty line were excluded, and those in the BPL category were automatically included. The third category allowed for the targeted population to be identified using seven parameters, referred to as the deprivation index, and ranked
correspondingly. These consist of, among other things, single-room occupancy households, homes without an adult member between the ages of 16 and 59, and homes without an adult who is literate and older than 25. The information was uploaded on the central server at the tehsil level after the responses were entered into a portable PC tab.
Data Collection Methods
• Uniform Resource Period (URP): The poverty line was based on URP data until 1993–1994, which necessitated asking respondents about their consumption during a 30-day recall period. To put it another way, the data was based on the recall of consumption expenditure over the 30 days prior.
• Mixed Reference Period (MRP): In 1999–2000, the NSSO started employing the MRP technique, which measures consumption of all products over the previous 30 days as well as five low-frequency goods (education, durables, apparel, footwear, and institutional health spending) over the previous year.
• In other words, survey respondents are questioned about consumption in the preceding year for the five goods. They are questioned about consumption in the past 30 days for the remaining foods.
• Modified Mixed reference period (MMRP): The Rangarajan Committee suggested a Modified Mixed Reference Period (MMRP) in place of the Mixed Reference Period (MRP), where reference periods for various items were taken as follows:
• 365 days for durable goods, education, institutional medical care, apparel, and footwear.
• Edible oil, eggs, fish and meat, vegetables, fruits, spices, drinks, snacks, processed food, pans, tobacco, and intoxicants are all considered for seven days.
• Thirty days for the remaining food supplies, light and fuel, other supplies and services (such as non- institutional medical care), rent, and taxes.
HISTORY OF POVERTY ESTIMATION IN INDIA
Pre independence poverty estimates
Dadabhai Naoroji provided one of the first assessments of poverty in his 1901 book, “Poverty and the Un-British Rule in India.” The cost of a subsistence diet that included “rice or flour, dal, mutton, vegetables, ghee, vegetable oil and salt” was the basis for the poverty line he proposed.
The poverty line was estimated by the National Planning Committee (NPC) in 1938 to be between Rs 15 and Rs
20 per person per month. Additionally, NPC used “a minimum standard of living perspective in which nutritional requirements are implicit” when determining what constitutes poverty.
The proponents of the 1944 Bombay Plan proposed a poverty line of 75 per capita annually, which was significantly lower than the NPC.
Post independence poverty estimates
A working group on national poverty estimation was established by the Planning Commission in 1962. It developed distinct poverty lines of Rs 20 and Rs 25 per capita per year, respectively, for rural and urban areas.
In 1971, VM Dandekar and N Rath conducted the first systematic evaluation of poverty in India using data from the 1960–61 National Sample Survey (NSS). They contended that the amount of money needed to provide 2250 calories a day in both rural and urban areas should be used to determine the poverty line. This led to discussions about the minimum standards for calorie intake, how to estimate poverty, and how these standards differed depending on age and gender.
The Algah Committee (1979) developed a poverty line based on dietary needs for both rural and urban areas.
Lakdawala Committee (1993): The report proposed the following changes: (i) consumption expenditure should continue to be determined by calorie consumption; (ii) state-specific poverty lines should be created and updated using the Consumer Price Index of Agricultural Labour (CPI-AL) in rural areas and the Consumer Price Index of Industrial Workers (CPI-IW) in urban areas; and (iii) poverty estimates based on National Accounts Statistics should no longer be “scaled.”
Tendulkar Committee (2009): It made four main recommendations:
• abandoning the use of calories to estimate poverty;
• creating a standard poverty line basket (PLB) for both rural and urban areas of India;
• altering the process for price adjustment to address problems related to timing and space; and
• including private health and education spending in the estimation of poverty.
In contrast to the Uniform Reference Period (URP) based estimates utilised in previous methods of estimating poverty, the Committee recommended using estimates based on the Mixed Reference Period (MRP). Cereal, pulses, milk, edible oil, non-vegetarian foods, vegetables, fresh fruits, dry fruits, sugar, salt, and spices, other food, intoxicants, fuel, clothes, footwear, education, healthcare (both institutional and non- institutional), entertainment, personal hygiene products, other goods, other services, and durables were the basis for its calculations. The Committee recalculated the poverty thresholds in each state’s urban and rural areas.
Rangarajan Committee: The Planning Commission established a new expert panel on poverty estimation in (2012) it was chaired by C Rangarajan submitted its report on the following:
Methodology: Households which were unable to save were considered poor.
Nutritional Requirement: Was assessed based on Indian Council of Medical Research (ICMR) norms as follows:
| Nutrient | Urban Requirement | Rural Requirement |
| Calories | 2090 kcal | 2155 Kcal |
| Protein | 48 gm | 50 gm |
| Fat | 28 gm | 26 gm |
• Modified Mixed Reference Period
• Was used to calculate costs for items based on their
utility e.g. educational expense is considered over a year, food and beverages costs are estimated weekly and cost of rent is calculated on a monthly basis.
Poverty Line
Was notified as Rs 47 in urban areas and Rs 32 in rural areas.

Inequality
INEQUALITY
There are several related viewpoints from which inequality can be viewed. The most widely used metric is Income Inequality, which measures how evenly income is distributed across a population. Related ideas include inequality of opportunity (impacting income due to circumstances over which individuals have no control, such as family socioeconomic status, gender, or ethnic background), inequality of wealth (distribution of wealth across households or individuals at a particular moment in time), and lifetime inequality (inequality in incomes for an individual over his or her lifetime). All of these ideas about inequality are connected to one another and provide various, complementary perspectives on the origins and effects of inequality, which helps governments create more targeted policies to combat inequality.
Causes of Inequality
Market deregulation and liberalization have led to wealth concentration and extreme inequality in the economy.
Technological change, such as new information technology, has improved productivity and well-being but also increased labour income inequality.
Trade globalization - It has promoted competitiveness and efficiency and has also contributed to income inequality.
Capture of power and politics by elites - They can use their power over institutions, politics, public debate, and policy to ensure outcomes that serve their narrow interests rather than the interests of society as a whole, which is a major contributing factor to the rise in economic inequality.
Tax structures: can favor the wealthy by offering lower rates on capital gains or cuts for high earners.
Inheritance: Wealth passed down concentrates advantages, perpetuating economic disparities across generations.
Discrimination: Unequal treatment based on factors like race, gender, or disability limits opportunities and access to resources.
MEASURING INCOME INEQUALITY
Lorenz Curve and Gini Coefficient
An economy’s income distribution is shown by the Lorenz Curve, and the degree of income inequality is gauged by the Gini Coefficient. The equitable (fair) distribution of income is one of the five primary and common macroeconomic aims of a government.
The Lorenz Curve (the actual distribution of income curve), developed by Max Lorenz in 1906, depicts the proportion of money earned by any given percentage of the population. The 45o angle line depicts precisely equal income distribution, whereas the other curved line depicts the real income distribution. The size of the income distribution is more asymmetrical the farther it is from the 45o diagonal.
Gini Coefficient


The Lorenz Curve yields the Gini Coefficient, which is a useful tool for assessing a country’s economic development.
The Gini Coefficient quantifies the extent of income inequality within a population.
Perfect inequality is represented by a coefficient of 1 and perfect equality by a coefficient of 0.
Gini income inequality takes into account consumption or disposable income, which already accounts for any redistribution via taxes and transfers.
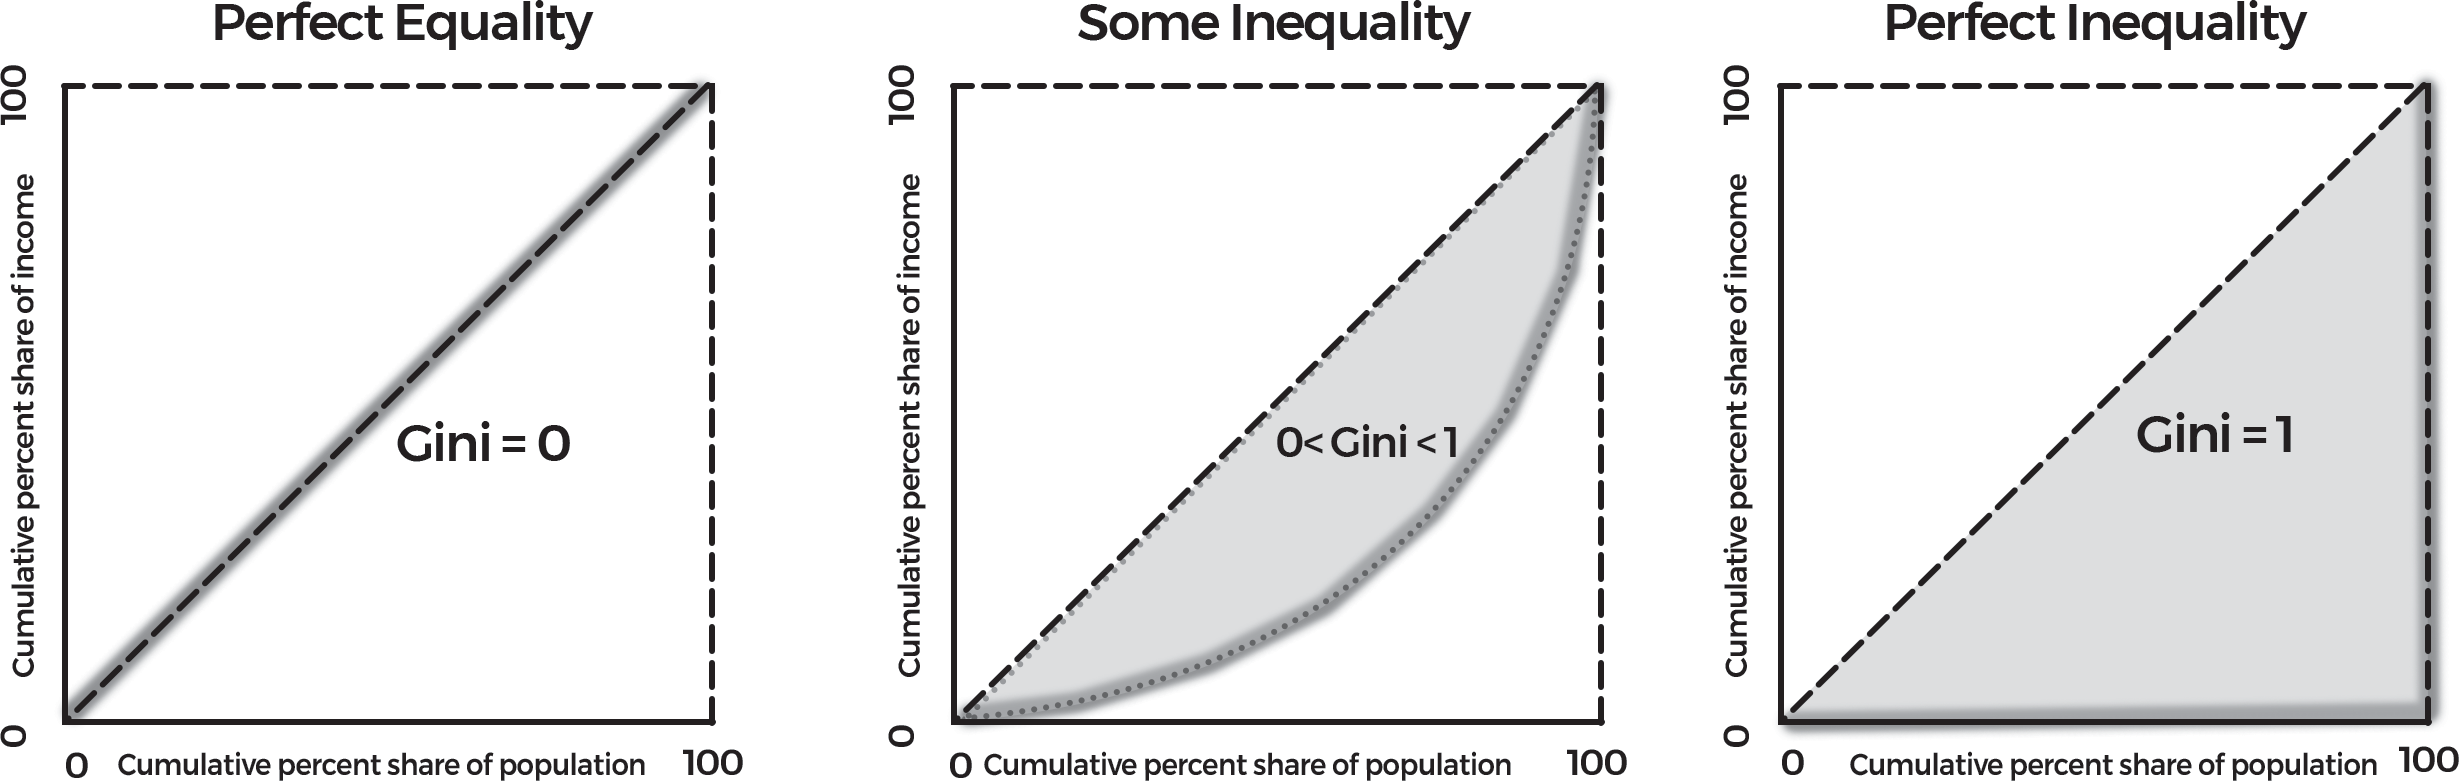
FIG. GINI COEFFICIENT OF INEQUALITY
WORLD INEQUALITY REPORT 2026
World’s scenario
• Top 10% population of the world consist 75% of total wealth of the world but at the same time the lower 50% satisfy with only 2% which is indicating the poor efforts made by the government particularly for public financing and management. At the same time ineffective implementation of welfare schemes shows the incompetency existing in the administration.
• The contribution of the lower 50% population in carbon emission is only 3% while top 10% people contributed with 77%. It shows the technological challenges existing with poor people as they are failed to access the new technologies due to poverty while rich people easily get the new technology and hence contributing less in carbon emission.
• The same scenario appears in climate change sector which shows that the lower income countries are the most affected by the worst impact of the climate change due to insufficient of resources and technologies to counter the climate change.
India’s scenario
India is facing high Income Inequality despite of Sabka Sath, Sabka Vikas. Government of India is running various welfare schemes and program to counter the poverty, however limited resources, large population and delay in census process are acting as a fuel in poverty and inequality which is clearly shows as share of top 10% is ~65% in the total wealth of the country while top 1% makes 40% of the wealth of the country.
OXFAM REPORT 2023
According to the Oxfam 2023 Report, “Survival of the Richest: The India Story,” the richest 1% of Indians currently possess more than 40% of the nation’s total wealth, while the bottom half owns only 3%.
According to the report, imposing a 5% tax on the ten wealthiest individuals in India could provide sufficient revenue to enable children to return to school.
The study draws attention to the gender pay gap in India, where female employees make just 63 paise for every rupee earned by male employees.
Oxfam India reports that marginalized communities like Dalits, Adivasis, Muslims, women, and informal sector workers in India continue to suffer due to a system prioritizing the survival of the rich, leading to higher taxes and increased spending on essential items.
INCLUSIVE WEALTH REPORT (IWR) 2023
The United Nations Environment Programme (UNEP) oversees the biennial Inclusive Wealth Report (IWR), which assesses economic sustainability and well-being
Key Findings
Per capita inclusive wealth inequality increased between 1990 and 2010, but declined after 2010. In 2019, global inclusive wealth inequality was lower than in 1990 due to a reduction in produced capital inequality, particularly in developing countries like China and India. Human capital inequality rose in the 1990s but stabilized after 2000, but it became the highest of all wealth inequalities in 2019.
Global inequality in per capita terms has been increasing since 1998 (from Gini Index 0.67 in 1998 to 0.72 in 2019) showing deepening inequality across countries.
This trend is likely to continue because of shrinking natural resources and ever-growing population.
The global community must reverse the declining trend in natural capital by investing in renewable natural capitals through restoration and clean energy technologies
Government’s Initiatives
The government places reducing inequality at the top of its priority list. The Indian government has undertaken a number of initiatives aimed at eradicating poverty and inequality as well as empowering the marginalised segments of society. These initiatives include broadening the social safety net through the Pradhan Mantri Suraksha Bima Yojana (Accident Insurance), Atal Pension Yojana
(Unorganised Sector), and Pradhan Mantri Jeevan Jyoti Yojana (Life Insurance) and providing institutional support for entrepreneurship with the assistance of MUDRA Bank. Additionally, a National Hub for SC/ST entrepreneurs has been established to assist entrepreneurs from marginalised communities. In addition to giving the underprivileged members of society access to institutional credit support and the social security net, the Prime Mantri Jan Dhan Yojana works to promote financial inclusion by guaranteeing bank account access to those who are less fortunate. The Economic Survey 2024–25 highlights that achieving inclusive and sustainable growth in India requires sustained government focus on strengthening social infrastructure. It underscores priority areas such as healthcare, education, and social protection to enhance overall human development.
Demographic Dividend
When the proportion of the working-age population is high and the dependency ratio that is, the percentage of children and the elderly is low, a demographic dividend is said to be taking place.
Potential of the demographic dividend in India
India entered the demographic dividend opportunity window in 2005-06 and will remain there till 2055-56.
This is the time frame that is typically used as the cut-off for the demographic dividend window, when the working age
ratio is equal to or greater than 150% and the dependency ratio is equal to or lower than 66.7%.
With 2031 marking the peak of the working age ratio, the highest working age ratio is expected to occur between 2021 and 2041.
In theory, India could experience a golden age between 2020 and 2040 if the demographic dividend is effectively utilised.
However, having potential does not guarantee that it will materialise. It is an opportunity that, given the correct circumstances, can be taken advantage of.
Challenges ahead
More than one-third of Indian children (35.5%) are stunted, according to the National Family Health Survey (NFHS) 5, which indicates poor health, educational, and career prospects in later life. According to the same survey, 57% of Indian women between the ages of 15 and 49 are anaemic. This is a very concerning and unsettling statistic.
Several Annual Status of Education Reports (ASER) demonstrate the continued low quality of education. As per the Confederation of Indian Industries, only 3% of India’s workforce possesses formal vocational training. Consequently, the country is unlikely to enhance productivity or secure gainful employment for its youth.
Budget after budget, the social sectors health and education in particular have received less attention and funding than practitioners and experts have repeatedly requested and argued for.
Recently, the Indian job market has not been particularly promising. Youth and overall unemployment have reached an all-time high.
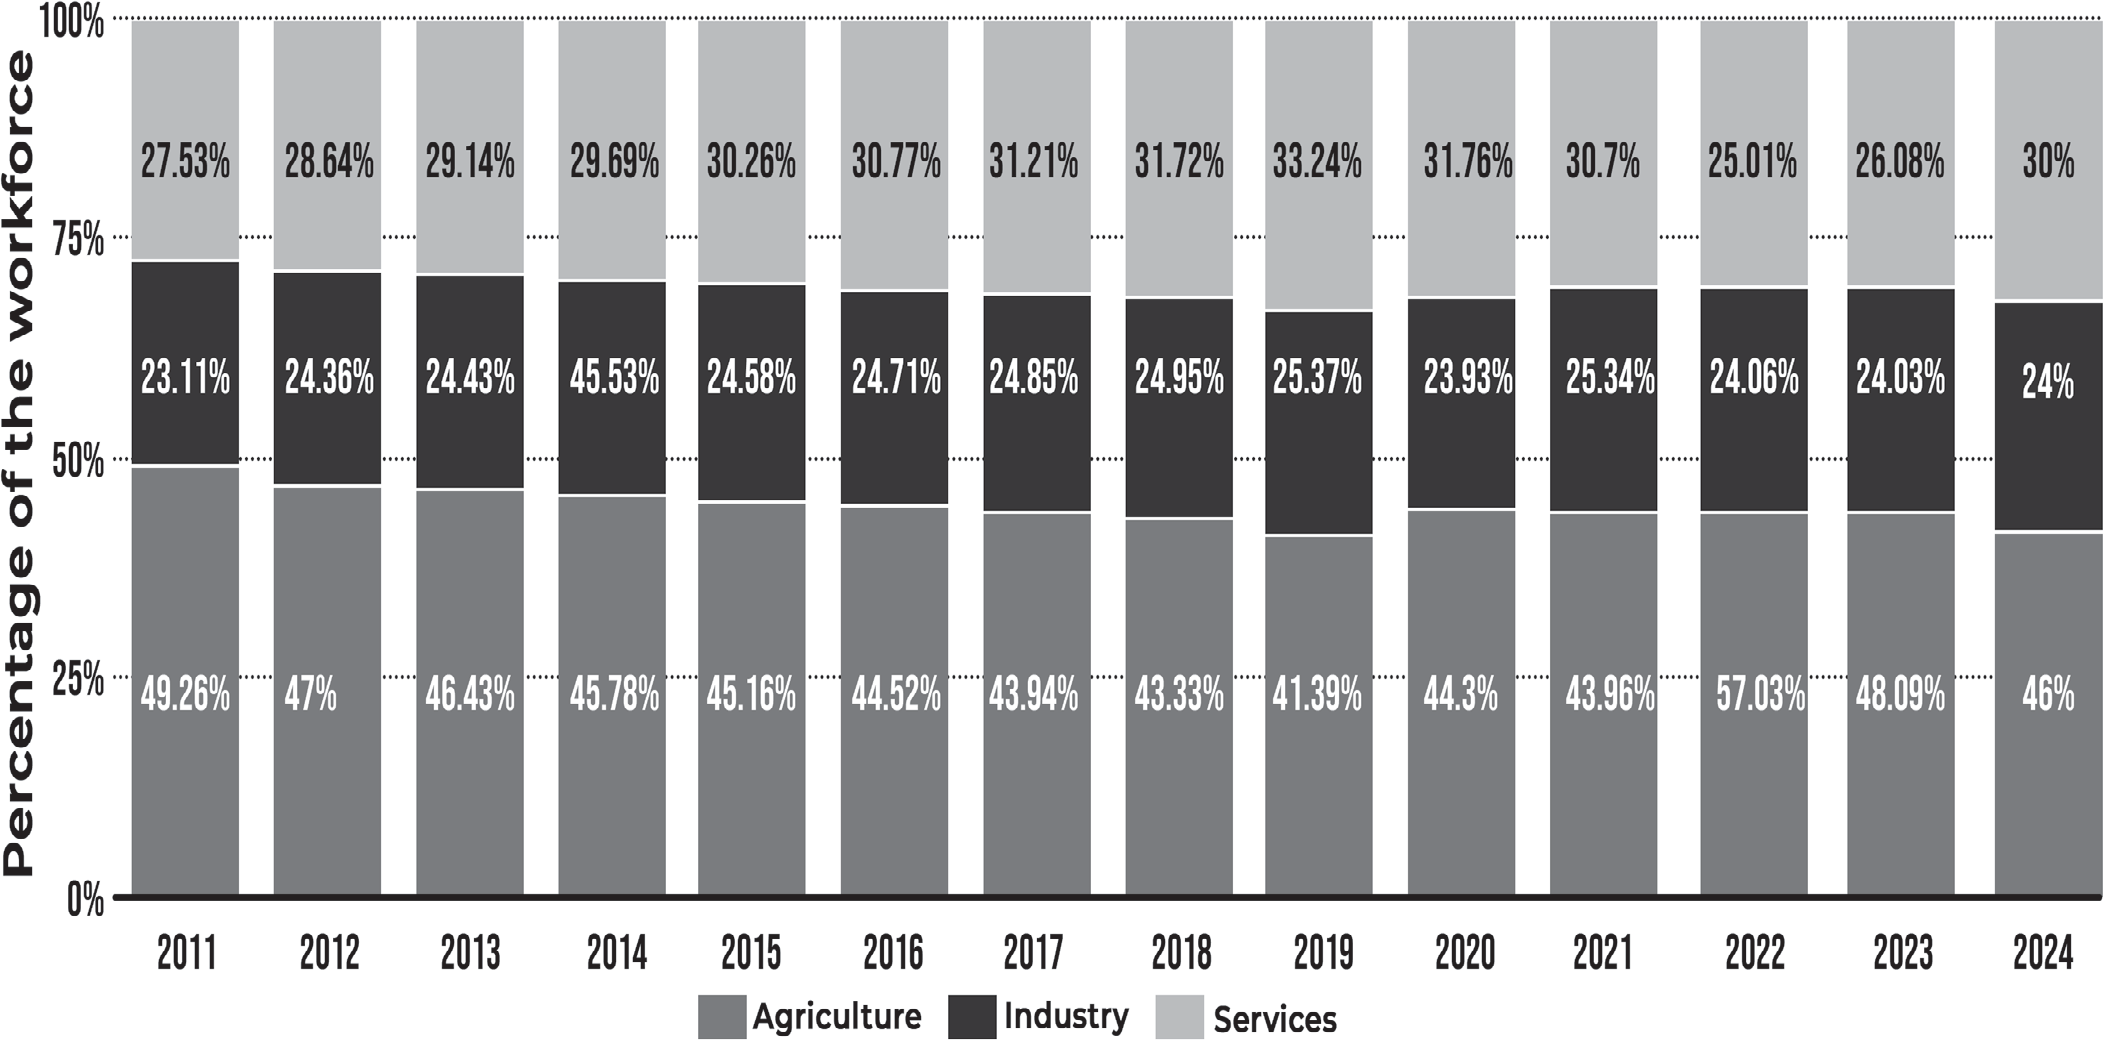
While generally the demographic dividend is expected to result in a migration of workers from the primary to the secondary and tertiary sectors of the economy, but in the last three periodic labour surveys, the percentage of workers employed in agriculture has increased from 43% to 47%, indicating a concerning trend towards retrogression.
By all accounts, the demographic dividend appears to be disappearing. It won’t do to merely pay lip service to the concept of the “demographic dividend” and hope that it materialises because there are many people in our working age group. We must act quickly to correct the situation.
Remedial steps
The ecosystem for skill development needs to be strengthened.
The loss of knowledge brought on by the recent pandemic is one area that requires attention. Their weaker foundation in the disciplines, future productivity, and prospective earnings could all suffer from this loss of learning.
Emphasis on vocational education is necessary. Good vocational training delivered by qualified instructors can
create a youthful and productive labour force as well as give women, people with disabilities, and those living below the poverty line the chance to work for themselves.
India’s employment situation can be significantly improved by the private sector. By assisting technical and industrial institutes, internship programmes, and vocational training centres, it can encourage the development of skills and training.
The population dividend in India presents a chance to stimulate economic expansion. In order to seize this chance, actions must be taken to give the labour force the skills necessary to satisfy the demands of the global economy, to guarantee access to high-quality healthcare and education, and to establish a social safety net. This will assist India in reaching its full economic potential and emerging as a global talent leader.
Inclusive Growth and Issues
INCLUSIVE GROWTH AND ISSUES
Inclusive Growth
The Asian Development Bank claims that inclusive development lacks a universally accepted definition. However, it is generally accepted that the idea refers to “growth coupled with equal opportunities.” Its main goal is to create opportunities and make them available to everyone, not just the privileged.
When all members of a society, regardless of their unique circumstances, equally participate in and contribute to the growth process, this is known as inclusive growth.
The Eleventh Plan document outlined the agenda for inclusive growth, which aimed to achieve both faster and a growth process that guarantees a broad improvement in the quality of life of the people, particularly women, minorities, the poor, SCs/STs, and other backward castes (OBCs), while also pursuing equality of opportunity for all.
Need for Inclusive growth
In order to reduce poverty quickly and sustainably, inclusive growth is essential because it enables people to participate in and gain from economic expansion. This growth ought to be widespread across industries and involve a sizable portion of the labour force.
Extensive growth, which requires expanding input quantities, is necessary for rapid pace and employment. However, for sustainable long-term growth and productive employment, periods of intensive growth, driven by productivity improvements, technological breakthroughs, and innovations, should occur instead of just capacity expansion. This approach emphasizes the importance of both extensive and intensive growth.
Features of Inclusive growth
It emphasises economic growth, which is a vital and essential prerequisite for the decrease of poverty.
It takes a long-term view and considers both the rate and direction of growth.
It focuses on productive employment rather than income redistribution. As a result, both productivity growth and employment growth are being prioritised.
Inclusive Growth isn’t defined in terms of particular goals like creating jobs or distributing income. These are potential outcomes, not specific goals.
Usually, market-driven growth sources drive it, with government intervention serving as a catalyst.
Important Pillars
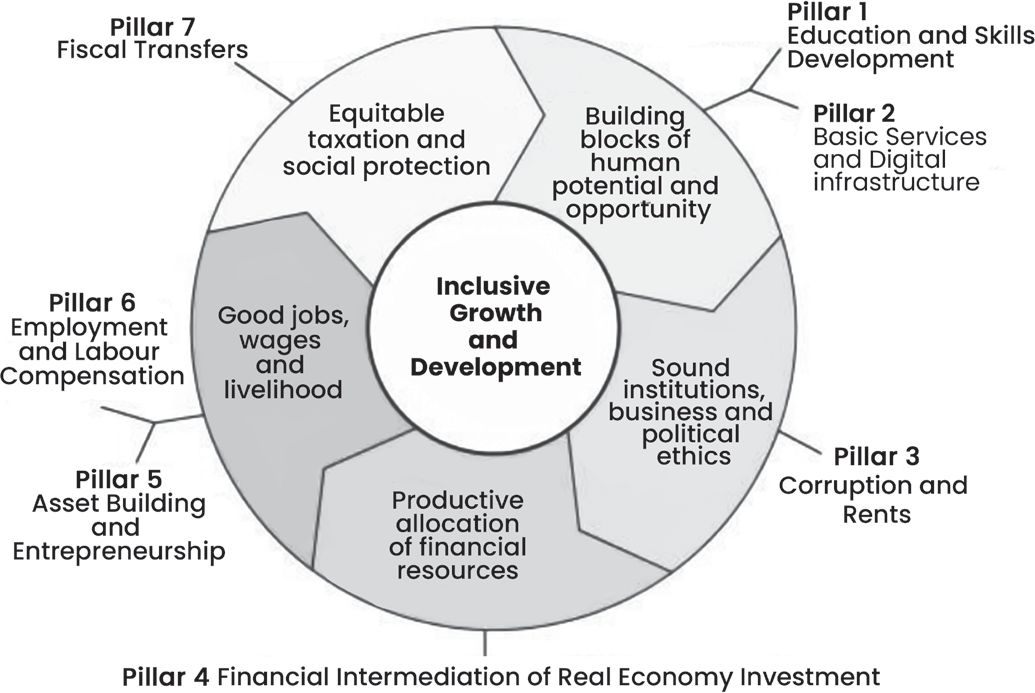

Processes of inclusion
Inclusion occurs through three distinct processes: (i) social inclusion, (ii) economic inclusion, and (iii) political inclusion.
Social Inclusion
Social inclusion is an overarching framework for addressing various social policy issues, including income inequality, skill levels, education, health inequalities, housing affordability, and work-life balance.
Social inclusion promotes more active participation of people living in communities.
Economic Inclusion
Scholars have recently come to understand the relationship between a productive economy and a society that enjoys high levels of participation, connection, and cohesion, as well as the combined impact these factors have on people’s wellbeing.
Policies that guarantee a wide range of opportunities for people to engage in society and the economy are directed by an inclusive economy, which in turn enhances people’s well- being.
Political Inclusion
A democratic and participatory political organization empowers people to raise their voices against injustices and
deprivation. This is done through reservations for various communities like the Scheduled Castes (SCs) and the Scheduled Tribes (STs).
Challenges in Achieving Inclusive Growth in India
Poverty: As per the Global Multidimensional Poverty Index (MPI) 2022, the incidence of poverty fell from 55.1% in 2005-06 to 16.4% in 2019-21 in India but still India has by far the largest number of poor people worldwide at
22.8 crore.
Unemployment: In India, unemployment is still a major issue, with variations seen in various areas and industries. Unemployment rate in India rose to 8.percent in March 2024, according to CMIE's consumer Pyramids Household Survey. India’s employment quality and quantity are low due to illiteracy and over-dependence on agriculture. More than 80% of people without social security work in the unorganised sector. Low job growth is attributed to low investment, low industry capital utilization, and low agriculture growth.
Prevalent Inequality: Oxfam India’s report on India’s inequality reveals that only 5% of Indians own over 60% of the country’s wealth, while the bottom 50% own only 3%. The report, titled “Survival of the Richest: The India story,” also shows that 40% of wealth created between 2012 and 2021 went to just 1% of the population, and only 3% went to the bottom 50%. In India, there were 166 billionaires by 2022 compared to 102 in 2020.
Agriculture Backwardness: Indian agriculture faces backwardness due to age old cultivation methods, over- dependence on monsoons, soil erosion, fragmented land holding, poor seed quality, unreliable irrigation facilities, lack of proper use of manure and fertilizer, reluctance to adopt modern scientific methods, excessive pressure on land, poor credit system, poor marketing, low prices of produce, poor electricity, storage, water, credit, marketing, less mechanization, and inadequate agricultural research.
Gender Divide: In terms of gender parity, India is still ranked 127th out of 146 countries, despite an eight-place increase in the annual Gender Gap Report, 2023.
Regional Disparities: For India, regional disparities are an enormous issue. Regional disparities lead to a system where certain particular groups have greater privileges than others due to factors like the caste system, the wealth and poverty disparity, etc. e.g. At 93.1%, Kerala is the state with the highest level of education, whereas Bihar’s is only 63.82%. Goa’s per capita income in 2018 was Rs 4,67,998, whereas Bihar’s per capita income was only Rs 43,822, or one-tenth of that.
INCLUSIVE GROWTH- POLICY IMPLICATIONS
Agricultural Development
Agriculture development should be given priority. The
recent trend shows that the contribution of the agricultural sector to total GDP has reduced from 44.6 percent to around 18 percent from the year 1958-59 to 2022-23.
On the other hand, the absorption of labour in the agricultural sector has not reduced much during the same period. This emphasises shows that the pace of reduction of contribution to GDP by the agricultural sector is extremely high as compared to the pace of reduction of workforce in the agricultural sector. Hence there is a need to develop the agricultural sector by way of irrigation and water management, credit, research and extension, marketing etc.
Land and water management (including watershed development) are crucial for agriculture development. Development of agro-based industries in rural areas has not only expanded the scope of employment but also reduced the heavy dependence on the agricultural sector.
Rural Non-farm Employment opportunities
All non-agricultural activities, such as mining and quarrying, household and non-household manufacturing, processing, etc., are included in the Rural Non-Farm Sector (RNFS).
The non-farm rural economy is regarded as a successful decentralisation approach for economic activities in rural India, with the goal of preventing uncontrolled migration, bridging the gap between rural and urban areas, creating jobs, lessening inequality, and so forth.
Many issues have been plaguing the industry, including insufficient rural infrastructure (roads, electricity, and communication systems, in particular), a shortage of skilled labour, insufficient access to credit, information and training facilities, etc. Therefore, significant investments along with an appropriate governance structure are required for rural development that is inclusive, sustainable and diversified.
Financial Inclusion
The provision of timely and sufficient credit, along with financial services at a reasonable cost, to underprivileged and low-income populations is known as financial inclusion.
Financial inclusion can help in achieving development goals such as poverty eradication and income equality, food security and sustainable agriculture, supporting infrastructure and industries, better healthcare, encouraging increased consumption and savings, reduction in unemployment and sustainable economic growth.
Financial inclusion has been ensured by the government and the central bank by way of implementation of Jan Dhan Yojana, easier credit facilities, simpler KYC norms, use of information and technology, expansion of electronic benefit transfer system, business correspondence model, bank branch and ATM expansion, financial literacy and credit counselling, etc.
However, a sizable portion of Indians still don't have access
to formal banking. Rapid urbanisation is increasing the rate of urban poor who are devoid of the most basic banking facilities. Also, people working in the informal sector still remain outside the rings of the formal financial system. Thus, much needs to be done in the financial inclusion space in order to ensure inclusive growth.
Public Investment
Public funding for rural development has drastically decreased. As a result, India’s agricultural growth slowed. Prioritising public investment in physical (irrigation, roads, communications, transportation, electricity, etc.) and human infrastructure (health, education, etc.) is regarded as one of the most important factors contributing to inclusive growth.
Public Finance and Tax Policies
Taxes provide the funding for basic welfare and social security programmes, shielding the impoverished from unforeseen dangers and keeping them from reverting to poverty in hard times. Because of this, progressive tax policies are essential to promoting an equitable distribution of wealth and income.
Development of Institutions
Development of new institutions and strengthening the present institutions of service delivery are important. Institutions seem to be responsive when women are empowered. Decentralisation in terms of strengthening Panchayati Raj Institutions (PRIs) has to be improved in order to have better delivery systems.
Social Protection
Through redistribution, the social protection system can significantly reduce poverty and inequality. This also helps to give the platform to the excluded section of the society.
Most important programmes are the Public Distribution System (direct food subsidy), Indira Awas Yojana (Housing for poor) and direct cash transfer through programmes like the old age pension scheme, widow pension scheme, disability pension scheme, national family benefit schemes, etc.
Policy making and policy-shaping for Inclusive Growth
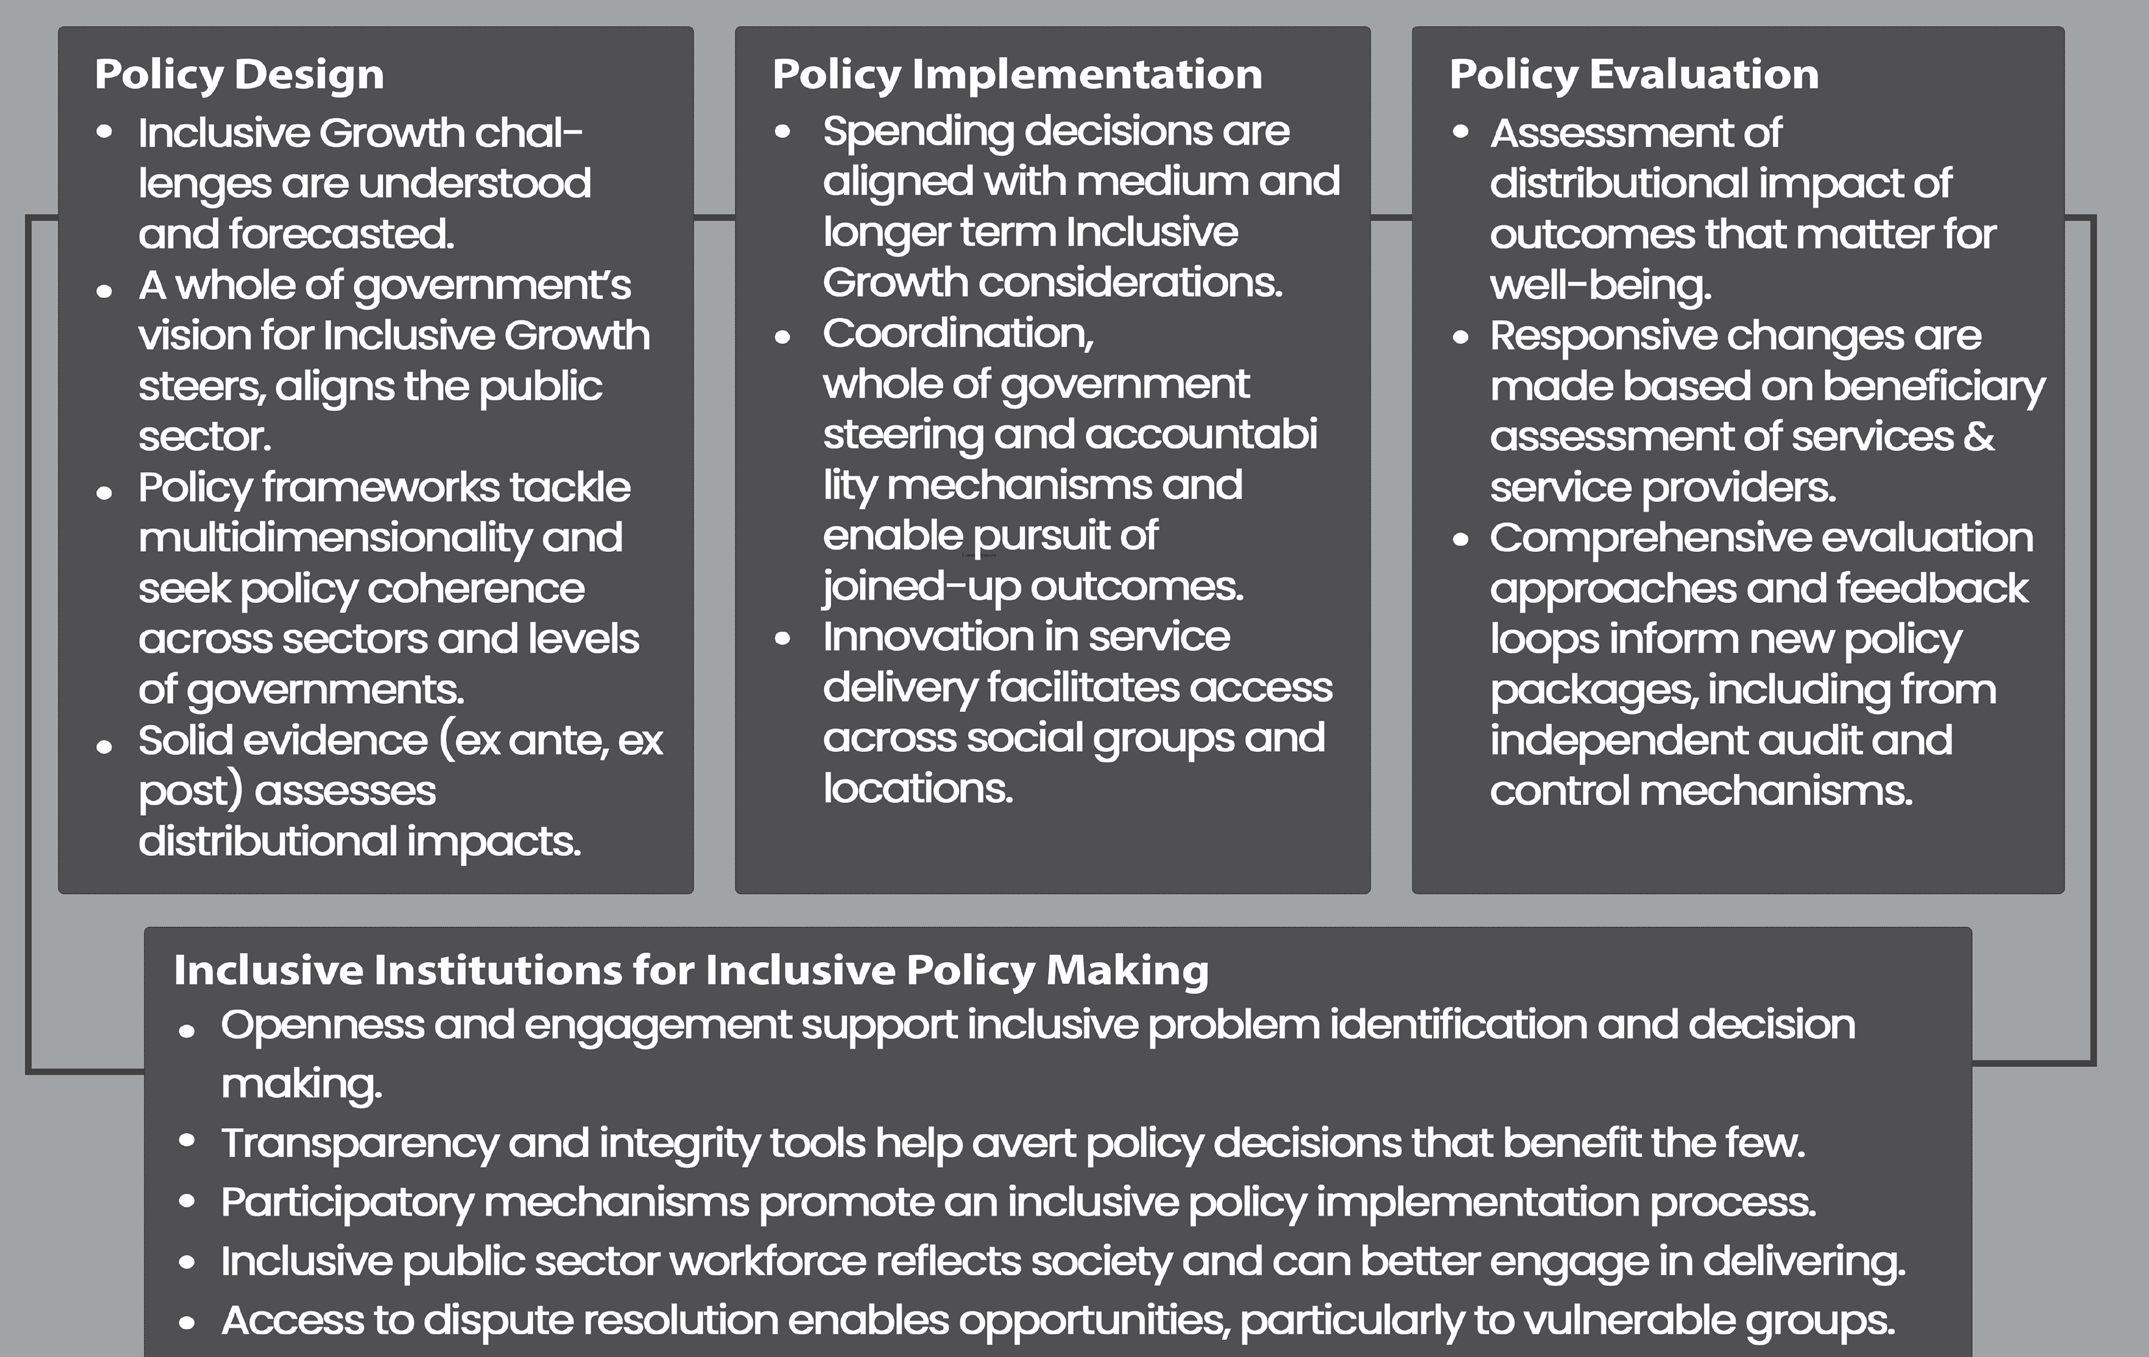
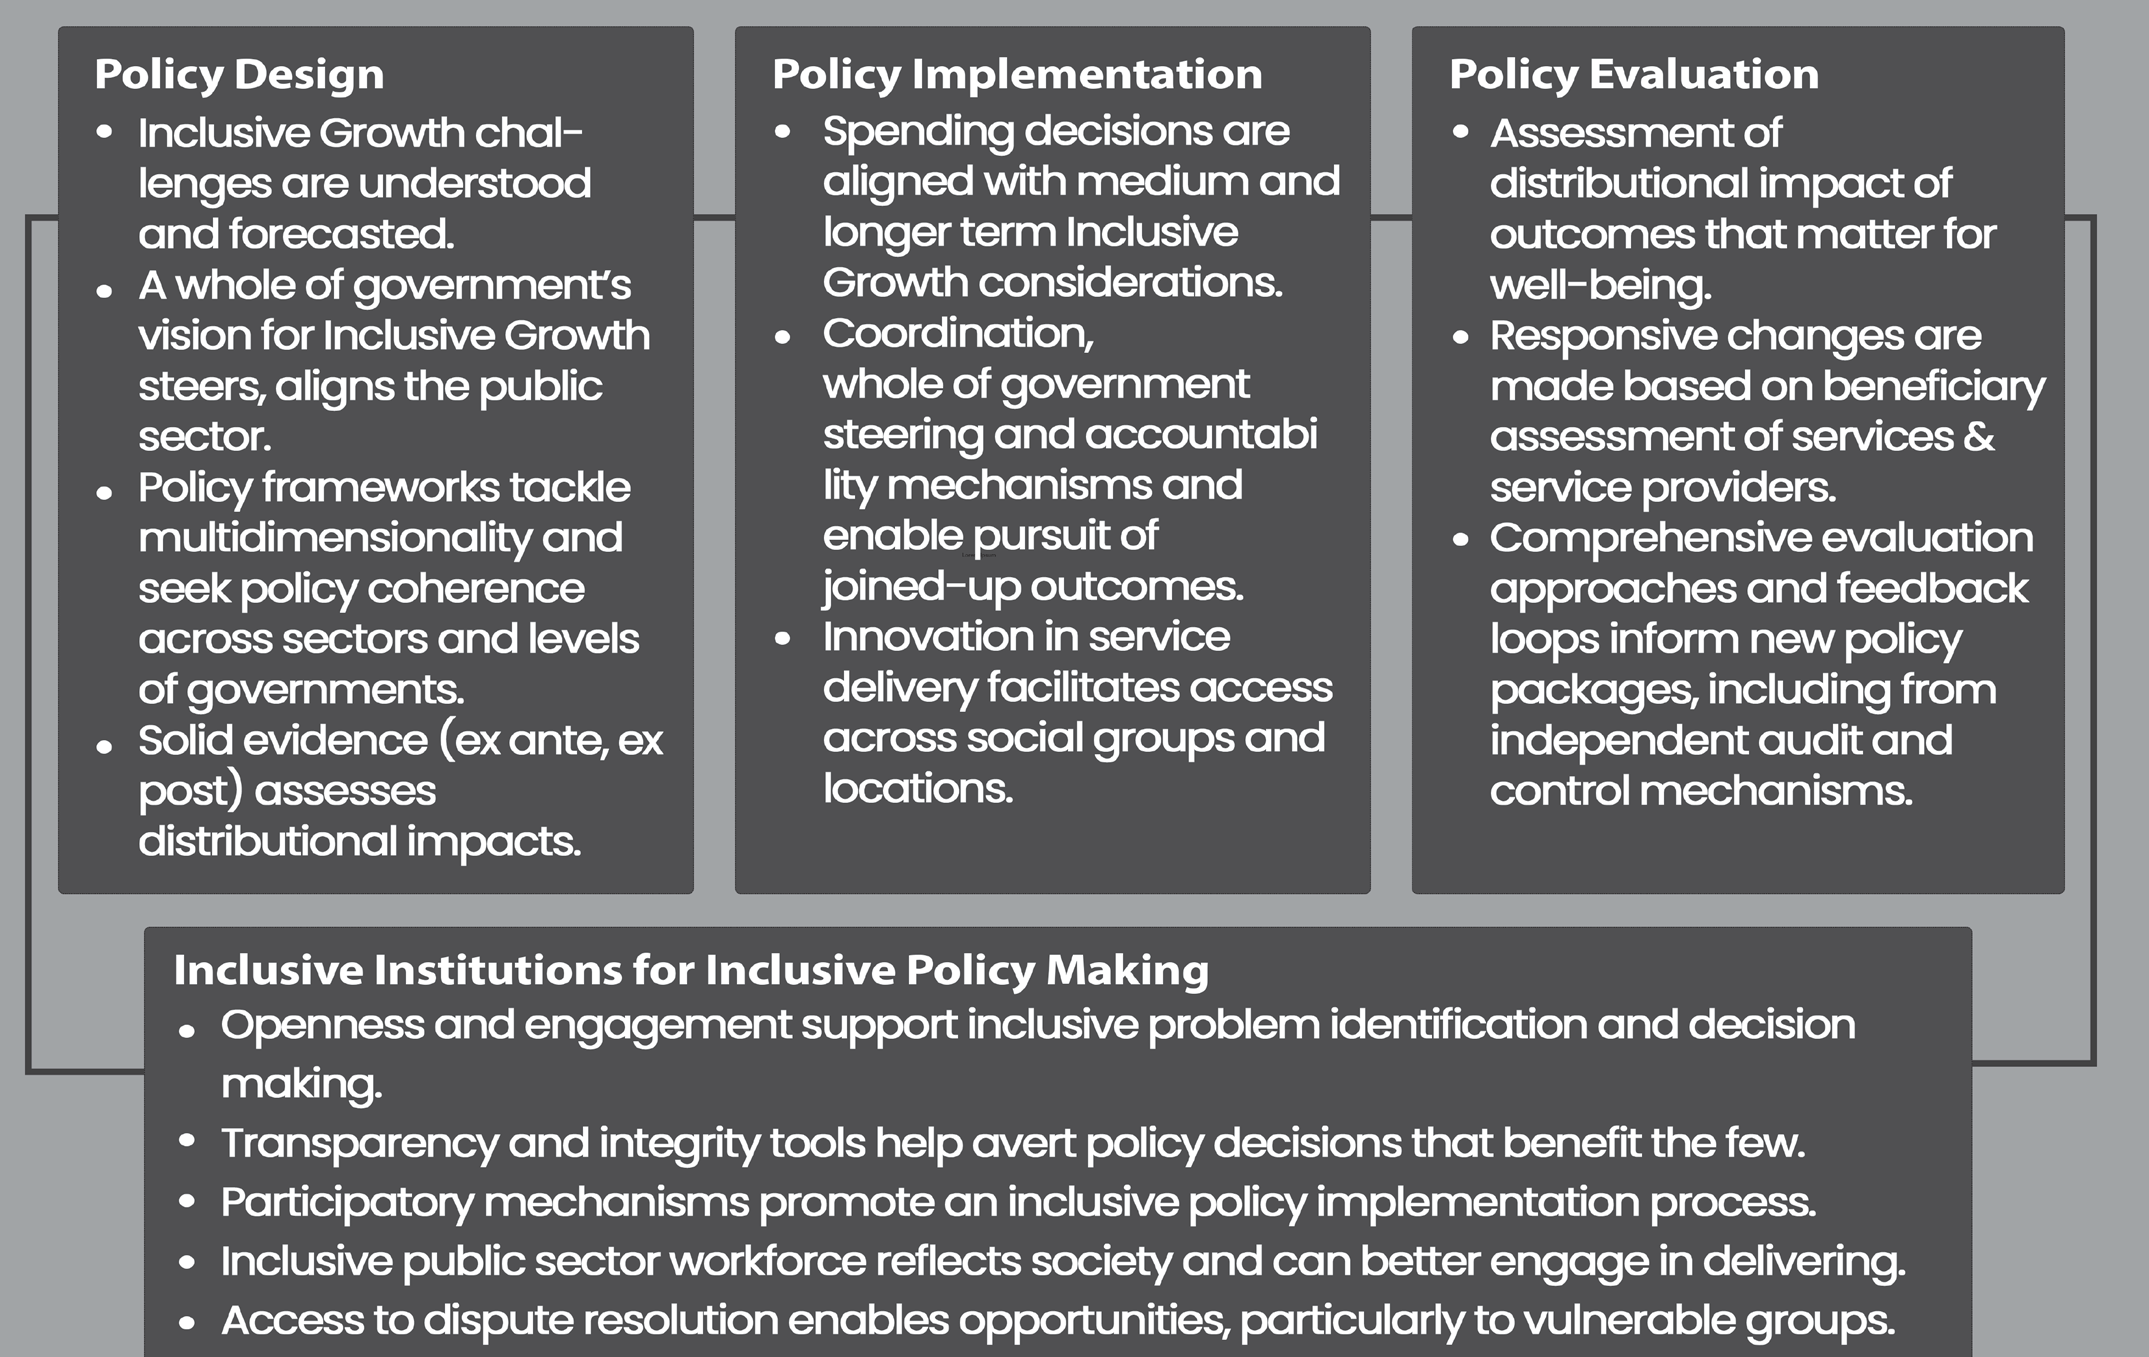
Inclusive growth is crucial for achieving equity objectives and sustaining growth momentum. Rural areas often focus on agriculture, but the unorganised nonfarm sector is increasingly absorbing the labor force. Investment in infrastructure, linking to markets, and easier access to assets and skills can lead to growth in this sector. Incorporating appropriate technology, skills, and credit, especially start-up capital, can expand this segment for self-sustaining employment and wealth generation, while fostering a culture of creativity and competitive industry. Entrepreneurial development should be encouraged through a
competitive environment and easy access to finance for new projects. Recognizing the poor as resilient entrepreneurs and value-conscious consumers can open up a whole world of opportunity.
Unemployment
UNEMPLOYMENT
A person who is fit and willing to work at the going wage rate but is not employed is said to be unemployed. It is a state of involuntary, as opposed to voluntary inactivity.
Involuntary unemployment occurs when an individual is not paid despite having the ability and desire to work for pay. It is the condition in which an individual is separated from paid employment. The inability to work is what defines unemployment.
Cyclical unemployment, seasonal unemployment, structural unemployment, frictional unemployment, disguised unemployment, and underemployment are additional classifications for involuntary unemployment.
Every nation’s population is divided into two categories: the labour force and the non-labour force.
The term “labour force” refers to both those who are actively participating in the economy and those who are neither actively seeking nor offering themselves for employment at the going rate. It indicates that both employed and unemployed individuals make up the labour force.
Non-Labor Force is the portion of the population that does not make up the labour force. It encompasses everyone who is not employed and who is not actively looking for work.
Causes of Unemployment
• Caste System: The caste system in India significantly contributes to unemployment, as certain jobs are restricted to specific castes in specific locations, often favouring community members over those with the necessary skills, resulting in a high unemployment rate.
• Inadequate Economic Growth: India’s underdevel-oped economy is hindered by slow growth, which fails to provide sufficient unemployment opportunities for the growing population, leading to a higher unemployment rate and insufficient employment levels across the country.
• Lack of Skills: The working population’s low educational attainment or lack of vocational skills.
• Sectors requiring a lot of labour are being negatively impacted by the decline in private investment, especially since demonetisation.
• Challenges in Transitioning between Sectors: Transitioning between the three sectors is challenging due to the low productivity in the agriculture sector and the dearth of alternative opportunities for agricultural workers.
• Increase in Population Rate: India’s population growth is not matched by economic growth, leading to widespread unemployment.
Decrease in Small-Scale/ Cottage Industries: The decline of small-scale and cottage industries in India is attributed to the lack of economies of scale mass production, which outweighs the demand for handcrafted goods. This has led to artisans becoming unemployed.
Low Rate of Savings and Investments: India’s scarcity of capital results in low savings and investment, limiting job creation. Higher investment rates could stimulate growth, especially in rural areas and 2 & 3 tier cities. Furthermore, there is a dearth of investment in 2 and 3 cities as well as rural areas, which highlights unrealized job potential.
Ineffective Economic Planning: Ineffective economic planning is also a concern, as there is a significant gap between labour supply and demand, causing competition for jobs. Higher investment rates could stimulate growth in these areas.
Challenges in Small Business Viability: Due to cost and compliance overruns, legal complexity, inadequate state support, and poor market, financial and infrastructure ties to small businesses render these ventures unfeasible.
Insufficient Infrastructure and Investment: Insufficient expansion of infrastructure and insufficient investments in the manufacturing sector limit the secondary sector’s employment prospects.
Social Barriers to Women's Employment : Regressive social norms that deter women from taking/continuing employment.
TYPES OF UNEMPLOYMENT
Cyclical Unemployment
Demand-deficient or cyclical unemployment happens when there is a shortage of workers in the economy. When the overall demand for goods and services declines across the economy, unemployment rises. The primary times for cyclical unemployment are during recessions or depressions. Since unemployment varies with the trade cycle, this type of unemployment is most frequently referred to as cyclical unemployment.
Seasonal Unemploymsent
This kind of unemployment is called seasonal unemployment because it happens during a specific period of the year or season. The industries that experience seasonal unemployment the most include tourism, hotels, catering, and agriculture.
Structural Unemployment
When a person’s qualifications are insufficient to fulfil their job responsibilities, it results in structural unemployment. It results from a long-term shift in demand patterns that modifies the fundamental components of the economy. Thus, those with outdated skills are unable to find employment under the new economic system and continued to be unemployed.
Frictional Unemployment
When someone is out of work and looking for work for various reasons such as wanting a better job, getting fired from their current job, or quitting their current job voluntarily they are said to be experiencing frictional unemployment. Before starting the next job, a person usually needs to wait a while. He is frictionally unemployed during this time.
Disguised Unemployment
Disguised unemployment refers to unemployment that is not apparent. It happens when someone is obviously working, but they don’t add anything to the final product. This occurs when family workers, particularly those in agriculture, work the land but do not produce at the required level. Their marginal productivity is zero.
Underemployment
It is a situation where an individual is working but not in the capacity that they would like to be in terms of pay, hours worked, or degree of expertise and experience. Despite not being officially unemployed, underemployed people frequently compete for open positions.
Two categories of underemployment exist: When someone works fewer hours than required for a full-time job in their chosen field, it’s known as visible underemployment. They might work two or more part-time jobs in order to make ends meet because of the shortened hours.
Invisible underemployment is the second kind of underemployment. It describes the state of employment where a person cannot find employment in their field of choice. As a result, they typically work in jobs that pay significantly less than their usual wage and are not in line with their skill set.
Causes of Underemployment
Underemployment is a feature of the time during and after a recession when businesses reduce staff and terminate qualified employees.
Technology-related changes to the job market are another factor contributing to underemployment. Retrenched employees may choose to retrain or retire from the workforce as job descriptions evolve or become more automated. Underemployment is typically a risk for those without the tools or resources to retrain themselves.
Measurement of unemployment
The percentage of the labour force that is unemployed is known as the unemployment rate. The calculation is as follows
(Unemployed Workers/Total Labour Force)
100=Unemployment rate
The National Sample Survey Organisation compiles the most thorough and trustworthy data on employment and unemployment in India.
The National Sample Survey Organization (NSSO) provides three different estimates of employment and unemployment based on different approaches / reference periods used to classify an individual’s activity status.
The usual status approach is used, with a 365-day reference period preceding the survey date. Since everyone who is found to be normally unemployed in the reference year is counted as unemployed, the usual status unemployment rate, which is a person rate, indicates chronic unemployment.
The present weekly status approach uses a reference period that is seven days ahead of the survey date.
The current daily status approach uses each day of the seven days preceding the survey date as a reference period.
Periodic Labour Force Survey (PLFS)
Employment and Unemployment Surveys were traditionally conducted by the NSSO (National Sample Survey Office) as a component of its National Sample Surveys. These are surveys on employment and unemployment conducted quinquennially, or once every five years. The main source of information on the nation’s employment and unemployment conditions was these surveys.
The National Sample Survey Office (NSSO) replaced the previous five-year surveys with the Periodic Labour Force Survey (PLFS) in April 2017 due to the importance of having labour force data available at more frequent time intervals.
PLFS aims to accomplish two main goals
To estimate, for urban areas only, the major employment and unemployment indicators (i.e., the worker population ratio, labour force participation rate, and unemployment rate) within a three-month timeframe in the “Current Weekly Status” (CWS).
To annually estimate the indicators of employment and unemployment in “Usual Status” (pass) and CWS in both rural and urban areas.
Key employment and unemployment indicators, such as the labour force participation rate (LFPR), worker population ratio (WPR), unemployment rate (UR), etc., are estimated by the Periodic Labour Force Survey (PLFS). The following definitions apply to both these indicators and “Current Weekly Status”:
The percentage of the population that is either employed, looking for work, or available for work is known as the labour force participation rate, or LFPR.
Worker Population Ratio (WPR): WPR is the proportion of the population that is employed.
Unemployment rate (UR): The percentage of people in the labour force who are unemployed is known as the unemployment rate, or UR.
Current Weekly Status (CWS): The person’s current weekly status (CWS) is the activity status as assessed using the last seven days as a reference period prior to the survey date.
Quarterly Employment Survey (QES)
Launched in April 2021, the QES, a component of the All India Quarterly Establishment-based Employment Survey (AQEES), aims to collect vital data regarding employment and associated variables in the organised sector of the economy.
Goal: The QES is an establishment-based survey that offers data on employment changes in businesses with ten or more employees within the nine economy-specific sectors that have been chosen.
Nine Sectors covered in QES-Manufacturing, Construction, Trade, Transportation, Education, Health, Accommodation & Restaurants, IT/BPO and Financial Service activities.
Key Findings of QES 2022
In contrast to the 3.14 crore employed in the third quarter, an estimated 3.18 crore workers were employed in 5.31 lakh establishments during the fourth round.

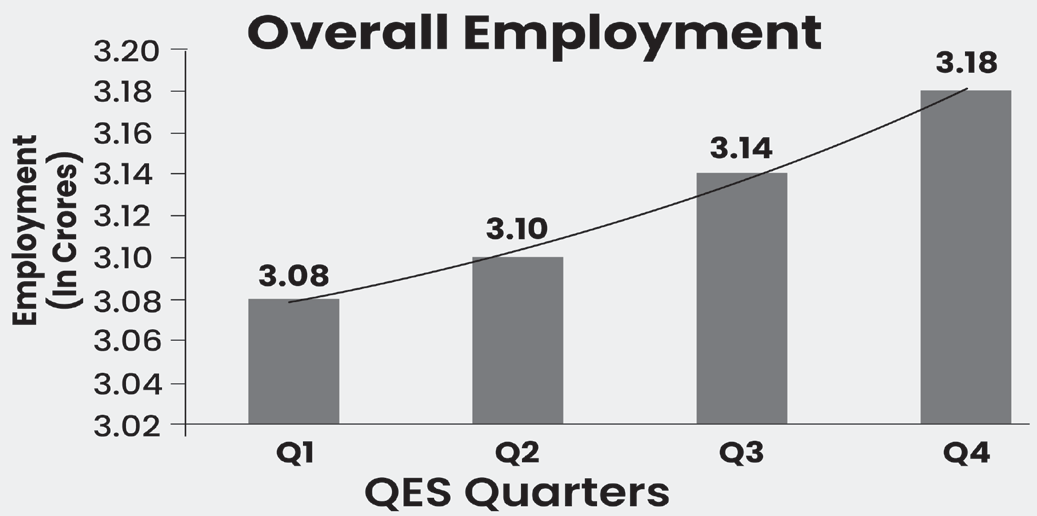
The industry with the highest percentage of workers (38.5%) is manufacturing, followed by the education, health and IT/
BPO sectors (21.7%, 12%, and 10.6%, respectively). Considering the size of the businesses (i.e., the number of employees), 80 percent of the businesses employed between
10 and 99 people. If we limit our analysis to businesses employing ten people or more, this percentage rises to 88%. Roughly 12% of the businesses said they employed fewer than ten people.
Just 1.4% of the businesses stated that they employed 500 people or more. The majority of these sizable businesses were in the IT/BPO and healthcare sectors.
The percentage of female employees increased slightly from 31.6% in the third quarter to 31.8% in the fourth quarter report. However, women made up about 52% of the workforce in the health sector; the corresponding figures were 44%, 41%, and 36% in the education, financial services, and IT/BPO sectors. It is notable that among self-employed individuals in the Financial Services industry, women greatly outnumber men.
Employment statistics
As per the WEF’s Future of Jobs Report 2025, India will effectively utilize its demographic dividend as it will generate nearly 66% of new workforce in next year and will emerge as prime source of the growth. It will lead the women participation in economy and reduce the gender inequality.
There is a great surge in employment level in India now it becomes 64.33 crore in 2023-24 which was previously observed as 16.83 crore in 2017-18. Another milestone is achieved in unemployment rate as it declines to 3.2% in 2023–24 from the level of 6.0% in 2017–18. In the same period
1.56 crore women have participated in Indian economy as new workforce.
Corrective Action for Unemployment
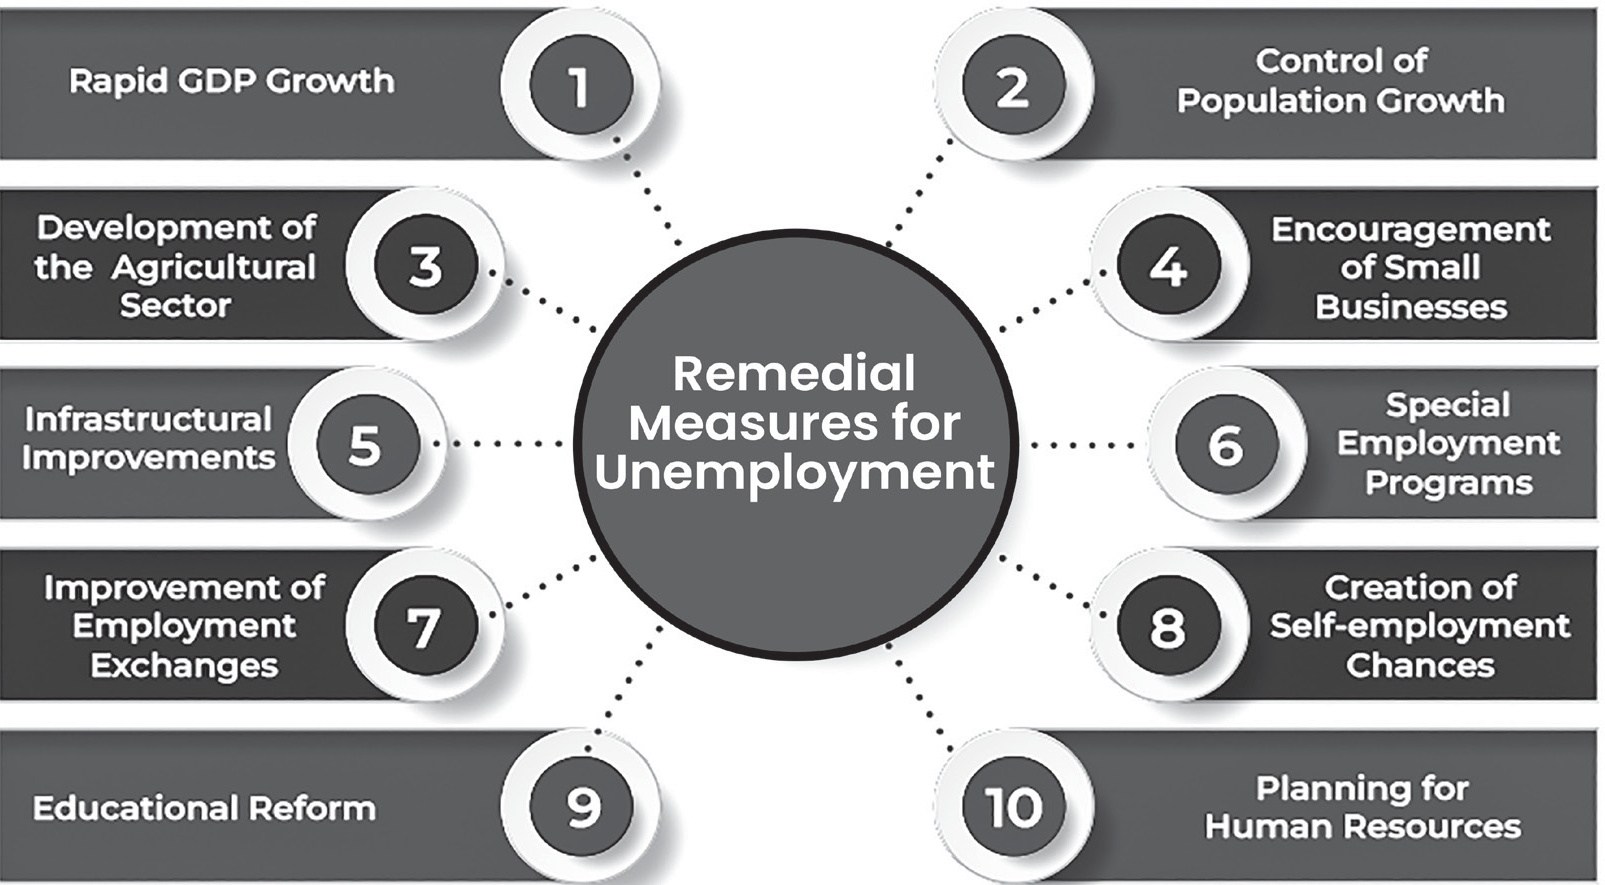
• Quick GDP Growth: The whole employment problem can be solved by faster growth. GDP growth rates between 8% and 9% over the next ten years are needed to dramatically improve the employment situation in the nation.
• Control of Population Growth: To guarantee that there are enough jobs available for everyone who wants to work,
population growth must be reined in. As a result, it’s critical to put into practice a meaningful and effective population control strategy, like family planning programmes, etc.
• Growth of the Agricultural Sector: A significant percentage of the labour force already in existence needs to have their standard of living raised and labour productivity increased. This can only be achieved by growing the agriculture sector. A revolution in agriculture must be brought about by better practices, larger irrigation systems, changed land use laws, and more public funding.
• Encouragement of Small Businesses: A range of initiatives are needed to support the small business sector, such as flexible financing, technical assistance, raw material supply, infrastructure upgrades and product marketing.
• Infrastructure Improvements: The expansion of the economy as a whole depends on the infrastructure, which includes the roads, irrigation systems, electricity, and other utilities. Both the industrial and agricultural sectors can function to their fullest capacity with improved infrastructure. There will be more work opportunities as a result.
• Special Employment Programmes: Establishing programmes aimed at providing paid work or self- employment is crucial.
• Enhancement of Employment Exchanges: The
employment exchanges, spread across the country, are a great resource for connecting job searchers with possible jobs. These job exchanges ought to function more smoothly.
Creation of Opportunities for Self-employment: The government should provide a range of services, such as financial aid, skill development, supply availability, and product marketing, in order to boost the number of opportunities for self-employment.
Reforming education would entail making the current system more extensive and incorporating apprenticeships or long-term training. In order to support the educated unemployed, educational institutions must diversify and provide specialised training or apprenticeship programmes to improve the skills of the unemployed. The Pradhan Mantri Kaushal Vikas Yojana, popularly known as Skill India, was introduced by the Indian government on July 16, 2015, with the goal of developing and standardising skills. Trainees who successfully complete the program’s training and assessment requirements are awarded money and a government certification, which will aid them in finding work and a brighter future.
Organising Human Resources: It is crucial to project the future demand for educated labour and base admissions decisions for different professional programmes on those projections. Consequently, the market will not have an excess of educated labourers.
India: Distribution of the workforce across economic sectors from 2011 to 2023

Formal and Informal Sector
• Formal Sector: In the formal sector, labour conditions are predetermined and there is a written contract between the employer and the employee.
• Informal Sector: Any unincorporated private businesses owned by people or families that are engaged in the production and sale of goods and services through partnerships or proprietary agreements are categorised as informal.
In Indian documentation there is no mention of the informal sector. Furthermore, the National Accounts Statistics (NAS) do not make use of it. In fact, NAS uses an organized and unorganized sector (which is a subset of the informal sector).
Unorganised Sector
A production or service-oriented business owned by an individual or a self-employed worker (a person who does not work for an employer and engages in unorganised sector employment earning an income below a threshold or owning land below a notified limit) is classified as the unorganised sector. If workers are employed, the total number of workers cannot exceed 10.
Over 90% of the labour force that contributes to roughly 50% of the GDP are employed in the unorganised or informal sector.
Organized Sector
An organised sector is defined as one that is officially recognised by the government. People can be guaranteed employment in this industry, and the terms of employment are regular and set.
Challenges Related to Informal Sector in India
The bulk of informal participants are women, but they also receive the fewest benefits, have fewer stable incomes and are less likely to have a robust social safety net.
By definition, informal employment does not have a written contract, paid time off, or attention to working conditions. As a result, it does not provide minimum wages. The 2019 Wage Code’s scope and effectiveness for the unorganised sector are still constrained. A job is exempt from the minimum wage requirement if a state government decides not to include it in a particular industry.
Since the businesses in the informal economy are not subject to direct regulation, they usually avoid paying one or more taxes by hiding their earnings and out-of-pocket expenses from the government. Since a sizable section of the economy is not subject to taxes, this presents an issue for the government.
The lack of official statistics regarding the actual state of the economy makes it challenging for the government to create policies that will have an impact on both the informal sector and the economy as a whole.
Workers in the unorganised sector were far more likely to be impoverished than those in the organised sector. Their lives are in danger due to poor nutrition intake brought on by low salaries and health issues.
Casualization of Workforce
The shift to a workplace with a higher percentage of temporary employees than permanent employees is known as casualization. The forces of supply and demand are primarily to blame. Furthermore, in the lack of full-time, permanent employment, people are choosing to work on a contract basis. Casualization has numerous social ramifications that affect both society and workers.
Cause of Casualization of Workforce
The reason why individuals begin working as casual workers is because there are insufficient opportunities in the organised sector. Companies hire more casual workers because of the flexibility in terms of working conditions and the lack of special labour law enforcement, among other factors. Employers contend that in order to provide them with the flexibility they require, certain working agreements and contracts are required. In the case of education, for example, state governments are hiring temporary teachers rather than permanent ones in government schools due to a lack of budgetary support. This is another way that casualization is encouraged.
Advantage of Casualization of Workforce
There is a great deal of labour flexibility, as there is the potential to scale up or down the workforce based on need.
Effective use of the funds and expenses. It can cut costs by only employing temporary workers when necessary.
It could occasionally be interpreted as a chance for temporary workers to “transition to permanent employment.”
Disadvantage of Casualization of Workforce
Many workers who were hired on a temporary basis are now at risk of losing their jobs as a result of casualization.
It is the decrease in full-time or part-time workers and the rise in temporary workers.
The lack of benefits like yearly, sick, and career leave can be extremely stressful for staff members.
Lack of a steady workforce increases the likelihood that the company will fail.
Because they won’t have access to internal promotions or professional development, casual employees may have low employee satisfaction.
What Should be the Way Forward?
To bring informal businesses and their workers into the formal economy, regulations governing informal business conduct must be loosened.
Informal workers can be brought together in a self-help group to address issues related to their working conditions and promote self-sufficiency.
To help policymakers make well-informed decisions, a thorough statistical base covering a wide range of aspects of the informal economy is necessary as part of the National Data System.
Informal employees’ grievances ought to be acknowledged and settled on a regular basis via an open, legally mandated process.
Although equal pay for equal work is mandated by state policy of the Indian constitution of the Indian constitution women who work as farm labourers usually make less money than their male counterparts. This DPSP should be strengthened and implemented by the government with the necessary legislative backing.
Jobless Growth
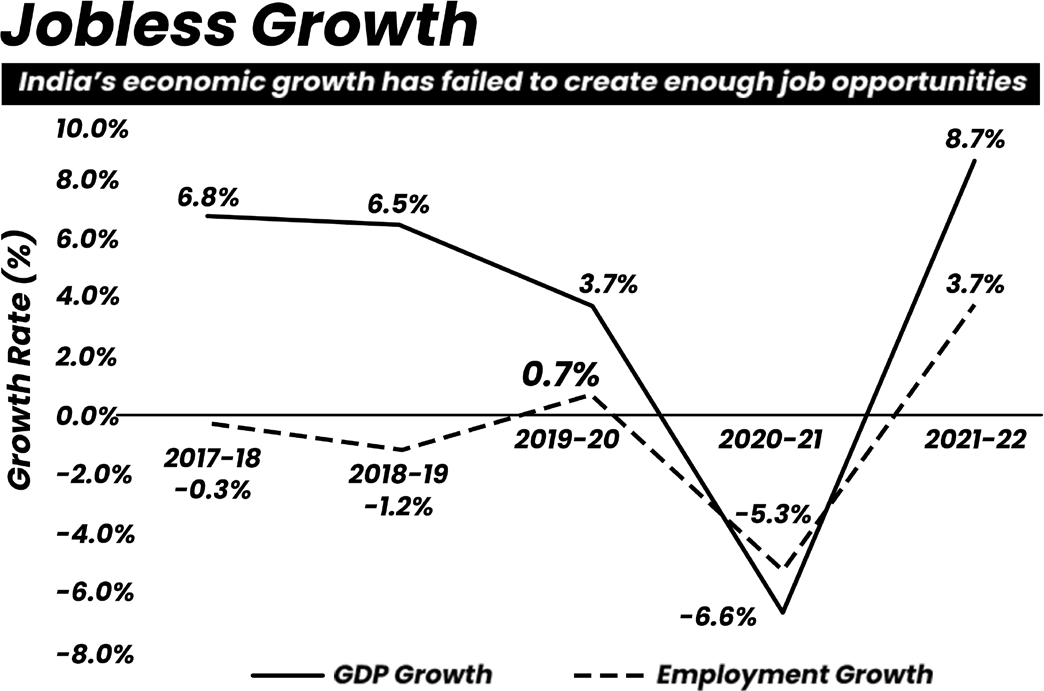
Economic growth is frequently associated with increased employment. An expanding economy means more options for people to earn a living.
When the economy grows but unemployment stays persistently high, this is referred to as jobless growth. This means that, while the economy is expanding, more jobs are not being created as a result. This often occurs when a big number of individuals lose their employment during a recession and are unable to find new work when the economy improves.
India’s job growth has slowed from 3% per year in the 1970s to 1% per year in the last three decades, with employment elasticity falling from 0.4 in the 1990s to less than 0.1 today. This has led to India’s jobless growth. India’s employment elasticity is very nearly 0.1 (i.e. it is inelastic) and the country adds less than 2 million jobs annually. If the economy continues to grow without addressing employment elasticity, the jobs crisis is likely to intensify.
Factors leading to Jobless Growth
• India has struggled to create enough jobs in the manufacturing and services sector, leading to a decline in the manufacturing sector’s share of employment. The manufacturing sector, which employed 51 million Indians in 2016-17, has been capital-intensive and limited to skilled professionals.
India’s poor education system has resulted in graduates with limited skills, leading to disguised unemployment.
India’s economy has grown mostly through the services sector, where the majority of jobs are in unofficial industries like domestic help and small-scale retailing.
The adoption of new technologies like AI and automation is decreasing demand for manpower, but some economists worry it may worsen the jobless growth scenario.
The government’s efforts to generate jobs are hindered by legacy issues such as poor infrastructure, complex rules, skill deficiencies, and hidden costs. A growing number of women are choosing to work unpaid at home, which is traditionally the domain of Indian families’ female members only.
Challenges
India’s youth population, half under 30, is expected to age in the coming decades, necessitating a significant number of jobs.
However, the youth unemployment rate is higher than the overall rate, posing social unrest.
To sustain growth and attract global investments, India needs a trained workforce.
Growth without jobs can result in lower productivity as workers give up and leave the workforce.
High unemployment levels can also increase social spending on unemployment benefits and safety net programs, putting pressure on government budgets. Consequently, in order to secure a sustainable and prosperous future, India must address these issues.
Steps taken by the Government
The National Education Policy, 2020 aims to build character and create well-rounded individuals with 21st-century skills.
Sector Skills Councils were established from 2009-10, bringing together Industrial Training Institutes (ITIs) and polytechnics to increase apprenticeships. In the 2024 budget speech the Union Government claimed that 14 million people were trained under the Skill India Mission, which included upskilling and reskilling 5.4 million.
The National Skill Development Corporation (NSDC) is responsible for implementing the Pradhan Mantri Kaushal Vikas Yojana (PMKVY), which is the flagship programme of the Ministry of Skill Development and Entrepreneurship. The government covers the costs of training and assessments under PMKVY, and Training Providers (TPs) receive payouts.
Steps Required
The private sector in India needs greater support, particularly for start-ups, through subsidies and tax rebates.
Strengthening commercial dispute redressal mechanisms can attract investment into the industrial sector.
A more focused approach to skilling and educating the youth
is needed, focusing on 21st-century skills like 5G technology and digital marketing.
The government should boost social security nets, tackle inefficiencies like corruption and maladministration, and avoid sudden reforms.
Educational institutions should instill an entrepreneurial mindset in students, ensuring they become job givers rather than job seekers.
Local governments and community organizations should be involved in skilling plans, creating a database of individuals seeking employment or enterprise support and developing detailed micro credit plans for each household. This will help solve the unemployment crisis and ensure the best utilization of resources.
The Indian economy faces a significant challenge in jobless growth, which can be addressed by boosting manufacturing through infrastructure development, removing red tape, and reviving investor sentiment, which is crucial for absorbing the agriculture workforce and maximizing the nation’s demographic dividend.
What is ‘Fixed-Term Employment’?
A fixed-term employment contract is one where an employer hires a worker for a predetermined amount of time. Usually, it is for a year, but depending on the situation, it may be extended after the term ends. The payout or payment is predetermined under a fixed-term employment contract and is not changed until the term ends. These contracts, however, cannot be granted for regular employment.
Both parties have duly signed the contract, which has a set duration. Professionals are occasionally employed on a contract basis by IT companies to finish a particular project. They might eventually be integrated into the business after the project is finished.
Just like any other contract, a fixed-term employment contract has a clause allowing the employers to end it early for specific reasons prior to the due date. One of the main causes might be the person’s non-performance or their proven fraud, which was discovered during an investigation. Employees with fixed-term agreements typically receive fewer benefits, such as provident fund contributions, than those who work for the company directly.
It falls under the purview of the Industrial Employment Act (Standing Orders), 1946, which gives businesses in the apparel manufacturing sector the freedom to hire workers in response to the sector’s cyclical demand.
Amendments in the Industrial Employment (Standing Orders) Central (Amendments) Rules, 2018 regarding fixed term employment
• The amendment adds a new heading to the 11 classification of labourers: “Fixed term employment.”
This rule prevents the employer from converting any of his permanent workmen into fixed term employment. This has been implemented to stop management from taking advantage of the permanent employees.
It guarantees the right to statutory benefits for fixed-term employees.
Labour Laws in India
Labour Laws in India
Legal rights and limitations on working people and their organisations is known as labour law, also referred to as employment law. These laws apply to a number of disputes involving trade unions, employers, and employees. It establishes the duties and entitlements of employees, union members, and employers in the workplace.
Labour laws in India
Following India’s independence, the country’s labour laws changed. A partnership between capital and labour was demanded, and it was decided that workers should have fair pay and working conditions, and that capitalists should continue to receive labourers’ high productivity and efficiency.
The first piece of post-independence legislation, the Industrial Dispute Act of 1947, was created with provisions for strikes and lockouts. This Act allowed for conditions to be modified based on societal needs, and it has since been superseded by the Industrial Relations Code of 2020.
Labour is covered by the Constitution’s Concurrent List. Thus, legislation governing labour can be passed by both the federal government and state legislatures.
The labour laws were revamped and have been consolidated as below:-
The Code on Wages, 2019
The Industrial Relations Code, 2020
The Code on Social Security, 2020
The Occupational Safety, Health and Working Conditions Code, 2020
Other than these, there are laws that are specific to each state and that were passed and implemented by the state governments.
Labour Codes of India
The Code on Wages 2019
The Code regulates wages and bonuses for all employees in India
The Code replaces the following four laws: (i) the Payment of Wages Act, 1936, (ii) the Minimum Wages Act, 1948, (iii) the Payment of Bonus Act, 1965, and (iv) the Equal Remuneration Act, 1976.
Coverage: Applies to all employees, with central and state governments setting wage rules for different sectors.
Wages: Defined as salary, allowances and monetary benefits (excluding bonuses and travel allowances).
• Minimum wage: Central government sets a national floor wage, with states able to set higher minimum wages in their areas. Minimum wages are reviewed every five years.
• Overtime: Employees get paid at least double their normal wage for working extra hours. Method of payments are given.
• Equal pay: Gender discrimination in wages and recruitment for similar work is prohibited.
• Advisory boards: Central and state governments will have advisory boards with employer, employee, and independent member representatives. These boards will advise on wage issues and increasing women’s employment opportunities.
• Penalty provided for employers who underpay is three months imprisonment and a fine of up to one lakh rupees.
The Industrial Relations Code, 2020
• It combines the features of 3 major laws- the Industrial Disputes Act, 1947, the Trade Unions Act, 1926 and the Industrial Employment (Standing Orders) Act, 1946.
• Forming Unions: At least 7 workers can apply to register a union. Unions with 10% of workers or at least
100 workers (whichever is lower) get registered. The union with majority worker support becomes the sole negotiating body.
• Unfair Practices: Certain actions by employers, workers, and unions are banned, like stopping workers from forming unions or damaging employer property. Penalties are in place for violations.
• Standing Orders: Establishments with 300 or more workers must have written rules (standing orders) on worker classification, wages, leaves, and grievance procedures.
• Voluntary Arbitration: Employers and workers can agree to settle disputes through arbitration.
• Government Mediation: Conciliation officers appointed by the government can try to mediate and settle disputes.
• Industrial Tribunals: If conciliation fails, disputes can be referred to special tribunals for a final decision.
• Exemptions from the Code: It provides that the central or state government may exempt any new establishment or a class of new establishment from all or any provisions of the Code in public interest.
The Occupational Safety, Health and Working Conditions Code, 2020
The Code consolidates 13 existing Acts regulating health, safety, and working conditions. These include the Factories Act, 1948, the Mines Act, 1952, and the Contract Labour (Regulation and Abolition) Act, 1970 etc.
Coverage: Most workplaces with at least 10 workers are covered by the Code.
Exemptions: Exemptions can be made for emergencies or disasters.
Employer Duties: Employers must provide a safe workplace, annual health checks (in certain cases), and report accidents.
Work Hours: Standard workday is 8 hours, overtime gets double pay. Workers can’t work more than 6 days a week and must get leave.
Working Conditions: The government will set specific rules on hygiene, drinking water, toilets, ventilation, and lighting.
Welfare Facilities: Canteens, first-aid, and crèches are some facilities that may be required.
Inspections: Government inspectors can visit workplaces and take action if they find safety hazards.
The code on Social Security, 2020
It replaces nine laws related to social security, including the Employees’ Provident Fund Act, 1952, the Maternity Benefit Act, 1961, and the Unorganised Workers’ Social Security Act, 2008.
Social security refers to measures to ensure access to health care and provision of income security to workers.
Social security schemes
Employee Protection Schemes Notified by central government include an provident fund, insurance, gratuity, maternity benefits, leaves, pension, death and accident benefits and also welfare of building and construction workers.
Gig Worker Protections: Such as life and disability cover along with social security funds them. Following are protected: -
Gig workers refer to workers outside of the traditional employer-employee relationship (e.g., freelancers).
Platform workers are workers who access other organizations or individuals using online platforms and earn money by providing them with specific services.
Unorganized workers include home-based and self- employed workers.
Coverage and registration: The Code specifies different applicability thresholds for schemes based on number of employees and these can be amended by the central government.
Financing: The schemes will be financed through a combination of contributions from the employer, the government, platform aggregators and employees.
Social security organisations: The Code provides for the establishment of several bodies to administer the social security schemes. These include:
A Central Board of Trustees, headed by the Central Provident Fund Commissioner
Employees State Insurance Corporation
National and State Social Security Boards, headed by the central and state Ministers for Labour and Employment
State-level Building Workers’ Welfare Boards
Inspections and appeals: The appropriate government may appoint Inspector-cum-facilitators to inspect establishments covered by the Code, and advise employers and employees on compliance with the Code.
MIGRANT LABOUR IN INDIA
Determinants of Migration
The problems of migrant workers have become very important in many developing countries of the world.
Migration of labour started in India during the period of British colonial rule. It was aimed at meeting the requirements of capitalist’s development both in India and abroad.
The labour was moved from the hinterland to the sites of mining, plantation and manufactories. It was recruited from the rural areas and regulated in such a manner that women and children remained in the villages while males migrated to urban areas.
Generally, there are two basic factors of migration: i) Distance
ii) Duration.
From a distance point of view, migration can be classified under four categories: i) Rural to Rural ii) Rural to Urban iii) Urban to Rural iv) Urban to Urban.
Besides, migration can be divided into following categories:
i) Intra-district, ii) Inter-district iii) Intra-state iv) Inter-state
• National and International.
From the duration point of view migration can be studied under three categories: i) Casual-temporary ii) Periodic- seasonal iii) Permanent.
The motives of migration are classified as push factors (which emphasize on the situation at the origin, that is, place from which migration started) and pull factors (which emphasize on the situation at the destination).
Unemployment, flood, earthquake, drought, (i.e., natural calamities) etc, are the push factors. Pull factors that determine migration such as attraction of city life, for education, health, development of backward community, job opportunities and. training facilities and so on.
Migration of labour in India
Census 2011 says there were 450 million internal migrants in India at that time. The Economic Survey of 2017 says that there are 60 million inter-state migrants, with an average national flow of only 9 million.
Movement of workers happens from impoverished rural regions to the more affluent urban and industrial pockets. The historically established list of out-migration regions such as UP, Bihar and Jharkhand have expanded to include states such Rajasthan, Odisha, Madhya Pradesh.
Even within the more prosperous states there is considerable intra-state movement of workers. While mega cities and industrial clusters have always been the major magnets of migrant workers, states such as Kerala have become significant employers of long-distance migrants.
Condition of Migrant workers in India
• Challenges like struggling with low wages, physical and sexual exploitation with safety and security are problems faced by migrant workers and more
specifically the unorganized sector in India.
• They are forced to work more hours without extra wages and even get less wages than directed by the government.
• They often get caught in exploitative labour arrangements that forces them to work in low-end, low-value, hazardous work. Lack of identity and legal protection accentuates this problem.
• Migrants can also become easy victims of identity politics and parochialism.
• The lockdown during the pandemic nearly affected 40 million migrant labourers.
Government initiatives for Migrant Labourers
The National Database of Unorganised Workers (NDUW), which would be seeded with Aadhaar and be a comprehensive database of Unorganised Workers including building and other Construction Workers and Migrant Workers, is being developed by the Ministry of Labour and Employment.
Various schemes like Garib Kalyan Rojgar Abhiyan, Pradhan Mantri SVANIDHI Scheme, Aatmanirbhar Bharat, Pradhan Mantri Garib Kalyan Yojana, One Nation One Ration Card, financial assistance to building and other construction workers etc. were launched.
The Labour Bureau, an attached office of the Ministry of Labour & Employment, has been entrusted with the task of conducting the All-India Survey on Migrant Workers.
'Sarva Shiksha Abhiyan (SSA)' is a universal education programme by Government of India, to provide free and compulsory education to the children of 6-14 years age group under Right to Education, which is accessible to the children of inter-state migrant workers as well.
In addition, the Ministry of Minority Affairs, Department of Empowerment of Persons with Disabilities, Ministry of Labour & Employment, Ministry of Tribal Affairs, Department of School Education & Literacy and some other Ministries provide scholarships to different target groups of students including children of Migrant workers.
Occupational Safety, Health and Working Conditions Code,
2020 provides for decent working conditions, minimum wages, grievances redressal mechanisms, protection from abuse and exploitation, enhancement of the skills and social security to all categories of organized and unorganized workers including Migrant workers.
Sustainable Development Goals
Sustainable Development Goals (SDG)
The Sustainable Development Goals adopted by the UN Member States are 17 thematic areas that outline a roadmap for sustainable development until 2030.
The SDGs for 2030 evolved from the Millennium Development Goals (MDGs) for 2015. The MDGs were a set of eight development goals set in the year 2000 with targets to be achieved by 2015. The MDGs are, in fact, the first global attempt at establishing measurable goals and targets on key challenges facing the world.
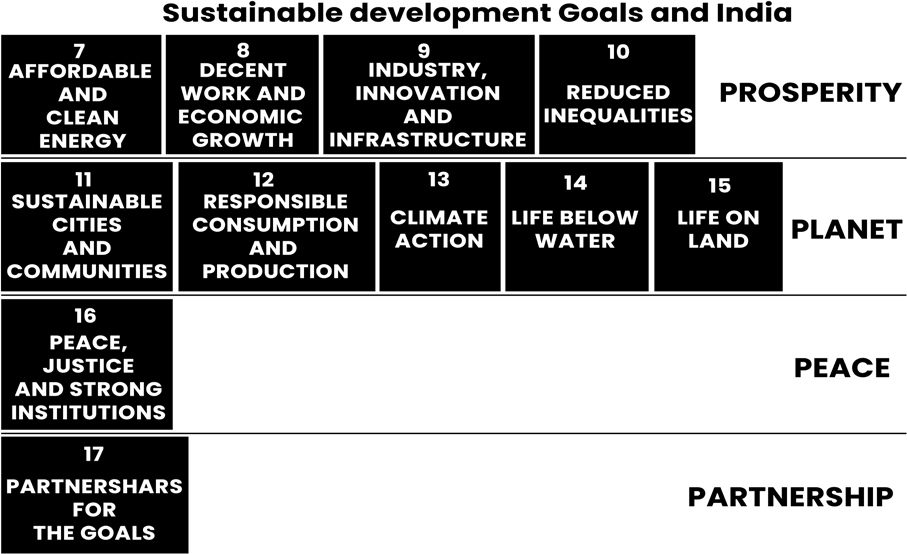
Sustainable development Goals and India
SDGs Mirror India’s Development Objectives
The Prime Minister of India attended the UN Summit convened to adopt the 2030 Agenda for Sustainable Development held in New York in 2015.
As a member of the Open Working Group (OWG) constituted for preparing a proposal on the SDGs, India vociferously advocated the concerns of the developing countries.
India has emphasized on international cooperation to facilitate development, and also insisted on adequate means of implementation such as enhanced Official Development Assistance (ODA) and technology transfer on favourable terms for helping the developing countries.
Institutional Set-up
Efforts are being undertaken by NITI Aayog to nationally incorporate and localise the SDGs at all levels of government. Sabka Sath Sabka Vikas with Sabka Vishwas: (Collective Effort for Inclusive Growth) is a key motto of India and it closely matches the core principle of SDGs i.e. leave no one behind. NITI Aayog’s role for SDG implementation includes data collection, monitoring, planning and implementation.
SDG India Index was also set up and a Second Voluntary National Review (VNR) to present progress of different goals.
National Indicator Framework (NIF), developed by the Ministry of Statistics and Programme Implementation
(MoSPI) in consultation with NITI Aayog. It provides an assessment framework for various SDGs at all levels. MoSPI also publishes progress reports on NIF for SDGs based on the latest data provided by the ministries which helps in monitoring progress on SDGs.
State Level Monitoring: States/UTs also monitor the progress of SDGs at the state and sub-state level.
Efforts by India to Achieve the SDGs
Government of India-United Nations Sustainable Development Cooperation Framework (UNSCDF) 2023-2027: NITI Aayog and the UN in India signed UNSCDF 2023-2027. It will focus on four interlinked pillars of the SDGs: people, prosperity, planet, and participation. For the first time, GoI-UNSCDF will focus on SDG localisation and South-South cooperation, and India’s model of development will be showcased on the world stage.
The SDG India Index 2023-2024 score for India has been raised from 57 in 2018 to 71 in 2023-24.
| Sustainable Development Goals | India’s Policy and Government Schemes addressing SDGs | Progress According to VNR 2025 |
| SDG 1: NO POVERTY End poverty in its all forms | MGNREGA PMAY (Pradhan Mantri Awas Yojna) PMJDY (Pradhan Mantri Jan Dhan Yojna) PMJAY (Pradhan Mantri Jan Arogya Yojna) part of Ayushman Bharat | SDG target of MPI is 1.2 to lift around half of the population from the poverty Poverty Alleviation: Around 248 million people have escaped Multidimensional Poverty (MPI) by the government effort to achieve SDG target. India’s extreme poverty level has been declined from 16.2% in 2011-12 to 2.3% in 2022-23. |
| SDG 2: ZERO HUNGER | NFSA 2013 | The proportion of population suffering from hunge |
| End hunger, achieve food security, improve nutrition and promote sustainable agriculture | Poshan Abhiyan Pradhan Mantri Kisan Sampada Yojna Pradhan Mantri Fasal Bima Yojna | was reduced from 18.1% in 2001 to 12.0% in 2023. (UN India) In 22nd instalment of PM KISAN government allocated an amount of ₹18,640 crore to 9.32 crore farmers. |
| Pradhan Mantri krishi Sinchayee | The Pradhan Mantri Garib Kalyan Anna Yojana | |
| Yojna | (PMGKAY): Feeding ration to 80 crore people. | |
| Food grain production has reached on 332.3 million | ||
| tonnes (2023-24). | ||
| GVA in agriculture has increased with 4.4% in 2024- | ||
| 25. | ||
| Under the Pradhan Mantri Fasal Bima Yojana | ||
| (PMFBY), Farmer enrolment increased by 28 % in | ||
| 2023-2024. | ||
| PM POSHAN 2.0 is providing hot cooked meal and | ||
| take-home ration for approximately to 100 million | ||
| people. | ||
| SDG 3: GOOD HEALTH AND WELL-BEING | Ayushman Bharat Pradhan Mantri Jan Aushadhi Yojna | Maternal Mortality Ratio (MMR) – 97 in 2018-19 (from 122 in 2015-17) |
| Ensure healthy lives and promote well-being for all at all ages | Swachh Bharat Mission | Target – 70 by 2030 Under-5 Mortality Rate (U5MR) – 32 in 2020 Out of Pocket expenditure was declined to 39.4% in 2020-21 from 48.8% in 2017-18 |
| PM POSHAN 2.0 | ||
| Under the ambitious campaign 14 lakh Anganwadi Centres are established across the country and the number of beneficiaries reached to 9 crores. |
| SDG 4: QUALITY EDUCATION Ensureinclusive education and equitable quality education and promote lifelong learning opportunities for all | National Education Policy 2020 Samagra Shiksha Abhiyan Beti Bachao, Beti Padhao Pradhan Mantri Kaushal Vikas Yojna | GER is universal at a level of 93% in primary level. As per Unified District information System for Education+ (UDISE+) percentage of school having computers increased from 38.5% in 2019-20 to 57.2% in 2023-24. While the school with internet facilities increased from 22.3% in 2019-20 to 53.9% in 2023-24. Number of higher education institute increased by 13.8% in 2022-23 from 2014-15. |
| SDG 5: GENDER EQUALITY Achieve gender equality and empower all women and girls | DeenDayal AntyodayaYojana- National Livelihood Mission PMJDY Access to credit to SHGs National Social Assistance Program | India has over 1.45 million elected women representatives at grassroots level. 100 million women are the part of self-help groups 888 One Stop Centres have been approved out of which 802 OSCs are operational. Sex ratio at birth is 930 in 2023-24. |
| SDG 6: CLEAN WATER AND SANITATION Ensure availability and sustainable management of water and sanitation for all | Jal Jeevan Mission Jal Shakti Abhiyan Namami Gange Swachh Bharat Mission | By march 2025, 155.4 million households have tap water supply. Population living in households with sanitation has increased to 70.2% (NFHS-5 2019-21) from (NFHS-4 2015-16) 93% Women in ODF villages have felt safer. |
| SDG 7: AFFORDABLE AND CLEAN ENERGY Ensure access to affordable, reliable, sustainable and modern energy for all | Pradhan Mantri Sahaj Bijli Har Ghar Yojna- Saubhagya (Accessible to all) Target of 450 GW renewable energy by 2030 under NDCs (Sustainable and modern) Pradhan Mantri Ujjwala Yojna (Affordable to all) National Mission for Enhanced Energy Efficiency Establishment of International Solar Alliance in partnership with France | India has total non-fossil fuel-based energy capacity has reached 217.62 GW as of January 2025. Number of LPG connections in India has reached up to 329.4 million as of March 2025 National Green Hydrogen Mission The objective is to make India self-reliable in the field of energy and to provide alternative source of energy by producing 5 million Metric Tonnes (MMT) annually by 2030. |
| SDG 8: DECENT WORK AND ECONOMIC GROWTH Promote sustained, inclusive and sustainable economic growth, full and productive employment and decent work for all | Make in India Micro Units Development and Refinance Agency (MUDRA) Scheme Atal Innovation Mission Major reforms to promote ease of doing business such as the GST regime, IBC, FDI liberalisation etc. Startup India, Standup India Atmanibhar Bharat | Lobur unemployment rates has declined to 3.2% in 2023-24 from 4.1% in 2021-22. Worker population ratio for youth has increased to 41.7% in 2023-24 from 31.4% in 2017-18. Patent and industrial design application were doubled in 2023 as compare to 2018 and trademark applications were increased by 60%. |
| SDG 9: INDUSTRY, INNOVATION AND INFRASTRUCTURE Build resilient infrastructure, promote inclusive and sustainable industrialisation and foster innovation | Simplification of IPR filing Ease of doing business Fostering innovation and industry academia collaboration Bharatmala Project Sagarmala Project National Infrastructure Pipeline (NIP) | India is now the third-largest start-up ecosystem in the world India holds 39th position in 2024 in Global innovation Index. $18.72 billion has been reported as an investment till 2024. Rural connectivity has been increased to 99.70% in 2023-24 from 47.38 in 2017-18 under PM Gram Sadak Yojan. By the end of 2024, 1,57,706 startup certificates had been issued which had been generated 1.728 million jobs. |
| SDG 10: REDUCED INEQUALITIES Reduceinequalitywithin and among countries | Right to Free and Compulsory Education (RTE) Act, 2002 and Samagra Shiksha Abhiyan Support to Training and Employment Programme for Women (STEP) and Deen Dayal Rehabilitation Scheme (DDRS) Pradhan Mantri Jeevan Jyoti Bima Yojana (PMJJBY), Pradhan Mantri Suraksha Bima Yojana (PMSBY) and Atal Pension Yojana (APY) | The urban-rural gap in average Monthly Per Capita Expenditure has decline to 71% in 2022-23. Gini coefficient for rural area has decline to 0.237 in 2023-24 and in urban area to 0.284 in 2023-24. PM-JANMAN is focused on targeted development of 75 Particularly vulnerable Tibal Groups. Target under Lakhpati Didi scheme is to raise the level of 30 million women. |
| SDG 11: SUSTAINABLE CITIES AND COMMUNITIES Make cities and human settlements inclusive, safe, resilient and sustainable | Atal Mission for Rejuvenation and Urban Transformation (AMRUT) Smart Cities Mission (SCM) PMAY-U National Urban Transport Policy (NUTP) National Mission on Transformative Mobility and Battery Storage Energy Conservation Building Code (ECBC) | Over 1,740 km of smart roads and 716 km cycle tracks have been constructed. Eleven major industrial corridors under NICDP. India has 1011 km of metro rail network. Nagar Van Yojna aims to develop 1000 Nagar vans by 2027. |
| SDG 12: RESPONSIBLE CONSUMPTION AND PRODUCTION Ensure sustainable consumption and production pattern | National Mission on Sustainable Agriculture Soil Health Card Energy Conservation Building Code (ECBC) Environment Protection Act, 1986 (EPA) | Lifestyle for Environment (LiFE) initiative launched in 2022. Revised E-waste management rules came in to force in 2023. In RE- INVEST India set a target of 540 GW of renewable energy by 2030 with investment of $386 billion and 240 GW of solar cell capacity |
| SDG 13: CLIMATE ACTION Take urgent action to combat climate change and its impacts | National Action Plan on Climate Change (NAPCC) State Action Plan on Climate Change (SAPCC) NationalPolicyonDisaster Management (2009) and the National Disaster Management Plan (2016) India launched ISA and CDRI | Target to achieve Panchamrit Goals of Glasgow in COP-26 by 2030. To achieve the target of Net-Zero emission by 2070. Emission intensity of GDP is decline by 36% as compared to 45% by 2030. Non-fossil electricity generation capacity has reached to 47.37% in 2025. |
| SDG 14: LIFE BELOW WATER Conserve and sustainably use the oceans seas and marine resources for sustainable development | Mangrove Initiative for Shoreline Habitats & Tangible Incomes (MISHTI) Marine Observation System Along the Indian Coast (MOSAIC) Marine Protected Areas National Marine Fisheries Policy 2017 Coastal Regulation Zones Integrated Coastal and Marine Area Management | Double- digit average growth of 10.87% as compared to 2014-15. Fish production of 175.45 lakh tons was achieved in 2022-23. Mangrove occupied area is 4,991.68 Sq. Km. |
| SDG 15: LIFE ON LAND Protect, restore and promote sustainable use of terrestrial ecosystems, sustainably manage forest, combat desertification, and halt and reverse land degradation and halt biodiversity loss | National Afforestation Programme Recognition of Forest Rights Act, 2006 and Joint Forest Management Wetland (Conservation and Management) Rules 2017 National River Conservation Plan (NRCP) and National Plan for Conservation of Aquatic Ecosystems (NPCA) Integrated Watershed Management Programme,theNational Afforestation Programme and the National Mission for Green India | Forest cover is 21.76% of the total geographical area with increase of 156.41 Sq. Km. Target to reverse the biodiversity loss by 2030 under NBSAP. New 59 wetlands sites were added since 2014. Number of protected areas have risen to 1022 in 2024. |
| SDG 16: PEACE, JUSTICE AND STRONG INSTITUTIONS Promote peaceful and inclusive societies for sustainable development, provide access to justice for all and build effective, accountable and inclusive institutions at all the levels | Ratified the UN Convention on the Rights of the Child (CRC) Prevention of Corruption Act, the Lok Pal and Lokayukta Act, the Whistleblowers Protection Act, and Prevention of Money Laundering Act RTI Act 2005 Aadhar based identity | India has distributed highest number of digital identity card known as Aadhaar to 1.3834 billion people. Reforms in criminal laws with Bharatiya Nyaya Sanhita, Bhartiya Nagrik Surakha Sanhita and Bhartiya Sakshya 2023. Establishment of Nari Adalat and 827 Anti-human trafficking. |
| SDG 17: PARTNERSHIPS FOR THE GOALS Strengthen the means of implementation and revitalise the Global Partnership for Sustainable Development | India’s active participation in ISA, CDRI, BRICS, NDB etc Public Finance Management System (PFMS) GovernmentIntegratedFinancial Management System (GIFMIS) Direct Benefit Transfer (DBT) | Improved its tax-to-GDP ratio in the last six years, to 17-17.5%. Eliminating leakages worth INR 1.7 trillion (USD 23 billion) by using DBT. India has extended more than 300 Lines of Credit (LoC) totalling USD 30.66 billion to 64 countries. India has committed a total of USD 150 million over a decade to the India-UN Development Partnership Fund. |