MAJOR INDICES OF ECONOMIC DEVELOPMENT
Human Development Index (HDI)
The Human Development Index (HDI) provides an overview of average performance in three important areas:
• Living a long and healthy life,
• Educational attainment, and
• Enjoying a reasonable standard of living.
In 1990, two economists Professors Mehbub-ul-Haque of
Pakistan and Amartya Sen of India developed it.
The Human Development Report (HDR) is a report that the United Nations Development Programme (UNDP) has published annually since 1993, calculating the Human Development Index (HDI).
The HDI ranks and compares nations using factors like average annual income and educational expectations.
Objective: The Human Development Index (HDI) was developed to highlight that, rather than just economic growth, people and their capacities should be the primary factors considered when evaluating a nation’s level of development.
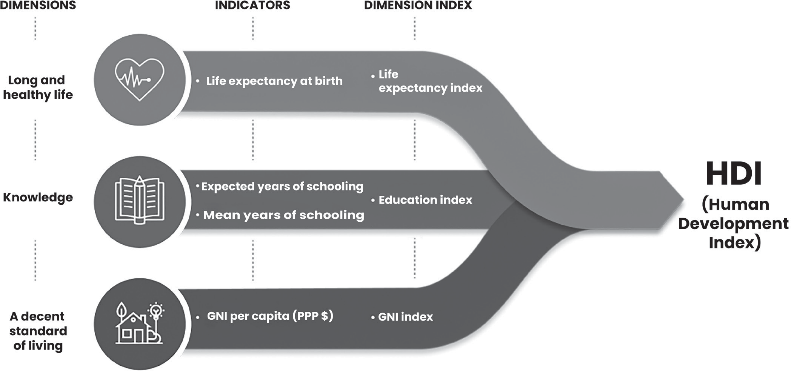
Dimensions and Indicators
• Life Expectancy Index: Life expectancy at birth is used to measure the health dimension
• Education Index: Mean number of years spent in school for adults over 25 and the anticipated number of years spent in school for children who are ready to start school are used to measure the education dimension.
• Gross National Income Index: Gross national income per capita is used to measure the standard of living.
• Use: By posing the question of how two nations with the same level of GNI per capita can have different outcomes in terms of human development, the HDI can be used to challenge national policy decisions. These differences can spark discussion about the priorities of public policy.
• Criticism: The HDI oversimplifies and only partially represents the scope of human development. It doesn’t address issues like poverty, human security, empowerment, or inequality.
Other composite indices are offered by the Human Development Report Office (HDRO) as a more comprehensive stand-in for some of the major concerns related to poverty,
inequality, gender inequality, and human development like Multidimensional Poverty Index (MPI), Gender Inequality Index (GII), Gender Development Index (GDI).
Human Development Index 2024-25
The Report titled ‘A Matter of Choice: People and Possibilities in the Age of AI,’ India’s position improved to 130th out of 193 countries, while Iceland topped the HDI Index (followed by Norway and Switzerland).
Widening Inequality: While the global HDI saw its smallest increase since 1990 (excluding the pandemic years), the disparity between the richest and poorest nations has been widening. High-HDI countries are recovering to pre-pandemic trends, but low-HDI countries face stagnation.
AI and Polarisation Focus: The report highlights that Artificial Intelligence is rapidly transforming the world, but risks exacerbating inequalities. It warns against "jobless industrialization" and increasing protectionism, noting that inclusive, human-centered AI policies are needed to prevent further global polarisation.
India’s HDI Score: India’s HDI score improved to 0.685
(up from 0.676 in the previous cycle), remaining in the ‘Medium’ human development category. Since 1990, India’s HDI value has increased by over 53%, growing faster than both the global and South Asian averages.
Key Dimensions of India's Progress
• Life expectancy in India jumped to 72 years in 2023: This is the highest level since the inception of the index, reflecting a robust post-pandemic recovery and the success of national health programs like Ayushman Bharat and the National Health Mission.
• India’s income per person rose: The Gross National Income (GNI) per capita reached $9,047 (in 2021 PPP terms), a significant jump from the $6,951 reported previously.
• Education is on the upswing in India: Children in India can now expect to spend 13.0 years in school (Expected Years of Schooling). The Mean Years of Schooling for adults remains at approximately 6.9 years.
• Gender and Poverty Metrics
• Gender Inequality Index (GII): India improved its rank to 102nd out of 172 nations (with a score of 0.403). While reproductive health has improved, female labour force participation (41.7%) and political representation still lag behind the global average.
• Gender Development Index (GDI): The GDI value for India is 0.874, placing it in Group 5 (countries with a deviation of more than 10% from gender parity). The most significant gap remains in estimated earned income.
• Multidimensional Poverty Index (MPI): India has seen a historic decline in poverty, with the headcount ratio falling to 16.4% (based on 2019–21 data). However, approximately 234 million people still live in multidimensional poverty, and the 2025 report highlights the "double burden" of poverty and climate hazards.
• Planetary Pressures-adjusted HDI (PHDI): India’s PHDI value stands at 0.656. When adjusted for carbon dioxide emissions and material footprint, India’s global rank actually increases by 14 positions, reflecting a relatively lower environmental footprint compared to high-income nations.
• Inequality-adjusted HDI (IHDI): Inequality reduces India's overall HDI score by 30.7% (one of the highest losses in the region), bringing the IHDI value down to
0.475. This adjustment effectively pushes India from the "Medium" to the "Low" human development category.
WORLD HAPPINESS REPORT
Every year, the United Nations Sustainable Development Solutions Network publishes the World Happiness Report. This study rates the happiness of citizens of various nations using survey data from respondents in more than 150 countries.
Since 2012, the World Happiness Report has been released annually around March 20th as a part of the festivities for the International Day of Happiness.
The ranking measures happiness using six major factors
Social Support
Income
Health
Freedom
Generosity and
Absence Of Corruption.
World Happiness Report 2025
One of the important reports published by the UN Sustainable Development Solutions Network (UNSDSN) in collaboration with The Wellbeing Research Centre at the University of Oxford in partnership with Gallup that define the parameter and level of happiness of the countries worldwide.
Top performer: Finland (8th consecutive year), followed by Denmark, Iceland, and Sweden.
Worst performer: Afghanistan (147th) (4th consecutive year). Others include Sierra Leone (146th), Lebanon (145th), Malawi (144th), and Zimbabwe (143rd).
India’s Ranking: 118th (2025), 126th in 2024. However, India’s performance has improved still it ranked behind from some of its neighbouring countries.
Other South Asian Nations Ranking: Nepal (92nd), Pakistan (109th), Myanmar (126th), Sri Lanka (133th), Bangladesh (134th).
SUSTAINABLE DEVELOPMENT REPORT
The Sustainable Development Report, released by the Sustainable Development Solutions Network (SDSN), is an international evaluation of nations’ advancements towards accomplishing the Sustainable Development Goals (SDGs).
Established in 2012, the SDGs are implemented to ensure real-world problem solving for sustainable development.
The report, which has been monitoring and rating 163 UN member states’ SDG performance since 2015, attempts to gauge the overall amount of progress made towards accomplishing all 17 SDGs.
India’s Performance in Sustainable Development Report
India improved its position in the global Sustainable Development Report, 2025, breaking into the top 100 for the first time.
India has an SDG index score of 67.0, placing it at position 99th among 193 countries in the index. It was previously placed 112th in 2023 and 109th in 2024.
Nationally, NITI Aayog reported India’s SDG score jumped significantly from 66% in 2020-21 to 71% in 2023- 24.
While scores for Climate Action (SDG 13) and Life on Land (SDG 15) saw marked improvements, Reduced Inequality (SDG 10) was the only goal to see a decline, dropping from 67 to 65 points.
The country also needs improvement in sustainable cities, equality, clean water and sanitation, and strong institutions. Progress on ending hunger and sustainable communities stalled as well.
On a brighter note, India stayed on track with its goals for poverty reduction and sustainable consumption.
Classification of countries by income level by the World
Bank Group for FY24 (July 1, 2023–June 30, 2024)
The world’s economies are divided into four income categories by the World Bank Group: low, lower-middle, upper-middle, and high. Every year on July 1st, the classifications are updated according to the Gross National Income (GNI) per capita of the preceding calendar year. With this, the World Bank’s income classification seeks to represent the degree of development of a nation.
Since the late 1980s, the way that nations are categorised according to their income levels has undergone substantial change. By 2022, only 12% of reporting countries were considered low income, compared to 30% in 1987. Based on the GNI per capita of 2022, the revised country income classifications for FY24 are as follows
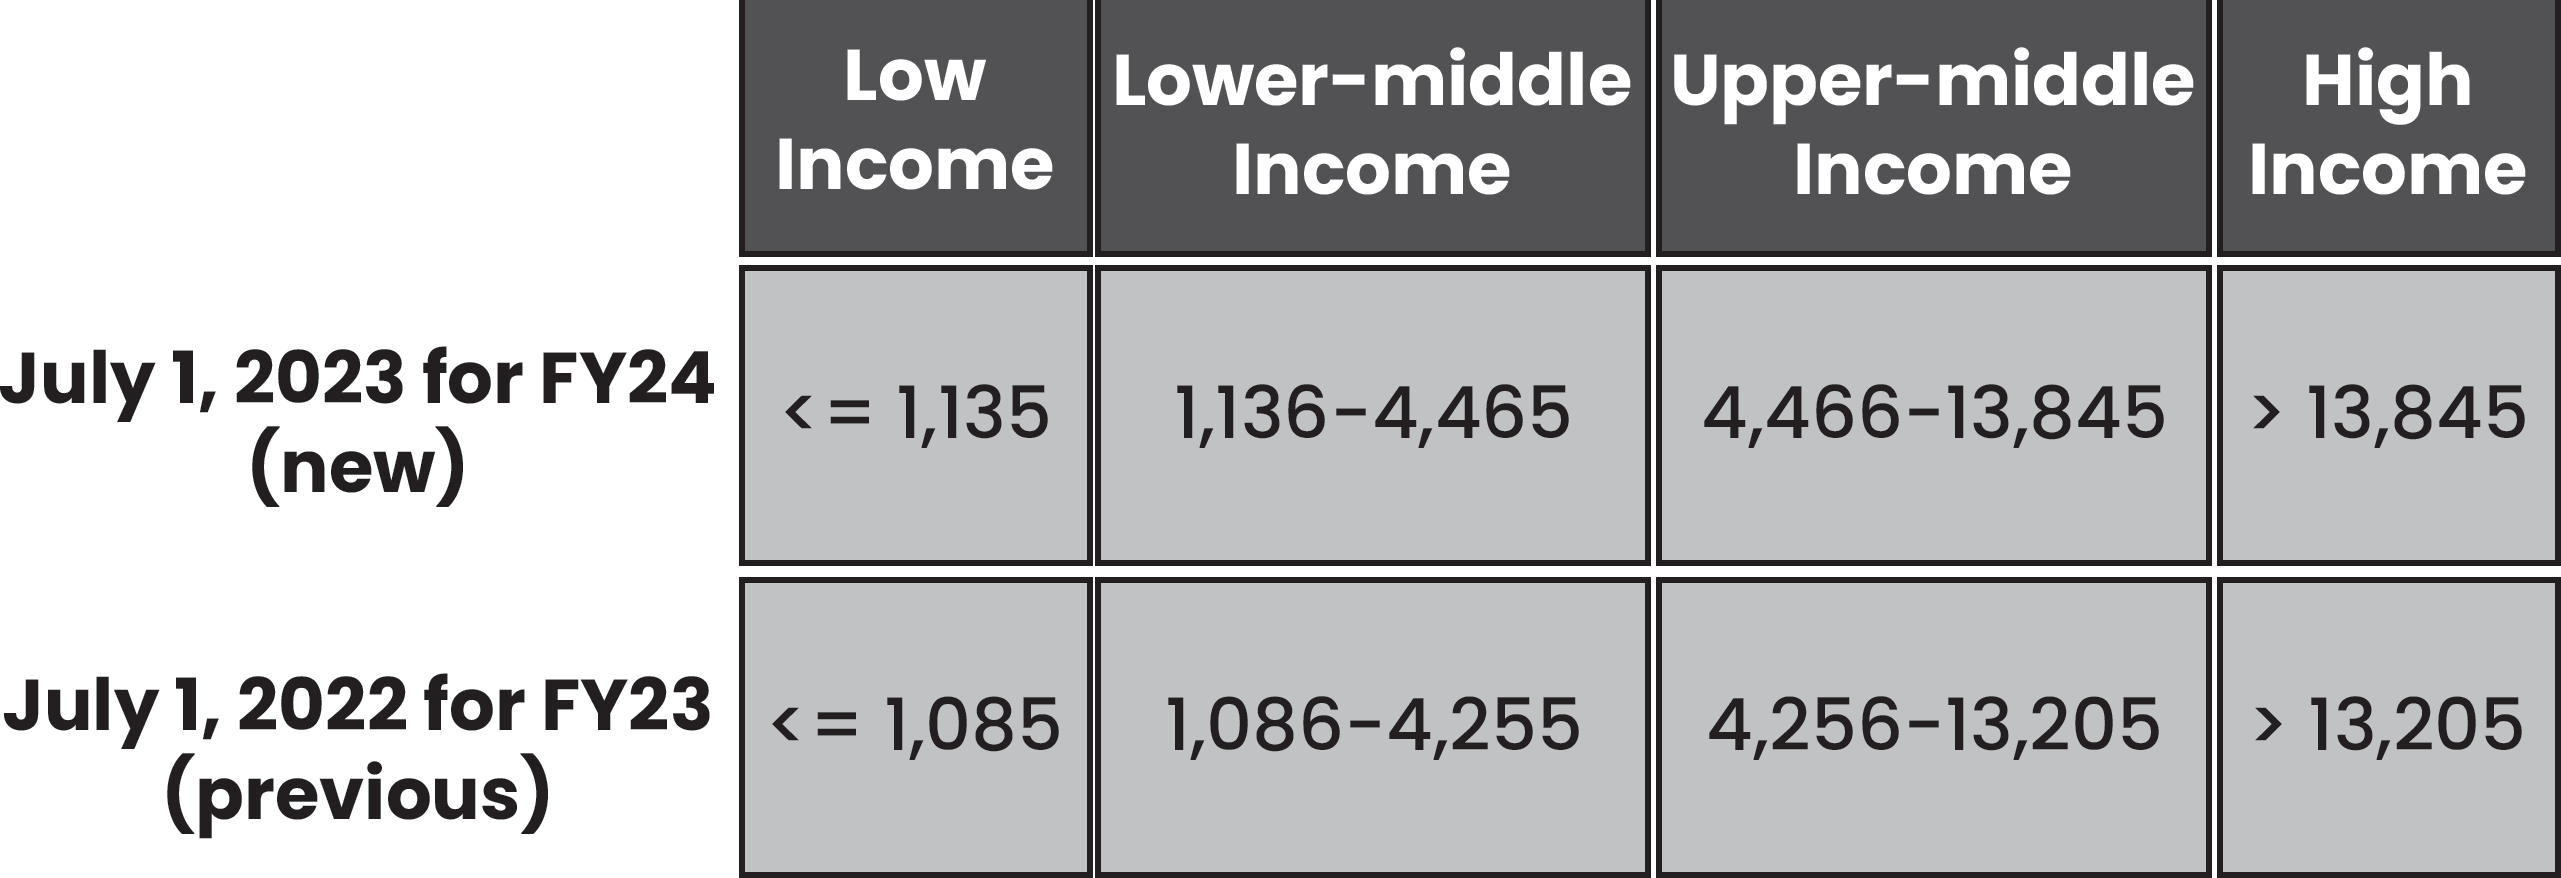
The level of GNI per capita can be affected by a number of factors in each nation, including population growth, inflation, economic growth, and exchange rates.
Income classification thresholds are adjusted annually for inflation using the Special Drawing Rights (SDR) deflator,
which is a weighted average of the GDP deflators of China, Japan, the United Kingdom, the United States and the Euro Area. This allows the thresholds to remain fixed in real terms.
India belongs to the “Lower Middle” group as its GNI per capita is $2380 in terms of nominal exchange rate.