PRODUCTION AND COSTS
Short run costs
• In the short run, some of the factors of production cannot be varied, and therefore, remain fixed. The cost that a firm incurs to employ these fixed inputs is called the total fixed cost (TFC).
• Whatever amount of output the firm produces, this cost remains fixed for the firm. To produce any required level of output, the firm, in the short run, can adjust only variable inputs. Accordingly, the cost that a firm incurs to employ these variable inputs is called the total variable cost (TVC). Adding the fixed and the variable costs, we get the total cost (TC) of a firm.
• In order to increase the production of output, the firm must employ more of the variable inputs. As a result, total variable cost and total cost will increase. Therefore, as output increases, total variable cost and total cost increase.
Long Run Costs
• In the long run, all inputs are variable. There are no fixed costs.
The total cost and the total variable cost therefore, coincide in the long run
Shut Down Point: The last price-output combination at which the firm produces positive output is the Shut Down Point.
Normal Profit: The minimum level of profit that is needed to keep a firm in the existing business is defined as normal profit. A firm that does not make normal profits is not going to continue in business. Normal profits are therefore a part of the firm’s total costs.
Super-normal profit: Profit that a firm earns over and above the normal profit is called the super-normal profit.
Break-even point: The point on the supply curve at which a firm earns only normal profit is called the break-even point of the firm
Circular Flow Model
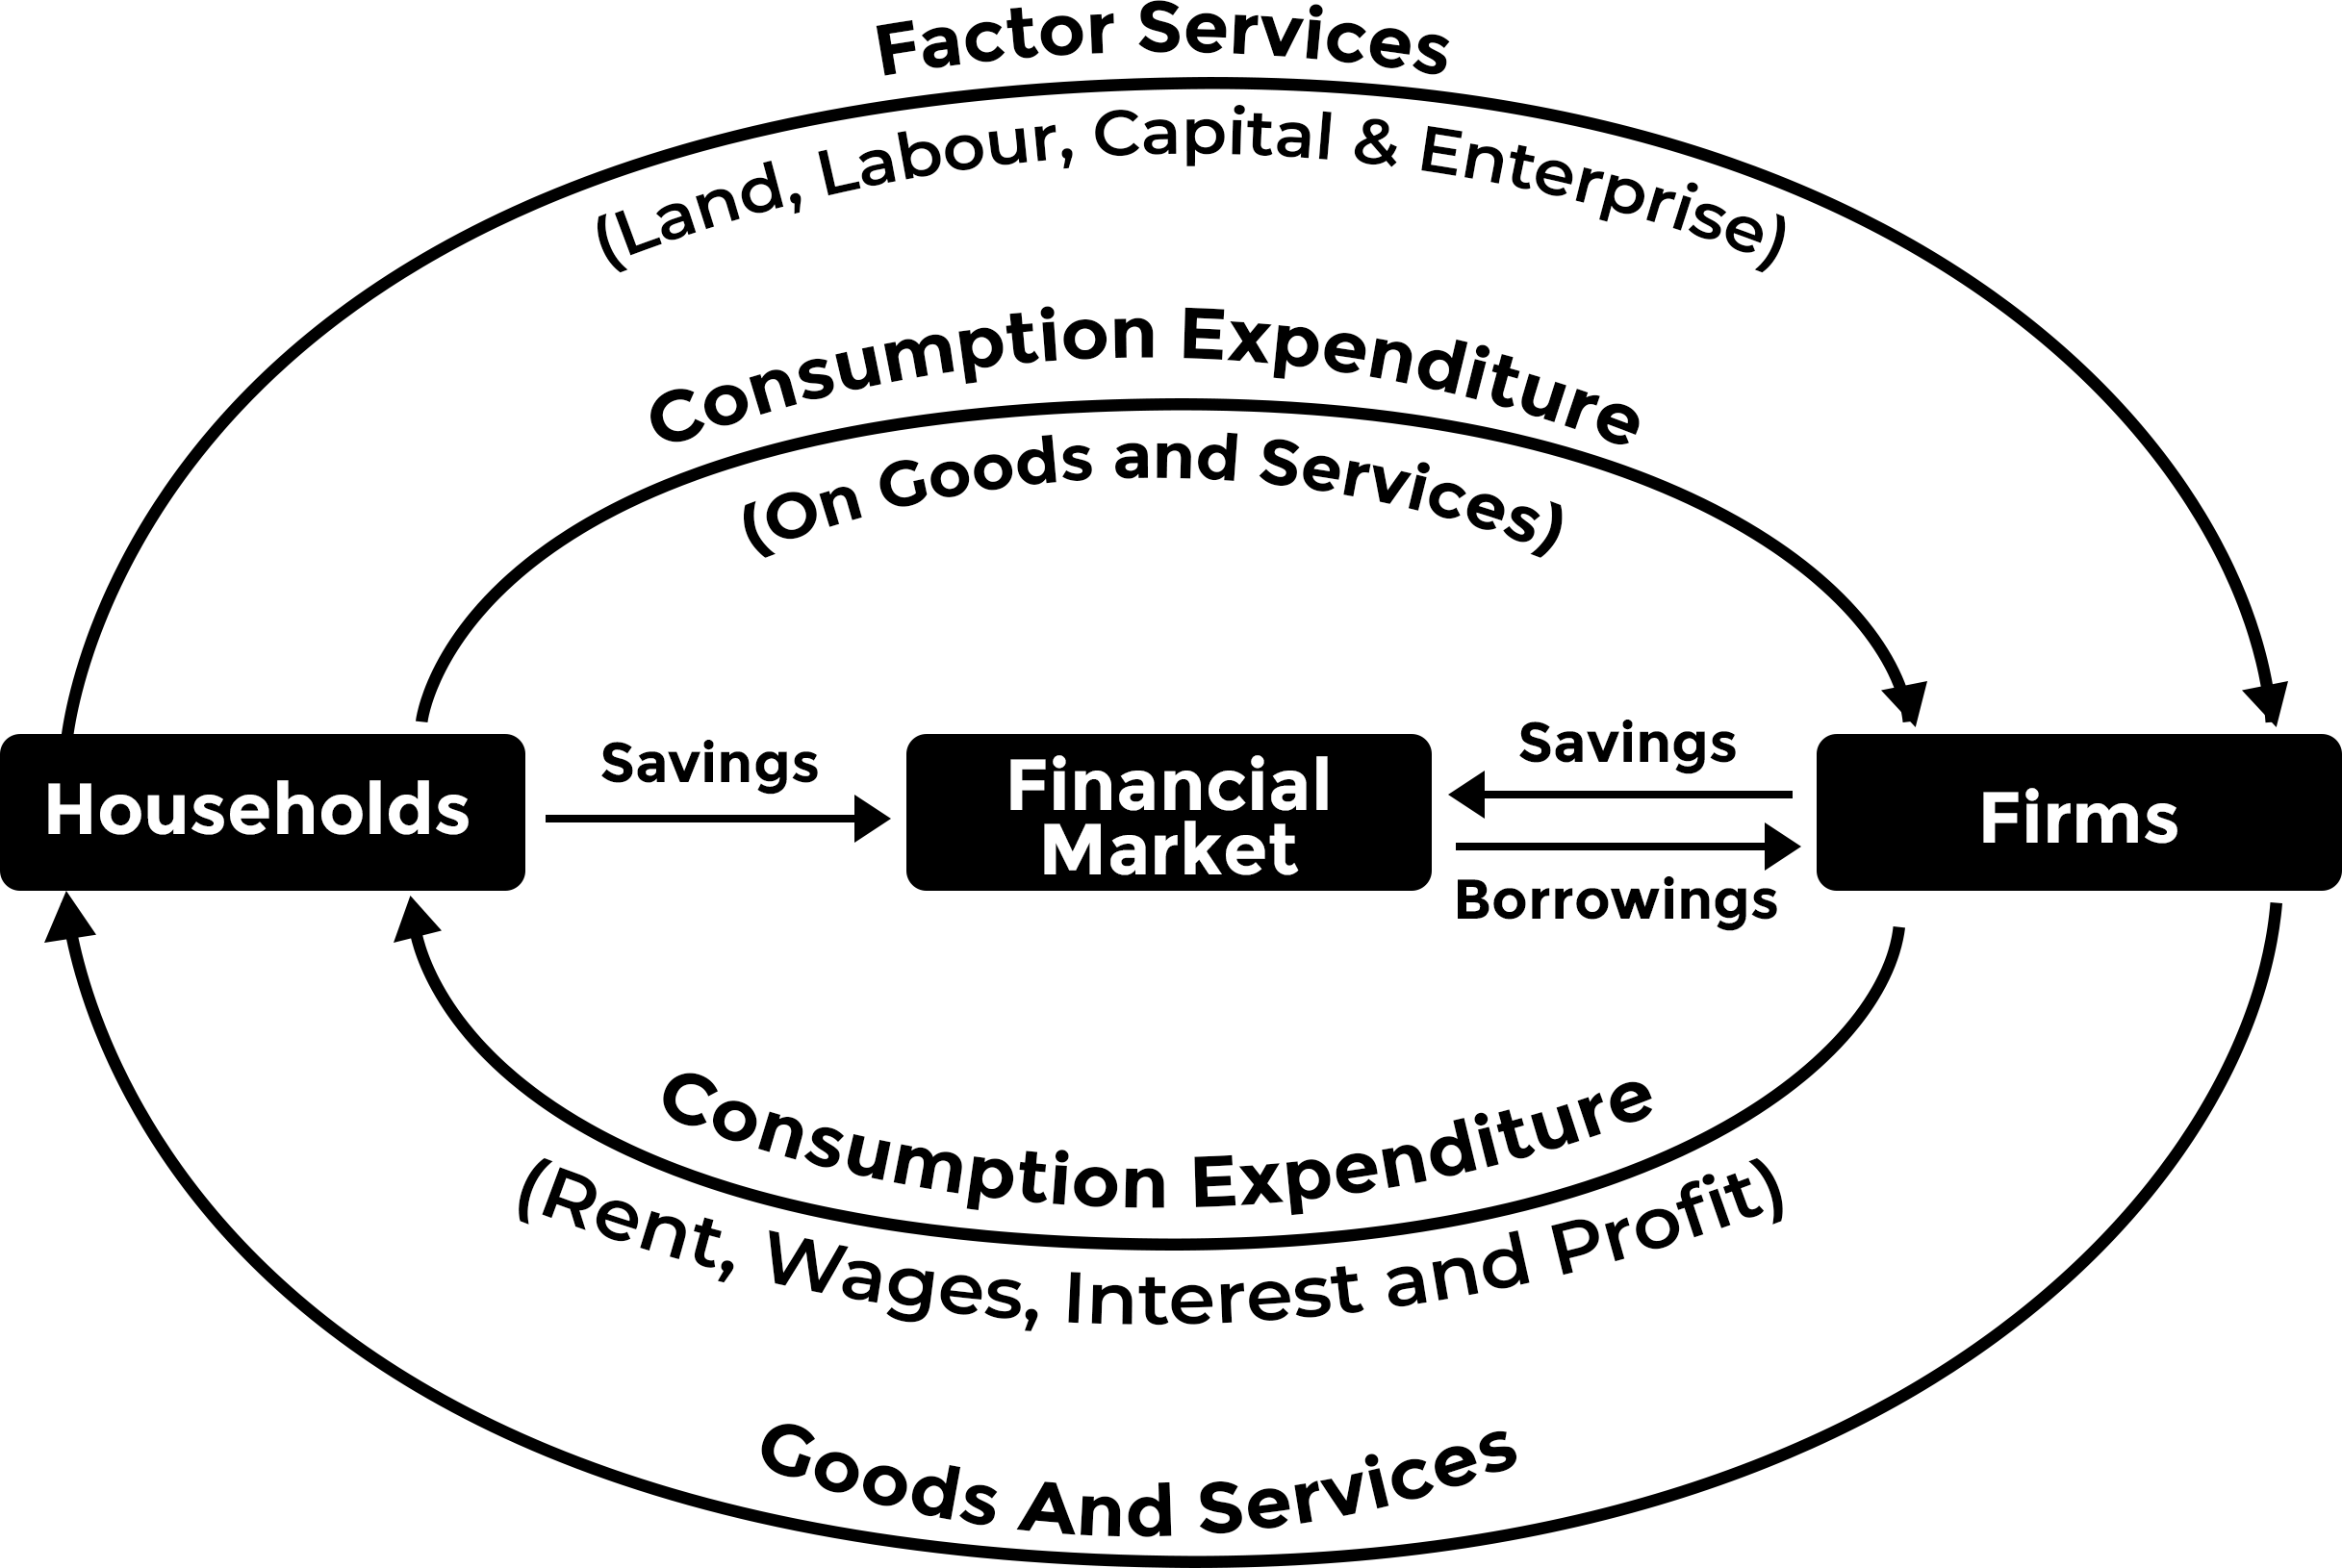
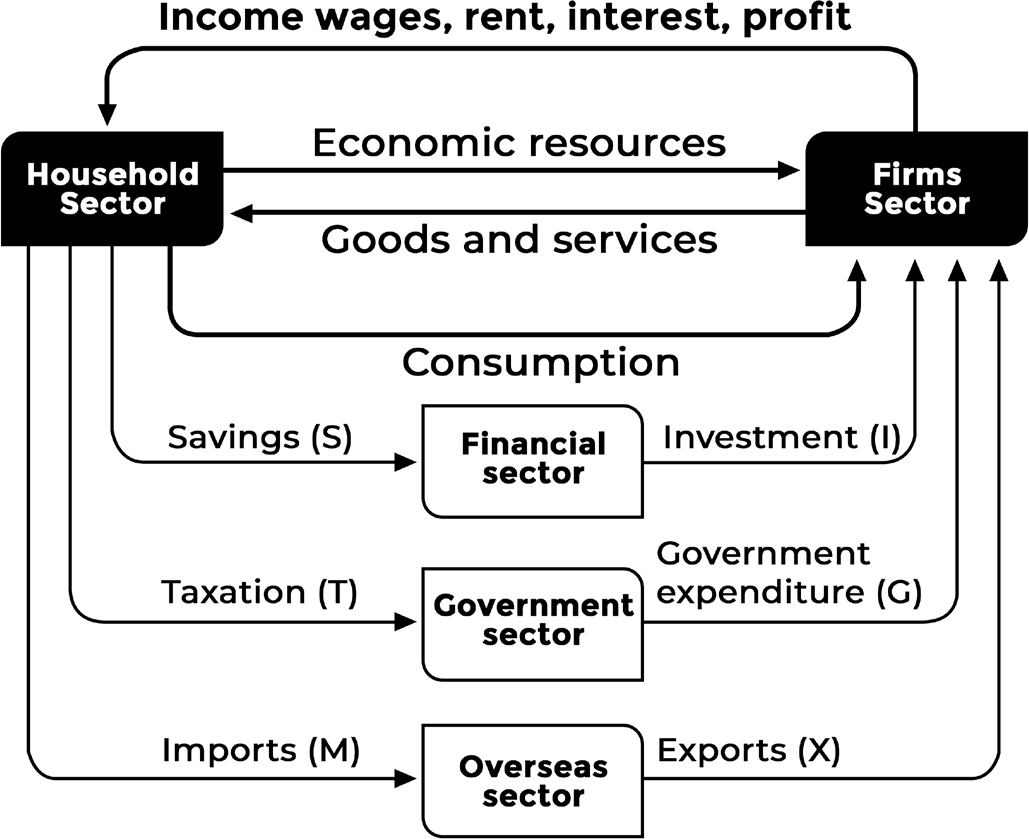
• The circular flow model is an economic model that presents how money, goods, and services move between sectors in an economic system. The flows of money between the sectors are also tracked to measure a country’s national income or GDP, so the model is also known as the circular flow of income.
• The idea of circular flow was first introduced by economist Richard Cantillon in the 18th century and then progressively developed by Quesnay, Marx, Keynes, and many other economists.
• How an economy runs can be simplified as two cycles flowing in opposite directions. One is goods and services flowing from businesses to individuals, and individuals provide resources for production (labor force) back to the businesses.
• In the other direction, money flows from individuals to businesses as consumer expenditures on goods and services and flows back to individuals as personal income (wages, dividends, etc.) for the labor force provided. This is the most basic circular flow model of an economy. In reality, there are more parties participating in a more complex structure of circular flows.
Two-Sector Model
• The model described above is the two-sector model, which is the most basic model containing only two sectors: individuals or households and businesses.
• In the two-sector model, it is assumed that households spend all their incomes as consumer expenditures and purchase the goods and services produced by businesses. Thus, there are no taxes, savings, or investments that are associated with other sectors.
Three-Sector Model
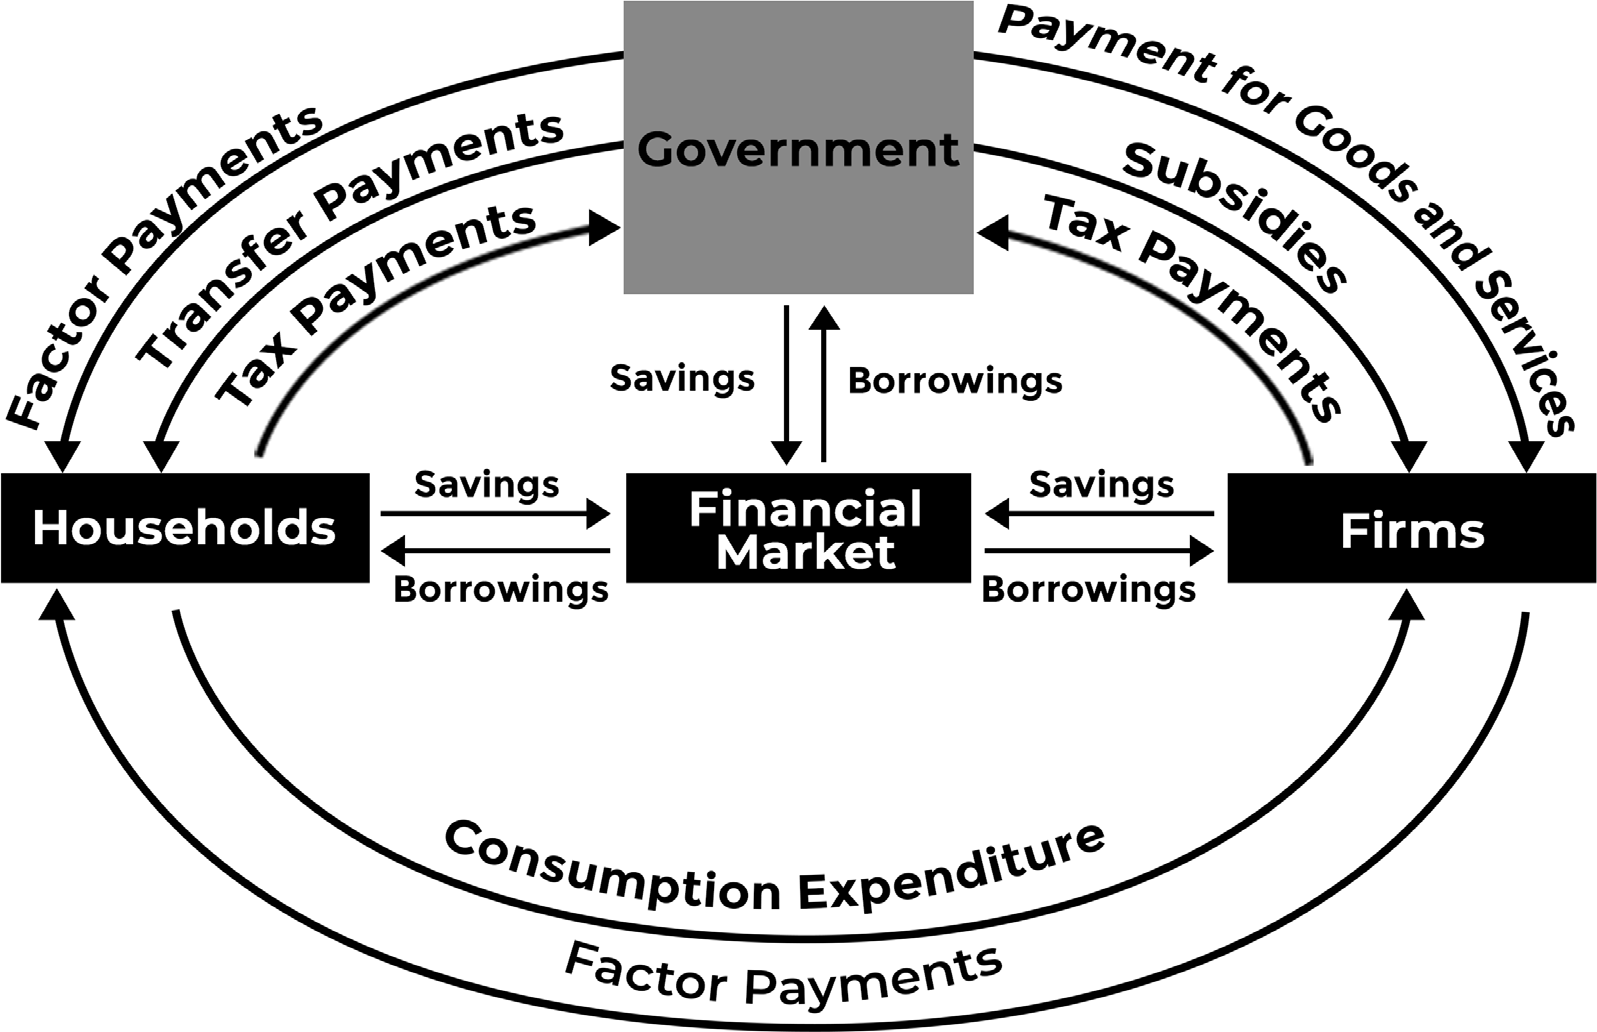
In the three-sector model, the government is added to the two-sector model. In this model, money flows from households and businesses to the government in the form of taxes. The government pays back in the form of government expenditures through subsidies, benefit programs, public services, etc.
Four-Sector Model
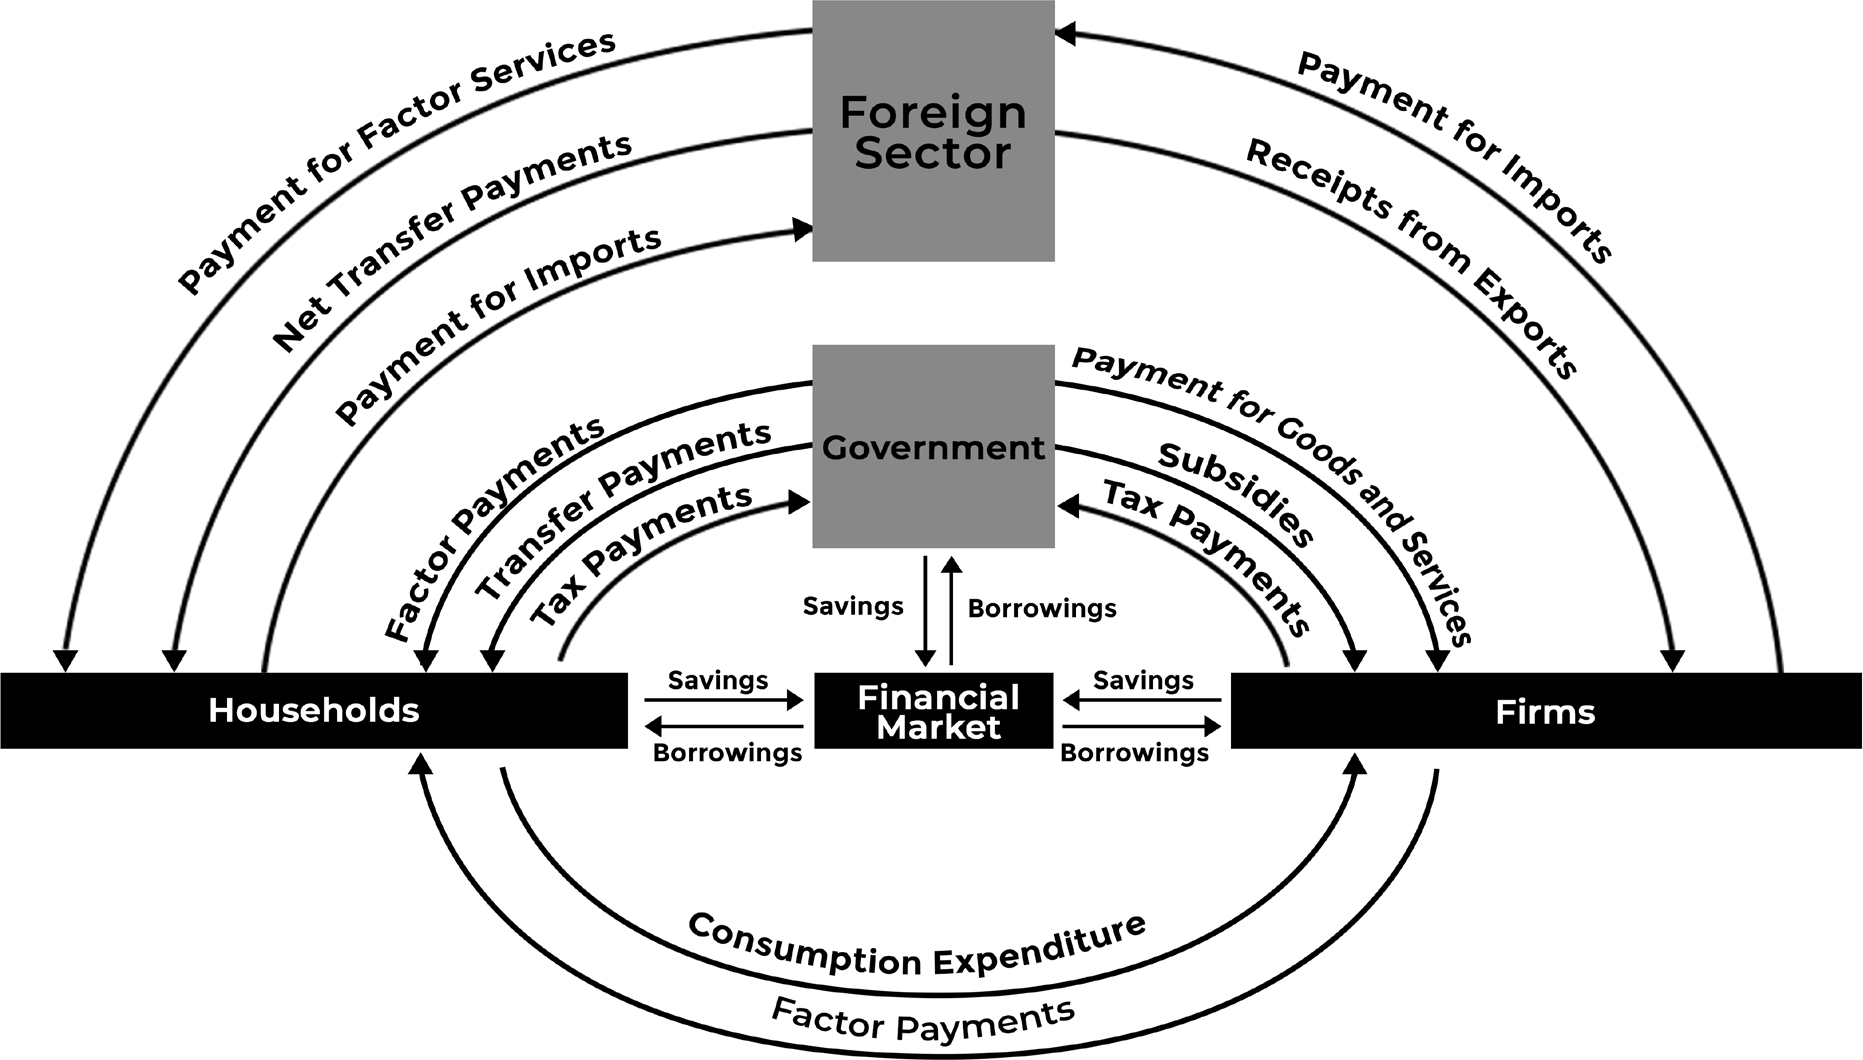
The four-sector model contains the foreign sector, which is also known as the overseas sector or external sector. The overseas sector turns a closed economy into an open economy. It is connected to the other sectors through two flows of money: foreign trade (imports and exports) and foreign exchange (inflow and outflow of capital). Like the other sectors, each flow of money is paired with a flow of a factor of production or goods and services.
Five-Sector Model
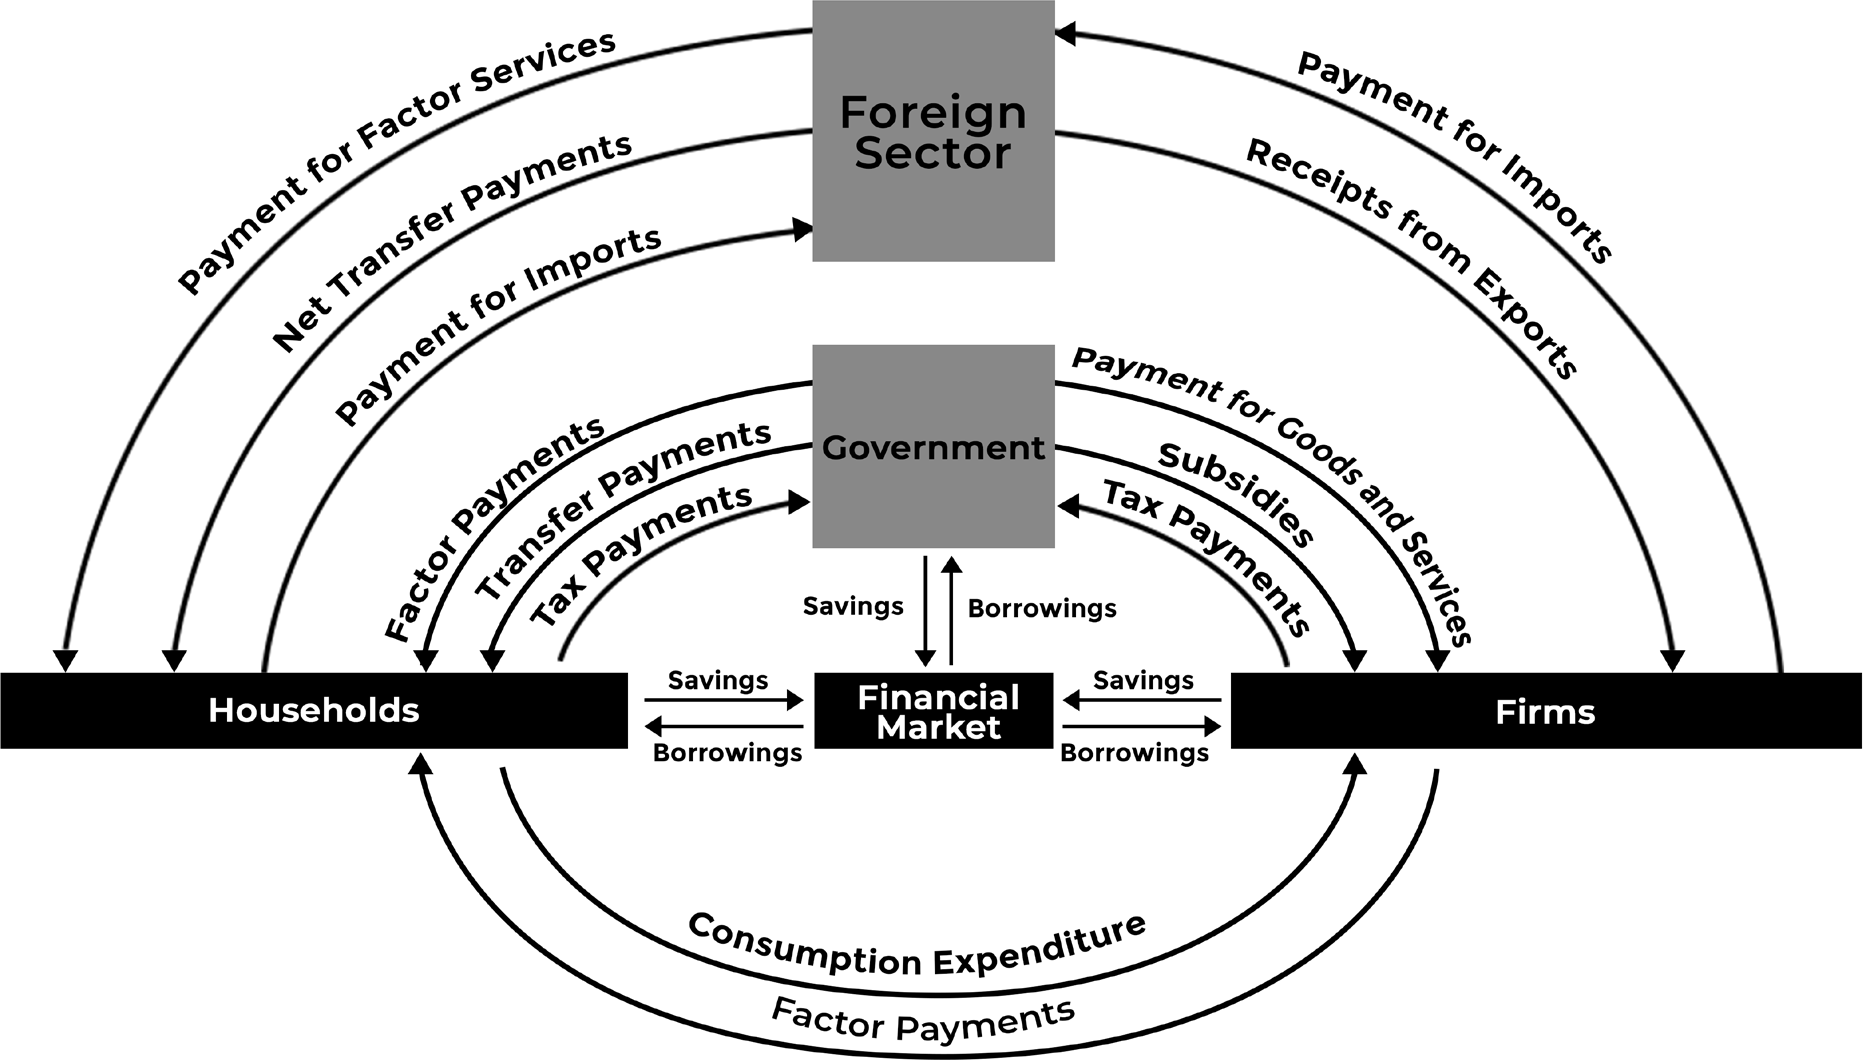
The fifth sector – the financial sector – is added to complete the circular flow model. It includes banks and other institutions that provide borrowing and lending services to the other sectors. Savings and investments are assumed in the five-sector model, which flow from other sectors with residual cash into the financial institutions, then out to the sectors that need money. As long as lending (injection) is equal to borrowing (leakage), the circular flow reaches an equilibrium and can continue forever
Implications of the Circular Flow Model
As a fundamental concept of macroeconomics, the circular flow model has been widely applied in different studies, with significant impacts on the understanding of economics. Four examples are listed below to show the significance of the model.
• Measurement of national income: The sectors in the circular flow model are the components of the calculation of national income. The expenditure approach calculates a nation’s GDP as the sum of the household consumption expenditures, private domestic investment, government consumption and investment expenditures and net exports (GDP = C + I + G + [X-M]).
• Knowledge of interdependence: The circular flow model underpins the knowledge of interdependence between sectors in an economic system. The activities and money flows cannot take place without interaction with another sector.
• Unending nature of economic activities: Money and economic resources flow in cycles indefinitely with an equilibrium of aggregate income and expenditures.
• Injections and leakages: The circular flow of an economy is balanced when the total injections equal the leakages. If injections overweight leakages, the country’s national income will grow. If injections are below leakages, the national income will decrease.
Invisible Hand
The term “invisible hand” first appeared in Adam Smith’s famous work, "The Wealth of Nations", to describe how free markets can incentivize individuals, acting in their own self- interest, to produce what is socially necessary.
The invisible hand is a metaphor for how, in a free market economy, self-interested individuals operate through a system of mutual interdependence.
This interdependence incentivizes producers to make what is socially necessary, even though they may care only about their own well-being.
Each free exchange creates signals about which goods and services are valuable and how difficult they are to bring to market.
Critics argue that the invisible hand does not always produce socially beneficial outcomes, and can encourage greed, negative externalities, inequalities, and other harms.
Paradox of Thrift
The "paradox of savings" means that if everyone saves too much money, it can actually hurt the economy and lead to less savings overall. This seems strange because we usually think that saving more is good for everyone.
Even though saving is good for people, it might not be good for the economy. This idea comes from the theory that when people save too much and don’t spend enough, it can cause economic problems.
Where it came from: The idea was explained by the economist John Maynard Keynes in his book The General Theory of Employment, Interest, and Money (1936). Keynes thought that saving too much is bad for the economy, and that it’s better if people spend more money.
When people save, businesses use that money to create goods and services. But if people don’t buy enough of those things, businesses can lose money and stop investing. This slows down the economy. However, when people spend more, it helps businesses grow and the economy to improve.
Productivity
Productivity, in economics, measures output per unit of input, such as labor, capital, or any other resource. It is often calculated for the economy as a ratio of gross domestic product (GDP) to hours worked. Labor productivity may be further broken down by sector to examine trends in labor growth, wage levels and technological improvement. Corporate profits and shareholder returns are directly linked to productivity growth.
At the corporate level, productivity is a measure of the efficiency of a company’s production process, it is calculated by measuring the number of units produced relative to employee labor hours or by measuring a company’s net sales relative to employee labor hours.
Types of Productivity Measures
Labor Productivity
• The most commonly reported productivity measure is labor productivity published by the Bureau of Labor Statistics. This is based on the ratio of GDP to total hours worked in the economy.
• Labor productivity growth comes from increases in the amount of capital available to each worker (capital deepening), the education and experience of the
workforce (labor composition), and improvements in technology (multi-factor productivity growth).
Total Factor Productivity
• There are many factors that impact a country’s productivity. Such things include investment in plant and equipment, innovation, improvements in supply chain logistics, education, enterprise and competition. It is interpreted as the contribution to economic growth made by managerial, technological, strategic and financial innovations.
• Also known as multi-factor productivity (MFP), this measure of economic performance compares the number of goods and services produced to the number of combined inputs used to produce those goods and services. Inputs can include labor, capital, energy, materials and purchased services.
Capital Productivity
• Capital as a productivity measure looks at how efficiently physical capital is being used to create goods or services. Physical capital includes tangible items, such as office equipment, labor materials, warehouse supplies and transportation equipment (cars and trucks).
• Capital productivity is calculated by subtracting liabilities from physical capital. You then divide the sales number by the difference. A higher capital productivity number shows that physical capital is being used efficiently in the creation of goods and services while a lower capital productivity number shows the opposite.
Material Productivity
Measuring productivity by materials looks to measure output by the materials consumed. Materials consumed can be heat, fuel, or chemicals in the process to create a good or service. It analyzes the output generated per unit of material consumed.
Capital Output Ratio
• The concept of capital output ratio expresses the relationship between the value of capital invested and the value of output.
• The capital required to generate a single unit of output is
known as the capital output ratio. Assume, for instance, that an economy’s investment is 32% (of GDP) and that the growth of the economy is 8% at this level of investment.
• A high capital-to-output ratio indicates that significant capital is required to generate a single unit of output.
• Hence, growth will be constrained even with significant savings if there is a high capital-output ratio.
• In this case, an investment of Rs 32 yields an output of Rs 8. The ratio of capital output is 32/8, or 4. Put another way, four units of capital are required to produce one unit of output. Remember, though, that the Rs 32 you invested on the machinery will last for 10 or twelve years. Each year, this mechanism will produce one rupee.
Incremental Capital Output Ratio (ICOR)
• The incremental capital output ratio (ICOR) is a frequently used tool that explains the relationship between the level of investment made in the economy and the subsequent increase in the gross domestic product (GDP). ICOR indicates the additional unit of capital or investment needed to produce an additional unit of output.
• The utility of ICOR is that with more and more investment, the capital output ratio itself may change and hence the usual capital output ratio will not be useful.
• ICOR is a metric that assesses the marginal amount of investment capital necessary for a country or other entity to generate the next unit of production.
• A lower ICOR is a sign of more efficient production in a certain nation. Higher ICOR values are not recommended as they suggest inefficient production by the entity. The metric is primarily used to assess the degree of production efficiency in a nation.
• Some critics of ICOR have suggested that the use of ICOR is limited as it favors developing countries that can increase infrastructure and technology use as opposed to developed countries, which are operating at the highest level possible. For example, a developing country can theoretically increase its GDP by a greater margin with a set number of resources than its developed counterpart can.
ICOR can be calculated as:
ICOR= Annual Investment/Annual Increase in GDP