Risk Mapping
Risk Representation Through Mapping: Risks can be effectively illustrated using maps, which help in visualizing potential threats. Various methods have been developed to accurately estimate risks, including f:N curves, scenario mapping, and potential loss studies, as outlined in the Disaster Management Training Programme by UNDP.
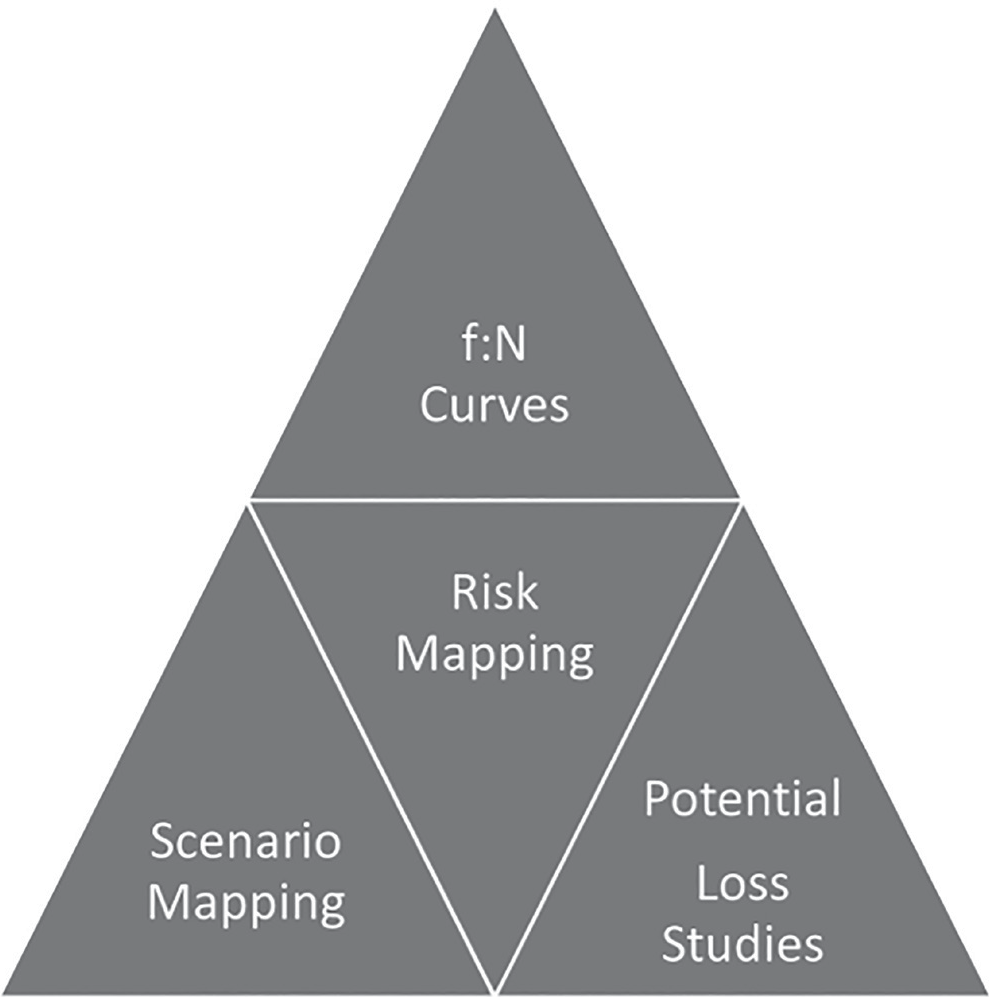
Figure: Aspects of Risk Mapping
• f:N Curves
• The “f” represents the frequency of a disaster event, while “N” refers to the number of casualties in a particular country. These values can be plotted as f:N curves.
• However, such curves only show aggregate losses over a period of time for a large region. They do not provide a detailed geographical distribution of the damage, making risk mapping essential.
• Analyzing data from 1900 to 1975, it is evident that natural disasters have caused significantly greater losses compared to man-made calamities such as transportation accidents or industrial fires.
• Scenario Mapping
• Scenario mapping aims to illustrate the impact of a single hazard.
• It utilizes circles and shaded areas on maps to represent different building types, population densities, and settlement areas. This method helps in assessing the extent of damage in specific locations based on historical data and recent developments.
• A scenario map identifies "communities at risk" and "regions at risk," highlighting areas that require restoration and recovery efforts after a disaster.
• These maps also help determine the resources needed for medical assistance, emergency shelters, and other disaster response measures to reduce the recovery time.
• For example, scenario mapping has been used to assess the potential impact of a 7.2 magnitude earthquake in Bursa Province, Turkey. However, this technique does not provide a precise prediction but rather an assessment based on past occurrences and existing vulnerabilities.
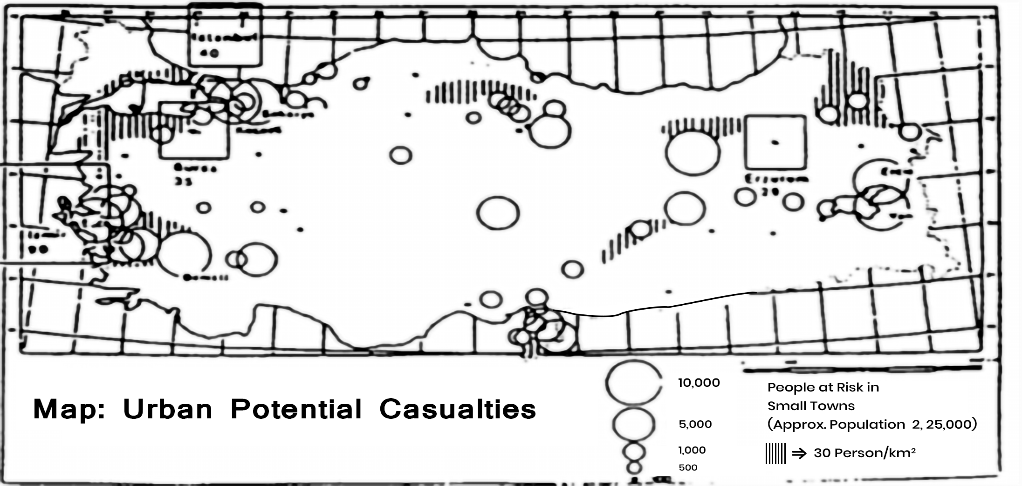
• This type of exercise is essential for preparedness planning in the event of an earthquake. The top section, located near the Marmara Sea, represents the Gemlik area, which is expected to experience severe damage. The left section corresponds to the Mudanya area, where moderate damage is anticipated. The central section illustrates the Bursa province, projected to suffer significant destruction, while the right section highlights the Yenisihir area, also expected to face heavy damage.
| TOTAL | Villages | Towns | Bursa City | Total |
| Houses lightly damaged | 34,000 | 21,000 | 50,000 | 105,000 |
| Houses heavily damaged | 15,000 | 9,000 | 30,000 | 54,000 |
| Houses collapsed | 4,000 | 2,000 | 6,000 | 12,000 |
| People killed | 2,000 | 800 | 1,500 | 4,300 |
| People injured | 6,000 | 2,500 | 4,500 | 13,000 |
| People Homeless | 73,000 | 36,000 | 13,000 | 122,000 |
Potential Loss Studies:
Mapping the potential impact of a hazard across a region or country helps identify communities that are most vulnerable to significant losses. The effects of the hazard are assessed for each area to determine which communities face the highest risk.
This approach highlights, for instance, the towns or villages that are expected to experience the most severe losses, enabling prioritization for loss reduction initiatives and ensuring that the most at-risk areas receive necessary aid and rescue assistance in the event of disasters of varying magnitudes.
Annualised Risk Mapping:
The annualized specific risk of any hazard at a given location represents the average anticipated total losses from all events over a set period. It is calculated by combining the probability of different hazard levels occurring within a specific timeframe with the consequences of each level of hazard, estimating the potential losses for that duration.
By summing the losses from all hazard levels, the total expected losses over time can be determined.
An annualized risk map illustrates the distribution of damage over both time and geographical areas, showing regions with concentrated damage over a year. This is expressed as a proportion of the total population or assets at risk.
| LOSS PARAMETERS FOR RISK ANALYSIS | |||
| Consequences | Measure | Tangible | Intangible |
| Deaths | Number of People | Loss of economically active individuals | Social and psychological consequences |
| Injuries | Number and injury severity | Medical treatment needs, temporary loss of employment activity by productive individuals | Social and psychological pain and recovery |
| Physical damage | Inventory of damage elements by number and damage level | Replacement and repair cost | Cultural losses |
| Emergency operations | Volume of manpower, man days employed, equipment and resources expended for relief | Mobilisation costs, investment and preparedness capability | Stress and overwork on relief participants |
| Disruption to economy | Number of working days lost, volume of production lost | Value of lost production | Opportunities, competitiveness reputation, |
| Social disruption | Number of displaced persons, homeless | Temporary housing relief, economic production | Psychologicalsocialcontacts, cohesion, community morale |
| Environmental impact | Scale and severity | Clean-up costs, repair costs | Consequences of poorer Environment, health risks, risk of future disaste |
Disaster Risk Reduction (DRR)
Disaster risk reduction refers to the systematic formulation and implementation of policies, strategies, and measures aimed at minimizing vulnerabilities, hazards, and the impact of disasters across society, all within the framework of sustainable development.
• It involves the concept and practice of lowering disaster risks through structured efforts to assess and address their root causes. This includes reducing exposure to hazards, decreasing the vulnerability of individuals and assets, ensuring responsible land and environmental management, and enhancing preparedness and adaptability to adverse events, including those linked to climate change.
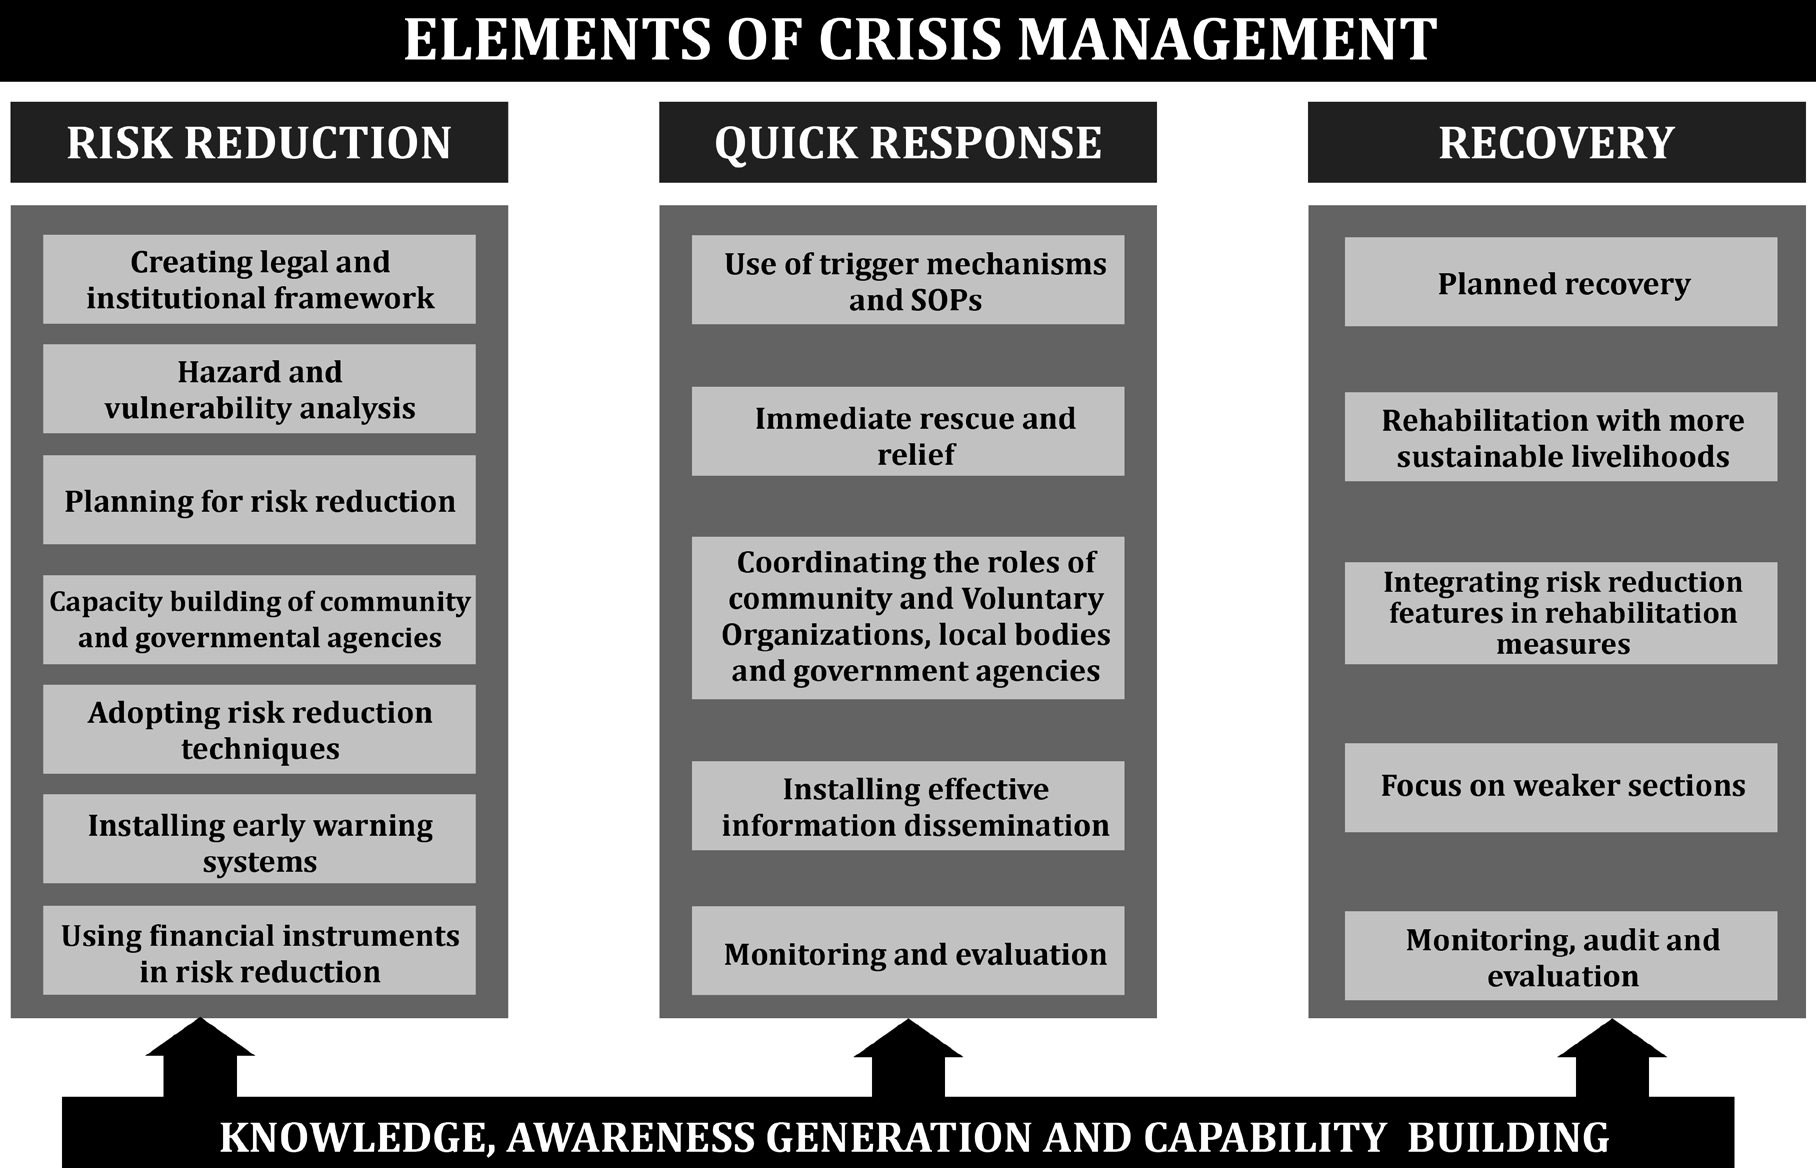
Figure: Elements of Crisis Management
• A holistic approach to minimizing disaster risks is outlined in the Hyogo Framework for Action, endorsed by the United Nations and adopted in 2005. Its intended goal is the significant reduction of disaster- related losses, including human lives and the social, economic, and environmental assets of communities and nations.
• The International Strategy for Disaster Reduction (ISDR) system serves as a platform for collaboration among governments, organizations, and civil society stakeholders to support the execution of this framework.
• While the term “disaster reduction” is sometimes used, “disaster risk reduction” is more appropriate as it acknowledges the continuous nature of disaster risks and the ongoing efforts needed to mitigate them.
• Adaptation refers to the process of adjusting natural or human systems in response to actual or anticipated climatic influences and their effects, thereby reducing harm or maximizing beneficial
opportunities.
• This concept, which primarily addresses climate change concerns, originates from the United Nations Framework Convention on Climate Change(UNFCCC).
• However, adaptation also applies to non-climatic challenges such as soil erosion or land subsidence. It can occur naturally, for instance, through market- driven changes, or it can be facilitated through deliberate policies and planning.
• Many disaster risk reduction strategies play a direct role in enhancing adaptation efforts.
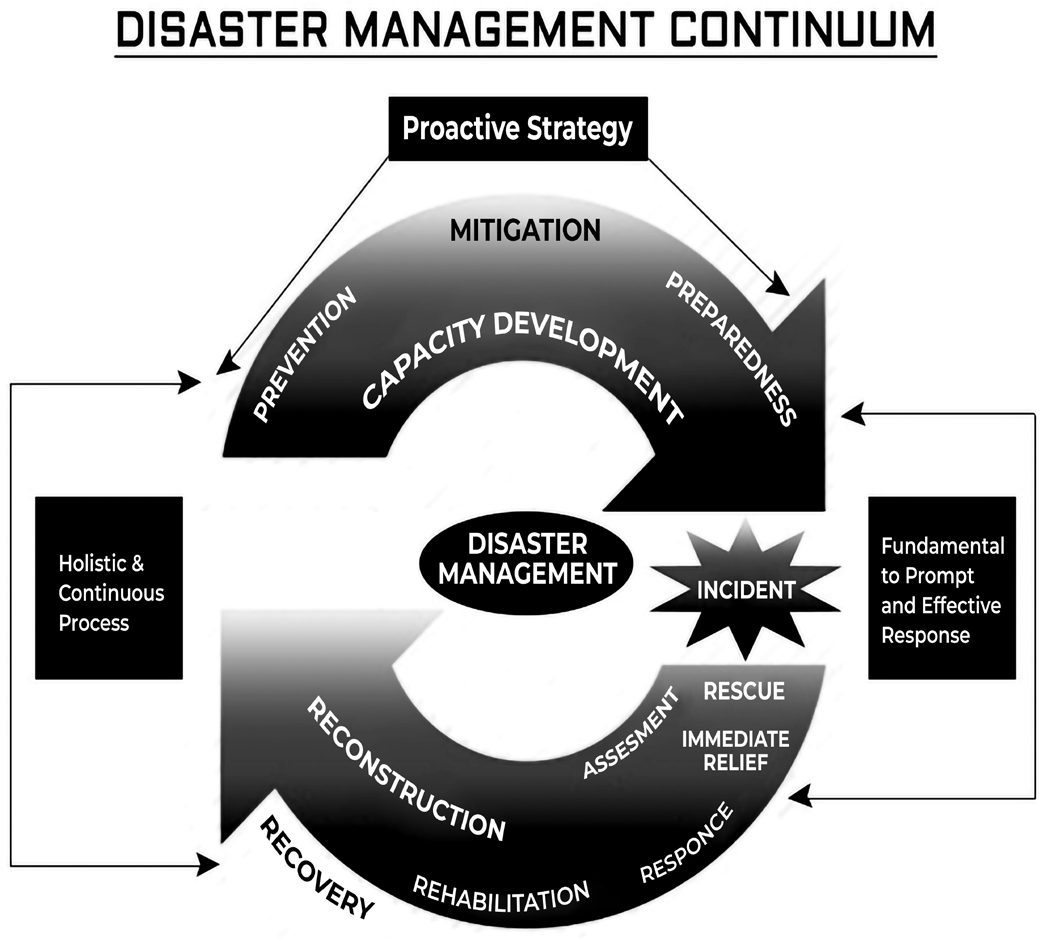
Figure: Disaster Management Continuum