THEORY OF CONSUMER BEHAVIOUR
The consumer has to decide how to spend his income on different goods. This is known as the choice issue by economists. Naturally, every customer wants to get a set of products that will satisfy him to the fullest.
What will be the best combination?
This is contingent upon the consumer’s preferences and purchasing power. Consumer “likes” are often referred to as “preferences.” Additionally, the consumer’s income and the costs of the goods determine what they can afford to buy.
Utility
Typically, a consumer bases his demand for a good or service on the utility or satisfaction that good or service provides.
• The utility of a commodity is its want-satisfying capacity. The utility obtained from a commodity increases with the degree of need for it or the intensity of desire for it.
• Utility is subjective. Different individuals can get
different levels of utility from the same commodity.
Measures of Utility
Total Utility: It refers to the total satisfaction or benefit that a consumer derives from consuming a certain quantity of a good or service. It represents the sum of the utility or satisfaction obtained from each unit of the good or service consumed.
Marginal Utility: The change in overall utility brought about by consuming one more unit of a commodity is known as marginal utility (MU). It measures the change in total utility resulting from a small change in the quantity consumed. Assume, for instance, that four bananas provide us with 28 units of total utility and five bananas provide us with 30 units. It is evident that using the fifth banana increased overall usefulness by two units (30 units minus 28 units). Consequently, the fifth banana has a marginal usefulness of two units
Law of Diminishing Marginal Utility
According to this, when a commodity’s use rises, its marginal utility decreases while the consumption of other commodities remains constant. In simpler terms, it means that the more you have of something, the less value or enjoyment you get from each additional unit.
Example: Suppose you’re eating ice cream on a hot day. The first scoop brings you immense pleasure and satisfaction. As you continue eating, each subsequent scoop provides less and less additional satisfaction. Eventually, you may even reach a point where you start to feel less enjoyment, and consuming more ice cream may become less desirable or even unpleasant.
Budget line
• In the language of economics, the budget is the sum of all the bundles of items that a customer can purchase at the going rates for her income.
• The budget line represents all bundles which cost the consumer her entire income.
The budget line is negatively sloping.
The budget set changes if either of the two prices or the income changes
#Note: The consumer has a limited income, that acts as a constraint to his/her maximizing behaviour, i.e. the budget constrains how much the consumers can consume. While budget line graphically represents the bundle of two goods which a consumer can buy with the given budget. As against, all the combinations in the positive quadrant, which lie on or below the budget line are called a budget set.
• Demand for a particular commodity, apart from the price of this commodity, depends on factors such as:
• Prices of other commodities
• Income of the consumer
• Tastes and preferences of the consumers
• Expectations
• Number of buyers
The relationships between product demand and price, subject to fluctuations in the economy keeping all other factors constant, are as follows, are as follows:
• If the cost of one of its alternatives increases, there will be a greater demand for the good. If the cost of one of its alternatives drops, there will be less of a demand for the good.
• If the price of an item’s complement drops, the demand for that good will rise. Take ice cream and fudge sauce, for instance
• When income rises, the desire for inferior goods declines. A normal good’s demand rises in response to income growth.
• A good’s demand will rise if its price decreases.
Demand curve
A demand curve is a visual representation of the varied amounts of a good or service that a buyer is willing to purchase at different prices, while maintaining the same prices of similar goods and the buyer’s income.
The downward-sloping demand curve indicates that the consumer is willing to purchase more commodity x at lower prices and less at higher prices.
As a result, the quantity desired and the price of a good have an inverse or negative connection that is known as the Law of Demand.
• The Law of Demand asserts that, barring unforeseen circumstances, there exists an inverse relationship between the demand and price of a given commodity. Put another way, as a commodity’s price rises, demand for it falls, and when it falls, demand for it rises, all other things being equal.
The two factors that are involved when a commodity’s price fluctuates the substitution effect and the income effect can also be used to explain the demand curve’s negative slope.
• When the price of good ‘x’ drops, consumers maximise their utility by switching to good ‘x’ for good ‘y’ to experience the same degree of satisfaction from the price adjustment. This leads to a rise in demand for good ‘x’.
• Moreover, as the price of good ‘x’ drops, consumer’s purchasing power increases, which further increases demand for bananas (and good ‘y’ ). This is the income effect of a price change, resulting in further increase in demand for bananas.
Demand function
• The amount of a good that the consumer optimally chooses depends only on its price if other goods’ pricing, the consumer’s income, and her tastes and preferences all stay the same.
• The demand function is the relationship that determines how much of an item a buyer chooses to purchase at an optimal price. As a result, while all other factors stay the same, the consumer’s demand function for a good indicates how much of the good they prefer at various price points.
• The consumer’s demand for a good as a function of its price can be written as X = f (P) where, X denotes the quantity and P denotes the price of the good.
Shifts in the Demand Curve
• A shift in the demand curve results from an increase in income because it affects the demand for a good at different prices, which is determined by the consumer’s preferences and the pricing of competing goods.
• For normal goods, the demand curve shifts rightward and for inferior goods, the demand curve shifts leftward.
• The demand for a good at each price point varies in response to changes in the price of a related good, given the consumer’s income and preferences. This causes a shift in the demand curve.
• If there is an increase in the price of a substitute good, the demand curve shifts rightward.
• On the other hand, if there is an increase in the price of a complementary good, the demand curve shifts leftward.
• The demand curve can also shift due to a change in the tastes and preferences of the consumer.
• If the consumer’s preferences change in favour of a good, the demand curve for such a good shifts rightward.
• On the other hand, the demand curve shifts leftward due to an unfavourable change in the preferences of the consumer.
• For example, the demand curve for ice cream is expected to move to the right throughout the summer as summertime tastes increase.
Revelation of the fact that cold-drinks might be injurious to health can adversely affect preferences for cold-drinks. This is likely to result in a leftward shift in the demand curve for cold-drinks
Elasticity of Demand
• Price elasticity of demand refers to how easily a good’s demand can adjust in response to changes in its price. The percentage change in a good’s demand divided by the percentage change in its price is known as the price elasticity of demand.
• Price-elasticity of demand for a good -
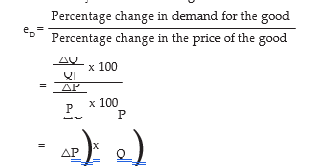
Where, P is the Initial price of the good, Q is the Initial quantity of the good, △P is the change in price and △Q is the change in quantity demanded.
• Elasticity can be described as:
Elastic or very responsive: Demand is considered to be very responsive to changes in market price when the percentage change in quantity demanded is greater than the percentage change in market price, and the estimated eD is greater than one (eD > 1). At that price, the good’s demand is considered elastic. For instance, the desire for upscale products
Inelastic or not very responsive: Demand for the good is considered to be inelastic at that price when eD is anticipated to be less than one (eD < 1) and the percentage change in quantity demanded is less than the percentage change in market price. For example, the demand for necessities
Unitary elastic demand is defined as follows: eD is believed to be equal to one (eD = 1), and the good is said to be unitary-elastic at that price when the percentage change in quantity demanded equals the percentage change in its market price.
SUPPLY
• The quantity that a company decides to sell at a specific price, considering technology and manufacturing factor costs, is its “supply.”
• Quantity supplied refers to a specific amount of commodity offered for sale at a particular price at a point of time.
• A company’s supply curve displays the output levels that the company choose to generate in relation to various market pricing, once more maintaining the same levels of technology and production factor prices.
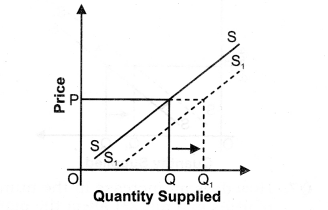
accordance with the law of supply, which stipulates that the amount provided of an item and its price are directly correlated. In other words, amount supplied rises with rising prices and falls with falling prices.
Law of Supply
• The law of supply asserts that, other things being equal, there is a direct and positive relationship between an item’s price and its amount supplied.
• As the price of a good rises, the suppliers will supply more of that good and as the price of a good falls, the suppliers will supply less of that good as the consumers are paying less for that good.
• E.g., If the price of rice is 10 then the quantity supplied is 100. So, when the price increases to 20, the quantity supplied becomes 200. Similarly, if the price decreases from Rs. 20 to Rs. 10, the quantity supplied decreases from 200 to 100.
The Theory of The Firm Under Perfect Competition
• Perfect Competition - A perfectly competitive market has the following defining features:
• The market consists of a large number of buyers and sellers. It means that each individual buyer and seller is very small compared to the size of the market. This means that no individual buyer or seller can influence the market by their size.
• Each firm produces and sells a homogenous product i.e., the product of one firm cannot be differentiated from the product of any other firm. It means that the product of each firm is identical. So, a buyer can choose to buy from any firm in the market, and she gets the same product.
• Entry into the market as well as exit from the market are free for firms. The existence of a large number of enterprises is contingent upon this requirement. There may be fewer businesses in the market if entry was challenging or prohibited.
• Information is perfect. It suggests that every seller and every buyer is fully aware of the product’s quality pricing and other pertinent information, as well as the state of the market.
Market Equilibrium
• The goals of consumers are to maximise their preferences, while the goals of businesses are to maximum their profits. In the equilibrium, the goals of the firms and customers are consistent.
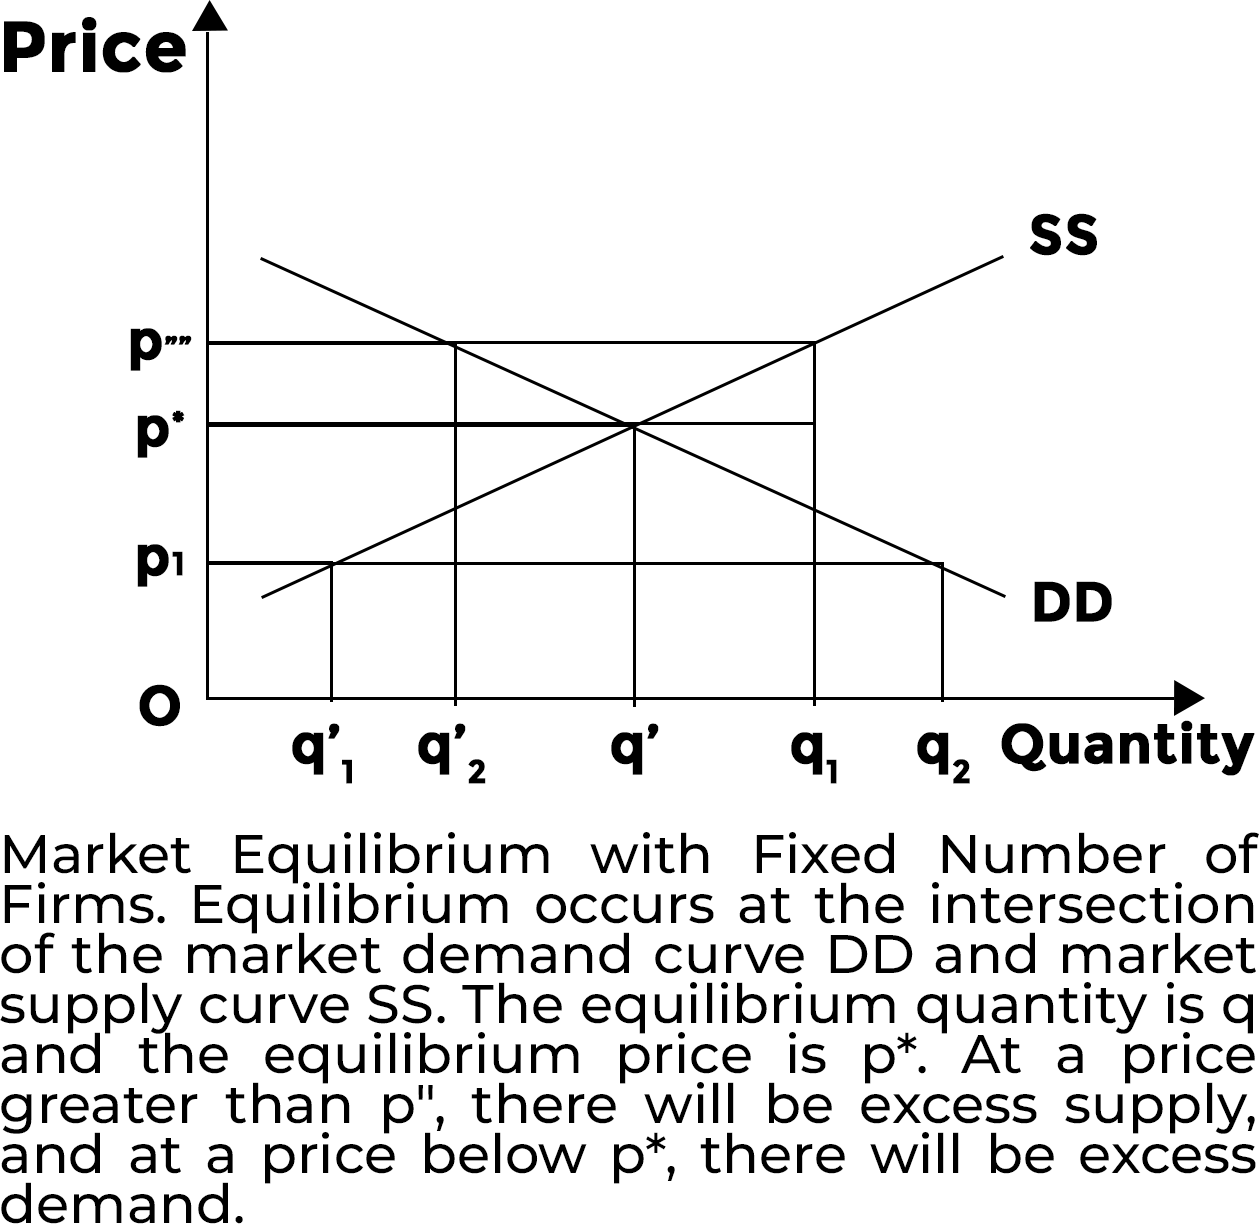
• A state in which all consumers’ and enterprises’ plans align and the market clears is known as an equilibrium. When the market is in equilibrium, supply and demand are equal; that is, the total amount that all businesses want to sell and the total amount that all customers want to purchase.
• The amount bought and sold at the equilibrium price is known as the equilibrium quantity, and the price at which equilibrium is reached is known as the equilibrium price.
• If market supply surpasses market demand at a given price, we refer to this as an excess supply in the market; conversely, if market demand surpasses market supply at a certain price, we call this an excess demand in the market at that price.
• Therefore, equilibrium in a perfectly competitive market can be defined alternatively as zero excess demand-zero excess supply situation.
• There is a propensity for prices to fluctuate whenever market supply and demand are out of balance, which results in an unbalanced market.
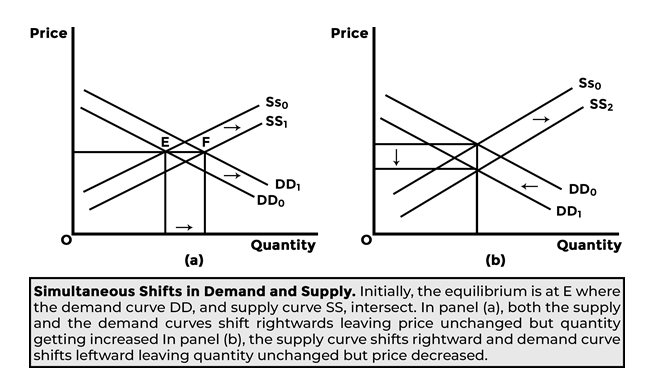
Simultaneous Shifts of Demand and Supply
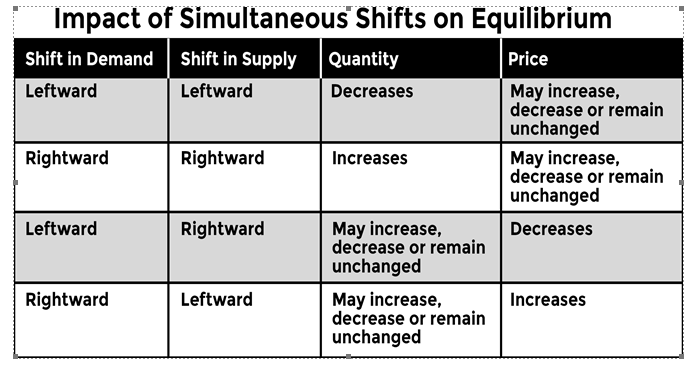
The simultaneous shifts can happen in four possible ways:
• Both supply and demand curves shift rightwards.
• Both supply and demand curves shift leftwards.
• Supply curve shifts leftward and demand curve shifts rightward.
• Supply curve shifts rightward and demand curve shifts leftward
Price Floor: The government establishes floors or minimum prices for various commodities and services because it is undesirable for their prices to drop below a specific point. Price floors are lower limits set by the government on what can be charged for specific goods or services. The most well-known instances of price floors being imposed are minimum wage laws and agricultural price support programmes.
• Imposition of price ceiling below the equilibrium price leads to an excess demand.
• Imposition of price floor above the equilibrium price leads to an excess supply
Non-competitive Markets
• Monopoly
A monopoly is a type of market arrangement where there is only one seller. A market system with a monopoly demands that
A specific commodity is produced by a for example, Indian Railways has a monopoly over railway transportation in India.
This commodity cannot be replaced by any other commodity;
And for this to continue over time, there must be enough barriers in place to stop any other company from joining the market and beginning to sell the commodity
In this market, consumers are price takers
Note
In general, there is an inverse relationship between competitive behaviour and competitive market structure: the more competitive the market structure, the less competitive the company behaviour. Conversely, more firms will behave competitively towards one another under a less competitive market structure. There isn’t another company to compete with in a monopoly.Each firm employs labour up to the point where the marginal revenue product of labour equals the wage rate
B Monopolistic Competition
A market structure in which there are many enterprises, their entry and exit are unrestricted, but the goods they produce are not all the same. We refer to this type of market structure as monopolistic competition
Monopolistic competition is commonly found in industries such as restaurants, clothing, personal care products, and consumer electronics, where firms try to differentiate their products through branding, design, or other unique features
C . Oligopoly
An oligopoly is a market structure in which there are many vendors in a given commodity market, but the total number of sellers is relatively small.
Duopoly is the name given to the unique instance of oligopoly in which there are precisely two vendors.
Assumptions:
The goods that both companies offer are uniform and
There isn’t a replacement product made by any other company.
The way businesses engage with one another determines the industry’s output level, pricing levels, and profit margins. In the event that one of the two firms in a duopoly decides to double its output, for instance, the overall supply in the market will rise significantly, resulting in a decrease in price. All of the industry’s businesses’ profitability are impacted by this price decline. In response, other businesses will make new decisions about how much to create in an effort to safeguard their own earnings